
Abstract
The high contact stresses between a railway wheel and rail result in local plastic deformation in both the rail and wheel steel. Optical metallography and hardness testing have traditionally been used to quantify the extent of deformation present; however, these methods only give limited information about the deformation mechanism and the role of microstructure. In this study, electron backscattered diffraction has been used to assess the depth and degree of deformation using the kernel average misorientation function; where the crystallographic misorientation between and within pearlite colonies has been quantified using a local average misorientation function. This technique gives invaluable crystallographic information about the deformed microstructure to aid understanding of the deformation mechanism. The application of the kernel average misorientation function has been modelled for idealised rail microstructures, including after the simulation of deformation via shear, in order to understand how the average kernel average misorientation values are developed under the high levels of deformation seen in rail steels.
Introduction
During the service life of a rail, it is subjected to localised multiaxial rolling/sliding contact stresses that exceed the yield stress of the material, resulting in significant plastic deformation and work hardening of the surface and subsurface regions. This heavy deformation can lead to the initiation of rolling contact fatigue cracks that can have catastrophic effects if allowed to propagate to failure. It is possible for surface initiated rolling contact fatigue cracks to be reduced, or eliminated through wear of the rail surface. However, if the natural wear rates are sufficiently low that the cracks are not worn at a rate equal or greater than the crack growth rate, then artificial means, such as rail grinding, are periodically implemented to remove short cracks and to the correct the rail head profile. 1 Understanding the mechanisms involved in the rail steel deformation is key to understanding what factors affect the deformation depth in specific locations on the rail and for different rail grades and secondly to identify a suitable depth for optimum rail grinding.
Microstructural observations and hardness measurements are the most used techniques to measure the depth of deformation in rail steels. Microstructural deformation mechanisms have been studied by optical microscopy, scanning electron microscopy, transmission electron microscopy, focussed ion beam analysis and electron backscattered diffraction (EBSD). 2–5 The traditional approach using EBSD to quantify microstructural deformation is by using the pattern quality as the variable affected by the amount of deformation, as EBSD theory indicates that the best quality patterns are obtained from a strain free lattice and any lattice strain present will lead to a degradation of the EBSD pattern quality. However, there are also many instrumental factors that can affect the quality of an EBSD pattern. 6 Moreover, it is only valid to draw comparisons from areas collected within a sample and not between samples, again due to small instrumental variations introduced during the sample change procedure. The ‘kernel average misorientation’ (KAM) is a parameter that is insensitive to instrumental variations. The KAM maps colour code the EBSD data according to the average misorientation between a point and its neighbours. The average misorientation for each point with respect to its neighbours is calculated, this is done for each indexed point in the orientation map and the values are then averaged to give a single value for the entire map. The main advantage of using this approach is that the misorientation calculation is performed on orientation measurements that are not affected by the small variations in instrumental parameters that affect the pattern quality approach. To date most papers that have discussed using the KAM method have performed so for materials that have undergone relatively small amounts of deformation (10–14%). 7,8 Rail steels can experience shear strains of over 600%, 9 and therefore the use of KAM for these conditions is novel.
This paper discusses different analysis methods used to determine a depth of deformation in a rail removed from service, highlighting what properties each method examines and what implications these may have on the rail’s integrity. In particular, the technique of measuring the KAM number from EBSD data is discussed.
Experimental
Experimental analysis was carried out on rails removed from service on the longitudinal face at the point on the gauge corner of maximum contact; this was established by conducting a transverse face hardness profile. The hardness profile was produced using Vickers microhardness measurements, using a Mitutoyo MVK H-1 hardness machine and 200 g load, carried out with 0·25 mm spacing over the rail transverse face, with contours drawn for regions of hardness within specified bands (Fig. 1). The rail was then sectioned at the location of maximum hardness. The depth of work hardening was then measured on the sectioned longitudinal face of the rail, where the depth of work hardening is defined as being the minimum depth below the surface at which the microhardness value is equal to the bulk microhardness value. The amount of microstructural shear and the visible microstructural deformation data were measured as a function of depth using optical metallography on samples that had been mounted, ground, polished and etched in 2% nital. For the purpose of this study, the microstructural shear angle has been defined as the angle made between the deformed grains and the normal to the rail surface, as shown in Fig. 2. A shear angle was only given to an area of microstructure that showed clear shear deformation, so it is possible for the microstructure to be deformed (i.e. showing an increase in hardness value) without being able to determine a shear angle. The microstructurally visible depth of deformation was measured from optical metallography images of etched samples and corresponds to the depth where no macroscopic deformation (such as shear) is observable; it is recognised that this is a subjective measure.
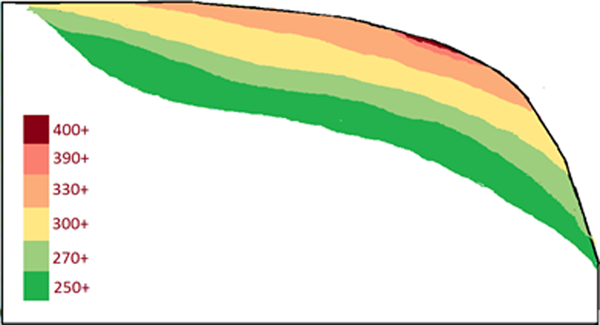
Hardness contour map for transverse face of rail removed from service used to identify position of maximum hardness
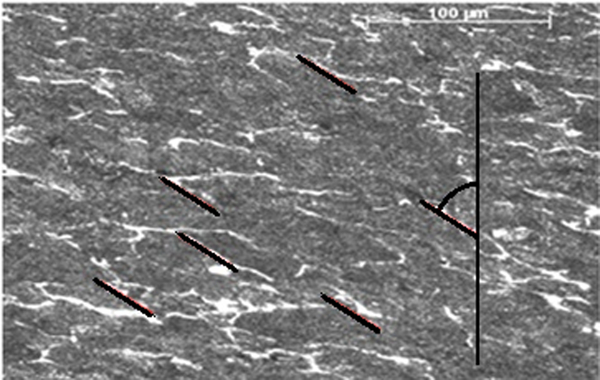
Microstructural shear measurement observed through directionality of proeutectoid ferrite predominantly surrounding prior austenite grains: image taken from ∼500 μm below rail surface (parallel to horizontal plane of image)
Analysis of EBSD was carried out on deformed and undeformed regions of the microstructure, using 8×8×5 mm samples. Orientation mapping and analysis was carried out on a Jeol 7000 FEG-SEM using an Oxford INCA EBSD system. The beam current used was 98 μA with an accelerating voltage of 25 keV. Data of EBSD were used to determine the misorientation angles between and within pearlite colonies using point to point analysis.
The KAM method was used to determine a depth of deformation from post processing of the EBSD orientation maps. 10,11 This method characterises the crystallographic misorientation of a given area by determining the average misorientation of a point relative to its neighbouring pixels. Areas of 80×160 μm have been mapped and KAM analysis carried out on each map, giving each pixel a value, the mean is calculated to give an ‘average KAM’ for that area, which is then referred to as the KAM value at the specific depth. The step size (distance between EBSD scan points/pixels) is a key parameter for accurate EBSD readings and is chosen depending on the microstructural feature size. 12 A step size of 1 μm was used in this study, as this is significantly smaller than the pearlite colony size, which is the main microstructural feature of interest in this work. Depending on the EBSD system used, it is also possible to vary the scan grid type between a hexagonal (Fig. 3), or a square type grid. The hexagonal type grid has a higher number of equidistant neighbours to the reference pixel compared with the square grid; for this reason the hexagonal grid has been used for EBSD and KAM measurements in this study.

Example of EBSD reference pixel (centre) with its six surrounding neighbours: relative misorientation between centre pixel and its surrounding neighbours is calculated and averaged to give KAM value for that point
Results and discussion
Figure 4 shows that different depths of deformation are recorded for the varying techniques of visual observation (based on optical metallography of etched samples), hardness measurement and KAM number quantification. Similar results are noted for depth of deformation between optically visible deformation (∼2·4 mm) and KAM generated depth of deformation (approximately 3–4 mm). The significance difference is between these two methods and that determined through microhardness (∼6 mm). The difference in depth noted between microhardness and optically visible microstructural deformation can be explained by the fact that the optically visible microstructural deformation only records the macroscopic changes of the microstructure due to shear. Figure 5 highlights the difference in optically visible appearance of the deformed and undeformed microstructure. The reason for the region of increased hardness, but no optically visible microstructural changes, can be explained by research carried out by Eden et al., 13 where changes in proeutectoid ferrite appearance was evident under scanning electron microscopy, in regions where there was no optically visible microstructural deformation (i.e. particularly no macroscopic shear deformation). The increased etching effect in the proeutectoid ferrite, resulting from a dislocation density increase, was found in the region where an increase in hardness only, was noted. When considering the reason for KAM showing a slightly greater depth of deformation than that of optically visible deformation, but not as high as microhardness, it should be noted that where both techniques take the macroscopic changes of the microstructure into account, it is only KAM that considers the crystallographic changes in the microstructure. The reasons for these changes and how these changes are interoperated by KAM are discussed in more detail throughout the paper.
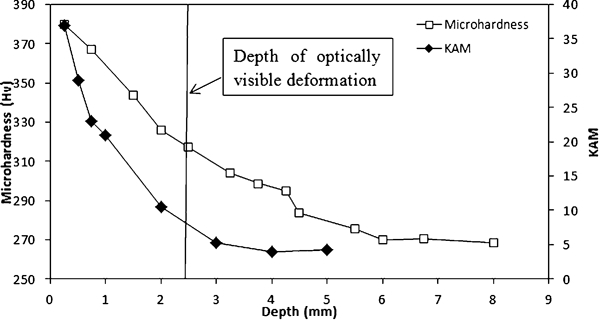
Microhardness, KAM number and optically visible microstructural deformation (arrowed) with depth for same position (longitudinal section of rail removed from service): KAM values generated are from EBSD area scans using step size of 1 μm, considering all misorientation values between 0 and 65° with no image clean-up
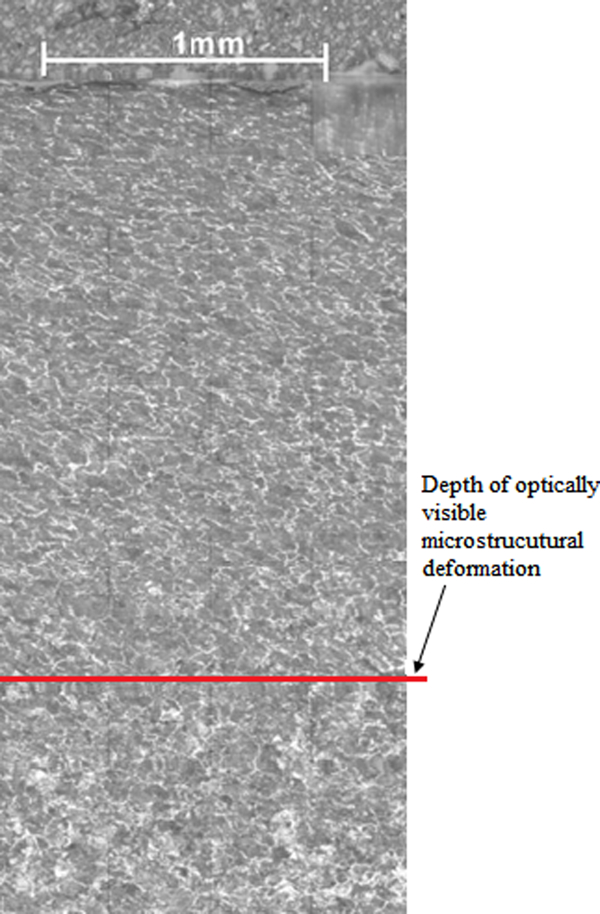
Micrograph of rail sample exhibiting microstructural deformation to depth of ∼2·3 mm: microstructural shearing is also evident and is more pronounced near rail surface
The method of EBSD, and in particular the KAM method, has been used to examine the mechanisms involved in the development of damage and to separate quantitatively the macroscopic and microscopic changes that occur. The macroscopic changes in the microstructure, due to shear, result in a change in shape of the microstructural areas with high angle boundaries (pearlite colony and prior austenite grain boundaries). The KAM method can also quantify more subtle changes in misorientation within the pearlite colonies, which can arise due to a change in either the quantity or magnitude of the low angle boundaries.
To determine the influence of the different microstructural factors (e.g. pearlite colony size, shear and internal misorientation in a pearlite colony) and instrumentation parameters (e.g. step size), the KAM method was modelled, using MATLAB. The first stage of the model was the generation of microstructures, that could be manipulated to represent a pearlitic rail steel microstructure (Fig. 6a ), consisting of pearlite colonies and their boundaries. Through the production of microstructures in the model it was possible to alter the size of the pearlite colonies and also the extent of shear present in the microstructure. Each pearlite colony was assigned a uniform internal misorientation (due to the presence of low angle boundaries between the pearlitic ferrite lamellae), the value of which was determined to be 3° by means of experimental point-to-point EBSD measurements taken from undeformed rail microstructures. Misorientation values assigned to the pearlite boundaries (high angle boundaries) were also taken from experimental point-to-point EBSD measurements across the colony boundaries in a rail steel; the average pearlite colony to pearlite colony boundary angle was found to be 25°. The KAM function was written into the program (i.e. the determination of the average misorientation between a point and its six neighbours, on a hexagonal grid where the distance between the point and neighbours was 1 μm) and applied to the computer generated microstructures such that both a ‘KAM map’ (Fig. 6b ), and average KAM value could be generated for the respective microstructure.
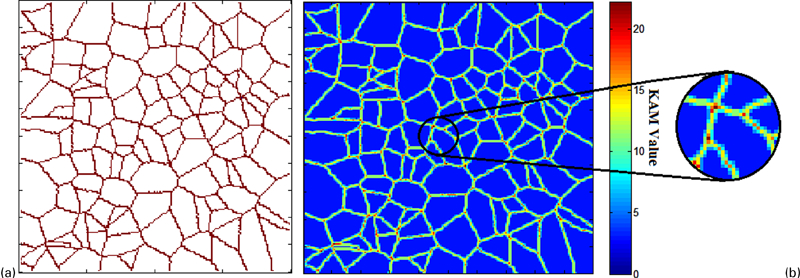
a randomly generated undeformed microstructure, representing pearlite colonies for area of microstructure measuring 300×300 μm, with corresponding modelled KAM map and b giving KAM value of 3·7 (similar to measured KAM value of 3·5 for undeformed R220 rail): magnified portion shows concentration of high KAM values at colony boundaries
Altering the relevant parameters in the model showed that an increase in colony size results in a reduction in KAM value. This is as expected since a smaller colony size will give a higher proportion of high angle boundaries to low angle boundaries than for a larger colony size, resulting in an increase in average KAM number for a given area. This is evident when looking at undeformed microstructure KAM values for different rail grades; for example R260 rail, with a smaller pearlite colony size than R220 rail, has a higher undeformed KAM value of ∼5 (compared to 3·5 for R220 grade rail). 350HT rail steel, with a smaller pearlite colony size due to heat treatment, shows an undeformed KAM value of ∼8. 14
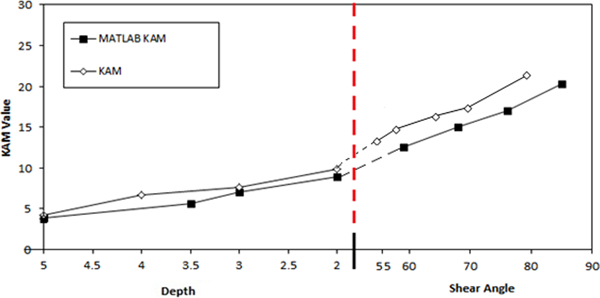
The effect of the near surface deformation resulting in shearing of the rail microstructure was replicated by applying a pure shear to the model generated microstructure from which a KAM map and average KAM number were generated. When comparing the model generated KAM number for a sheared microstructure with that measured experimentally, a similar trend of increasing KAM value with increasing amount of shear (i.e. increased shear angle) is seen as in Fig. 7. However, the absolute values produced by the respective methods differ, particularly for the regions of high shear.
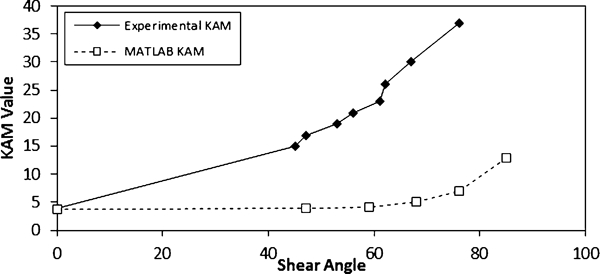
Modelled and experimentally measured KAM number with respect to shear angle, where model takes into account macroscopic shear only (i.e. no change in internal misorientation value within pearlite colonies)
The results shown in Fig. 7 indicate that macroscopic changes to the microstructure are not the only reason for an increase in the KAM value, as there is a difference between the experimentally measured and model KAM values. Changes in the low angle boundary misorientation values can also occur during deformation and this will affect the KAM values. In the initial model, the KAM values were generated using a single value (3°, determined experimentally from undeformed rail microstructures) for the low angle boundaries between ferrite lamellae within a pearlite colony. In order to determine how the low angle boundaries change with deformation, EBSD analysis was performed on deformed areas of the rail steel, then the data analysed after post-processing to remove the high angle boundaries (defined to be boundaries with a misorientation angle greater than 12°, determined using point to point EBSD analysis as the threshold angle differentiating angles between and within a pearlite colony). Analyses of EBSD and KAM were carried out in the region where no microstructural shear deformation was evident, but work hardening had occurred (2–4 mm below the rail surface) and in the region where microstructural shear occurred. Model results, using the different internal misorientation values determined experimentally and ignoring high angle boundaries (and hence the effect of shear), shows the KAM value, in the undeformed region of 3° increasing to 10° in the deformed region due to changes within the pearlite colonies (Fig. 8).
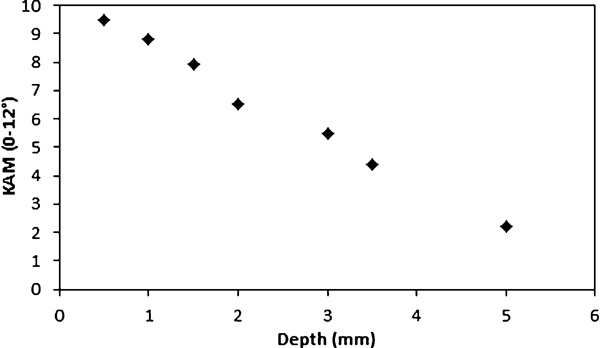
Graph showing increase in KAM value within colony with decreasing depth to rail surface (i.e. increasing deformation)
Heavy deformation in the near surface region of the rail results in a low pattern quality and low confidence index in the EBSD mapping system; this effect becomes more acute, the more severe the deformation. The low pattern quality results in points being indexed incorrectly due to the phenomena of pseudo-symmetry, where the system believes there is more than one correct solution for a single point and having to choose between the two; the value it chooses can be incorrect. It has been found that the values given to the point identified incorrectly are very high misorientations, ∼60°. Owing to their location, for example, within a pearlite colony, they can be identified clearly (Fig. 9). For the image clean-up regime grain dilation was used, where spurious results, or un-indexed points, are smoothed out by expanding the neighbouring area of the highest confidence index to assign it that value. To remove any erroneous points, of ∼60° due to pseudo symmetry, 15 that were not cleared through the image clean-up regime misorientation values were capped at 55°, allowing for confidence errors in the EBSD system, 16 resulting in a reduced KAM value, particularly in the highly deformed region.
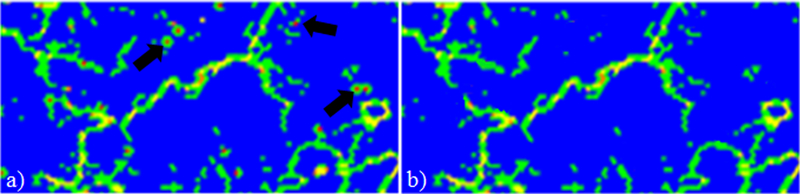
Maps (KAM) of same area a before and b after image clean-up to remove erroneous results: examples of incorrectly identified points are arrowed in a
The addition of the adjusted internal KAM values (to account for the low angle boundary changes) (Fig. 8), to the model resulted in an increase in model generated KAM values, particularly significant in the region with no determinable shear angle (2·3–5 mm depth). The modelled values agree well with the experimental KAM values in this region (Fig. 10).
Graph showing the modelled and experimentally determined KAM values at the different given depths/shear angles below the rail surface (where the model results take into account the increase in misorientation angles within pearlite colonies and the experimental results have been post-processed to remove erroneous values due to pseudo-symmetry). The shear angle was used in the region 0–2 mm subsurface as this correlates to the model simulations
In the region where there is microstructural shear there are still discrepancies between the model and experimentally determined KAM values, with the difference becoming larger close to the rail surface where the deformation is greatest. Therefore, in this region there are further factors, either in the model or the experimental KAM function, that need to be taken into account. One factor that has been identified for further analysis is possible changes in the high angle boundary misorientation values with deformation; however, as the microstructure in this region is very heavily deformed, identifying colony boundaries is difficult.
Conclusions
A model of a typical pearlitic rail microstructure, represented by the pearlite colonies, has been generated in order to assess the significance of the microstructural state on the KAM value. Experimentally determined high (between colony boundaries) and low (between pearlitic ferrite lamellae) angle misorientation values were included and a function was written that allowed the KAM value to be calculated for the microstructure. Experimental measurements of KAM values with depth from the surface, under the contact patch, for a rail removed from service were made. The main results of the work are as follows.
It was found that filtering of the experimental data was required, particularly in the regions where macroscopic shear occurred (near the rail surface), to remove errors in misorientation value identification (due to pseudo-symmetry effects).
The KAM values within the pearlite colonies increased from an average of 3° in the undeformed microstructure to 10° in the deformed area.
The model simulations were able to take into account the changes to pearlite colony shape due to macroscopic shear and determine the corresponding increase in KAM value.
The results showed that there was good agreement between the model and experimental KAM values when no macroscopic shear occurred. In the regions where the microstructure was altered by shear both the model and experimental results showed the same trend of increasing KAM values; however, the model values were less than those measured.
Footnotes
Acknowledgements
The authors would like to thank the School of Metallurgy and Materials at the University of Birmingham for the provision of research facilities, and Tata Steel UK Limited for provision of test material, data and financial support of the project along with EPSRC for financial support. Specific thanks to Jay Jaiswal and David Wilcox at Tata Steel UK for guidance and the use of test facilities.