
Abstract
Selected IMPHOS heats, 1 2 have been used to make observations on decarburising and dephosphorising performance, scrap melting and slag foaming characteristics during BOS refining. If it is assumed that decarburisation takes place solely in the slag/metal emulsion then maximum metal residence time in the emulsion is just under 9 seconds and at peak decarburisation time, the maximum amount of metal in the emulsion is ∼50% of the total metal content in the converter. To evaluate the effects of changes in slag component chemistry on phosphorus refining it is necessary to account for changes in slag weight, which can change substantially throughout a heat and be significantly different heat-to-heat. Dephosphorising performance depends on the thermodynamic stability of slag phases that are able to take up phosphorus and the distribution of phosphorus between these thermodynamically stable phases. The application of proprietary thermodynamic models such as MTDATA and FACTSage has helped to clarify such events. Skull build-up on the scrap pile is at a maximum when the bulk bath temperature is ∼1460°C. At this time, the solid scrap and skull component of the bulk bath makes-up just over 60% of all the metal charged to the converter. All scrap and skull is melted out at a bulk bath temperature of ∼1610°C. The stability of the foamy slag/metal emulsion changes over the period of the blow. Slag height increases with an increase in FeO(tot)wt-% and decreases with a decrease in decarburisation rate and the collapse of the foamy slag.
Introduction
A main aim of the recently completed steelmaking project improving phosphorus refining (IMPHOS) was to examine in a systematic and comprehensive way the processing events that take place during basic oxygen steelmaking placing special emphasis on phosphorus refining.
The study was able to provide a practical description of the formation and development of the slag/metal emulsion and its capability for refining throughout the blow relative to the bulk metal bath. The approach featured a new automated sampling system that was designed and built for the 6t universal converter at the Swerea MEFOS Metallurgical Research Plant (MRP) in Lulea, Sweden.
The sampling system included a unique use-once sampling lance unit, designed to take up to seven slag/metal emulsion samples simultaneously from known, prespecified heights inside the converter (Fig. 1) and an automated sample lance delivery system, designed to deliver a new sampling lance to the converter eight times during each blow (every two minutes from the start of blow).
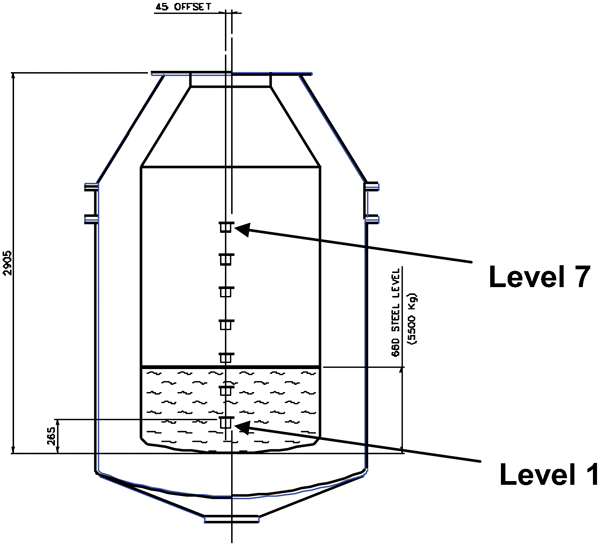
Position of seven lidded sample pots inside Swerea MEFOS 6t Converter
Therefore, the sampling system was able to take up to 56 (7×8), rapidly cooled slag/metal emulsion samples per heat. Temperature profiles for each heat were also obtained using the converter sublance.
The system design, operating practices and procedures for sample preparation have been described in detail1 and a comprehensive account of the observed macrofeatures of the converter operation have been published recently.2 This paper is a discussion on how IMPHOS results may be used to explain some of the observed processing events.
Millman et al. 2 were able to show that converter refining is associated with a very rapid metal circulation rate in the evolving slag/metal/gas emulsion (from now called ‘emulsion’ and defined within boundary limits – see the section on ‘Decarburisation’) which, for a major part of the blow can be between 5 and 10% of the total metal weight (tap weight) per second (Fig. 2). The contribution of the metal circulation rate to the overall decarburisation reaction is discussed below.
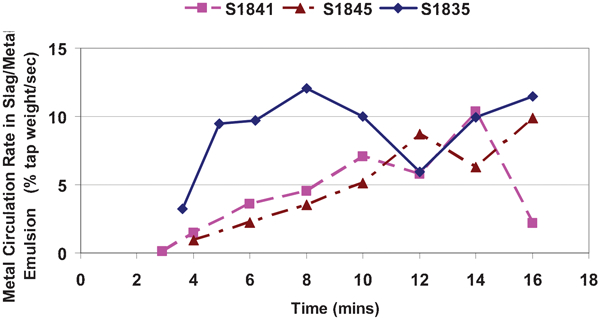
Metal circulation rate profiles for three IMPHOS heats
Decarburisation
All IMPHOS heats display similar carbon removal profiles and the profiles for heat S1845 are typical. For this heat, the carbon removal profile for the bulk metal bath – sampled at Level 1 (Fig. 1), is compared with the best-fit carbon removal profile for the metal component of the emulsion. It is important to note that the emulsion is defined as having boundary limits located away from the metal bath interface region, between Level 4 and Level 7 inclusively (Fig. 1). Figure 3 shows that the carbon content in the metal component of the emulsion is always significantly lower than the carbon content of the bulk metal bath except towards the end-of-blow when the two profiles come together.
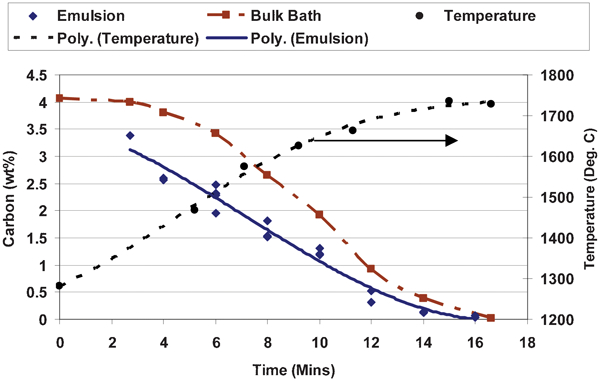
Carbon removal and temperature profiles for heat S1845
Figure 3 shows also that apparent carbon removal in the bulk metal bath is suppressed for the first ∼3 min of the blow and that the carbon level in the bulk metal bath changes only at a relatively slow rate up to ∼6 min into the blow. Between ∼6 min and ∼12 min into the blow, the apparent compounded carbon removal rate in the bulk metal bath is higher than that in the metal component of the emulsion with an accelerated period between ∼10 and ∼12 min into the blow. From ∼12 min into the blow, it slows down again and from ∼14 min and towards blow-end the carbon removal rate profiles are similar. Because the metal component of the emulsion has a relatively large surface area for reaction compared with the bulk metal bath, it is assumed that all the decarburization takes place in the emulsion. Taking the residence time of metal in the emulsion as Δt seconds, then dC/dt in the emulsion is
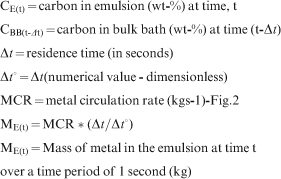
For heat S1845, Fig. 4 shows the dC/dt profile derived from off-gas analysis (normalised to real time by removing the 27 s analysis delay). The dC/dt profile for the metal component of the emulsion is matched to this plot by adjusting the value of the residence time. It is seen that when the dC/dt profile for the metal component of the emulsion matches the off-gas derived dC/dt profile then maximum metal residence time in the emulsion is 8·8 s at 9 min into the blow. At the beginning of the blow the metal residence time in the emulsion is ∼1·6 s (at 3 min) and at the end of blow the metal residence time in the emulsion is ∼0·5 s (at 15 min), which is lower than previous estimates.5 – 13,15–28
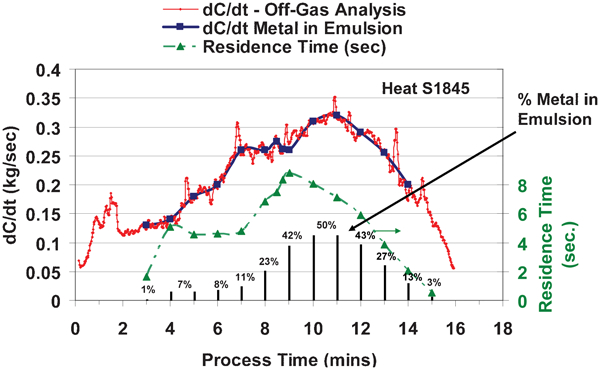
Heat S1845: dC/dt profile for off-gas analysis; dC/dt profile for metal-in-emulsion; residence time; and % metal in emulsion
The percentage of metal in the emulsion is given by
Figure 4 shows also that at peak decarburisation rate (∼11 min into the blow), the percentage of metal in the emulsion is at a maximum (∼50%). The percentage of metal in the emulsion is low at the beginning of the blow (∼1% at 3 min) and at the end of blow (∼3% at 15 min). This range of values for the percentage of metal in the emulsion complies with many previous studies.3 – 13,15–28 It should be noted that at a fixed oxygen lance height, the distance between the lance tip and the metal bath ‘surface’ will vary significantly because of the changing amount of metal that is transferred between the bulk metal bath and the emulsion throughout the blow.
For heat S1845, Fig. 5 shows the change in the amount of porosity in solidified samples taken from the bulk metal bath at Level 1 (Fig. 1) every ∼2 min during the blow and these images are typical of solidified bulk metal bath samples for all IMPHOS heats. It is observed that there is no sample porosity for the first 4 min into the blow but at 6 min into the blow, blowholes begin to appear in the solidified bulk metal bath sample indicating that the amount of dissolved oxygen is high enough to start CO evolution during sample solidification.
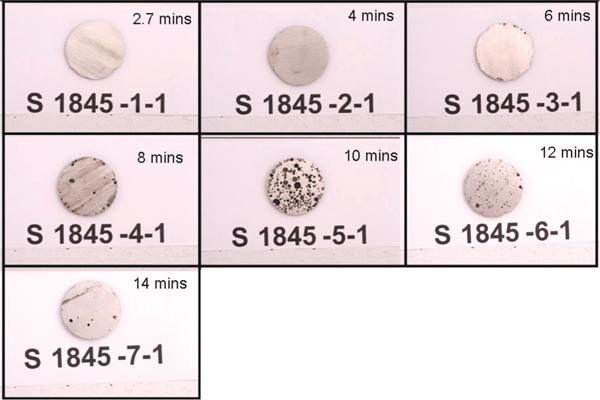
Heat S1845: level 1 steel samples taken from bulk metal bath throughout blow
Samples at 8, 10 and 12 min into the blow show maximum blowhole intensity and from 14 min, the blowhole intensity decreases again as the amount of dissolved carbon in the bulk metal bath decreases below ∼0·5%C at a bath temperature ∼1700°C (Fig. 3). The extent of gas evolution that takes place during sample solidification depends on the amount of dissolved oxygen and dissolved carbon in the liquid steel bath. During the first ∼4 min of the blow, the amount of oxygen dissolved in the liquid steel bath is below that required for generating CO gas bubbles during sample solidification.
Unfortunately, dissolved oxygen levels in the bulk metal bath were not measured during the IMPHOS trials. However, on the basis of measured steel bath compositions and temperatures, thermodynamic calculations were performed on heat S1845 using the commercial software package FACTSAGE (v.6·2, http://gtt.mch.rwth-aachen.de/gtt-web/factsage) to predict the equilibrium dissolved oxygen content of the liquid steel bath over the whole blowing period.
A bespoke database was used because this gave predicted equilibrium dissolved oxygen results that were closer to published data than the provided FSstel database. The reason for this requires further investigation.
Equilibrium dissolved oxygen content is plotted against process time in Fig. 6. At ∼4 min into the blow, ∼22 ppm dissolved oxygen (in equilibrium with the gas phase), is predicted at 1 atm, and ∼44 ppm at 2 atm. Measured early blow total oxygen levels in the bulk metal bath reported in the literature [Koch3, 4 ∼60 ppm, Price5 ∼50 ppm] are generally higher than these calculated equilibrium values.
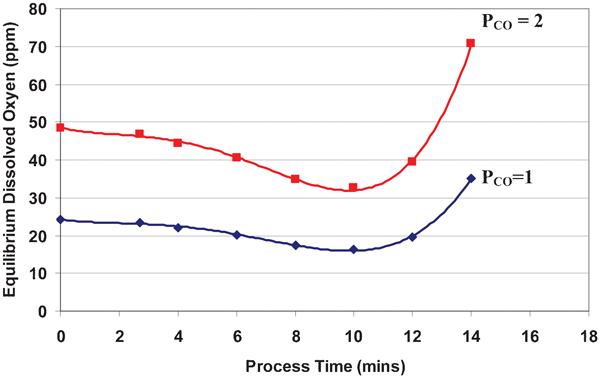
Heat S1845: change in equilibrium dissolved oxygen content in liquid steel bath FACTSage (v.6·2, bespoke database)
Metal profiles
Five different phosphorus removal profile groups were identified in the IMPHOS trials2 and each IMPHOS heat was placed into one of these five groups.
The phosphorus removal profiles described the way in which phosphorus was removed from the bulk metal bath and were presented as:
near constant
phosphorus reversion
high phosphorus removal
phosphorus reversion and slowdown
reversion with rapid phosphorus removal.
Of the twenty analysed IMPHOS heats, heat S1835 was placed into group (iv), heat S1845 was placed into group (ii) and heat S1841 was placed into group (iii). Table 1
Base Data for IMPHOS heats S1835, S1845 and S1841
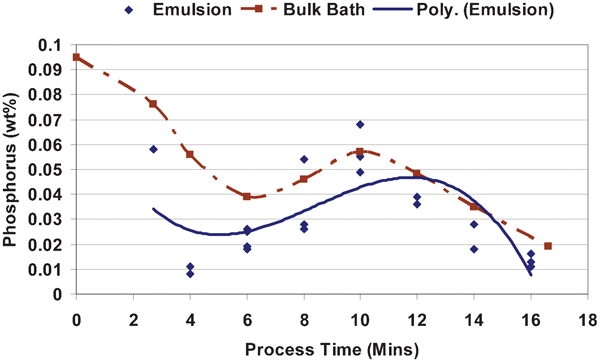
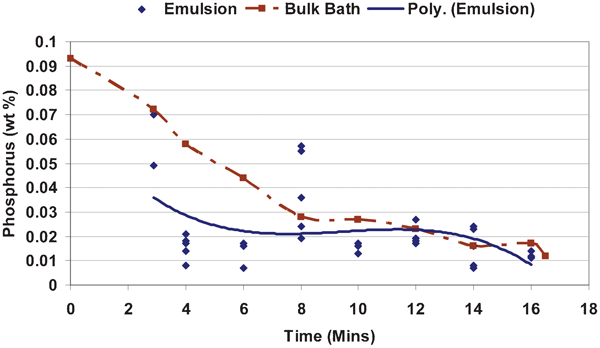
For heats S1835, S1845 and S1841, phosphorus removal profiles for the metal component of the emulsion and the bulk metal bath are shown in Figs. 7–9 respectively.
Heat S1835: phosphorus removal profiles for metal component of emulsion and bulk metal bath
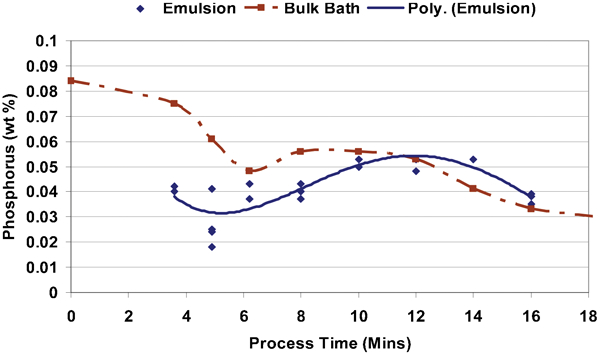
Heat S1845: phosphorus removal profiles for metal component of emulsion and bulk metal bath
Heat S1841: phosphorus removal profiles for metal component of emulsion and bulk metal bath
Slag profiles
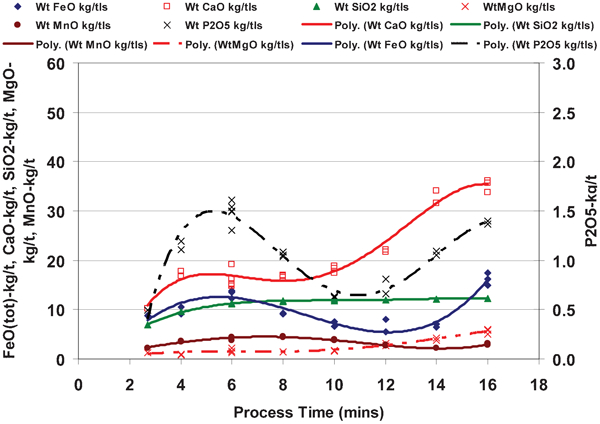
For IMPHOS heat S1835, Fig. 10 shows the progress of the main slag components (in wt-%) during the blow. The FeO (wt-%) content is high early in the blow and this supports lime dissolution into the slag thereby increasing the dissolved CaO (wt-%) content through the blow. The FeO content continuously decreases through the blow and finishes at a very low value (∼5 wt-%) at end-of-blow. P2O5 (wt-%) peaks at just below 2·5% at around 6 min into the blow, reaches a minimum of ∼0·8 wt-% at ∼10 min into the blow and then rises again towards the end of the blow.
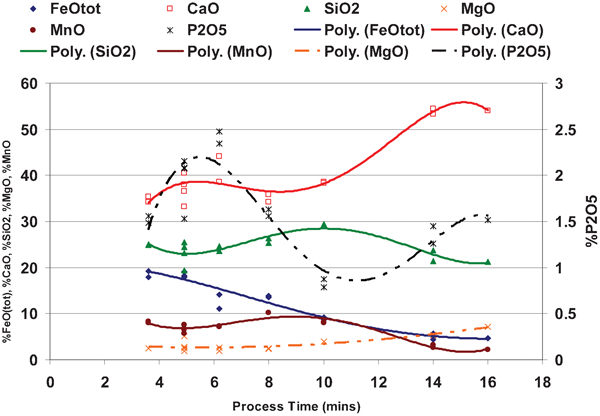
Heat S1835: slag evolution (wt-%)
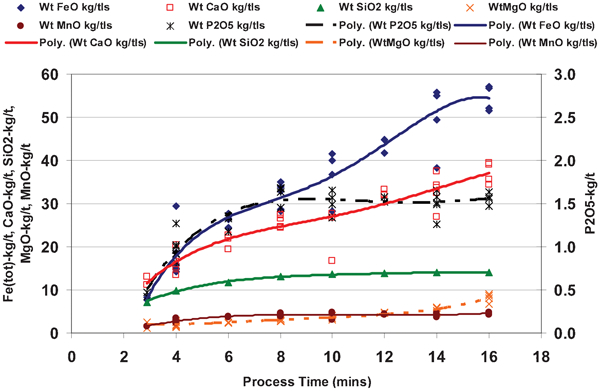
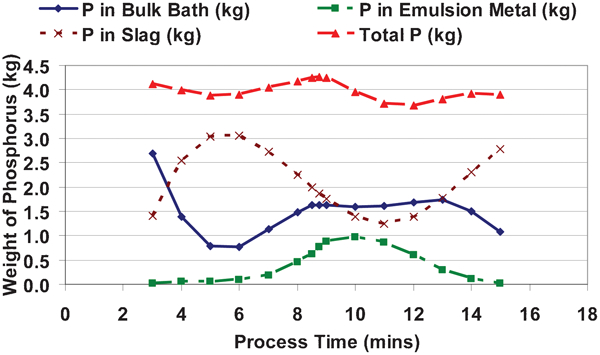
For IMPHOS heat S1845, Fig. 11 shows the progress of the main slag components (in wt-%) during the blow. The slag constituent profiles for heat S1845 are very similar to many published accounts,6 – 9 showing an early and high FeO (wt-%) content which supports lime dissolution into the slag thereby increasing the dissolved CaO (wt-%) content through the blow. The FeO content decreases from around a third of the way through the blow, reaches a minimum and then rises again towards the end of the blow. P2O5 (wt-%) peaks at just below 3% at ∼5 min into the blow, reaches a minimum of ∼1·3 wt-% at around 11 min into the blow and then rises again towards the end of the blow. The late rise in P2O5 (wt-%) does not correspond with the late rise in FeO (wt-%). The final FeO content is ∼20 wt-%.
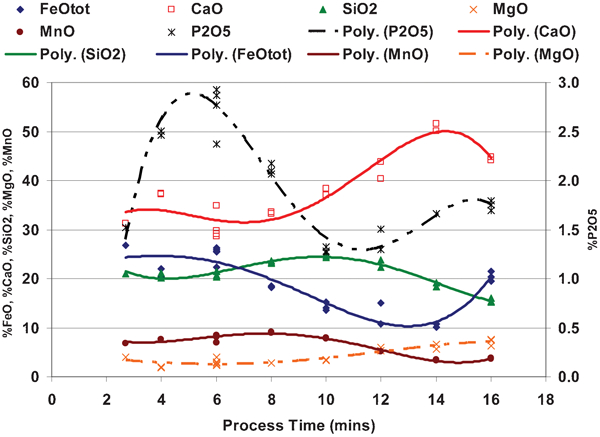
Heat S1845: slag evolution (wt-%)
For IMPHOS heat S1841, Fig. 12 shows the progress of the main slag components (in wt-%) during the blow but this set of slag constituent profiles are very different from IMPHOS heats S1835 and S1845 profiles. In this case, the early and high FeO (wt-%) content increases to ∼38% at ∼6 min and then more or less flattens-out at ∼40% while the dissolved CaO (wt-%) content in the slag remains constant at ∼30% for the whole blow. P2O5 (wt-%) peaks at just below 2% at ∼6 min into the blow but then continues to fall all the way to end-of-blow.
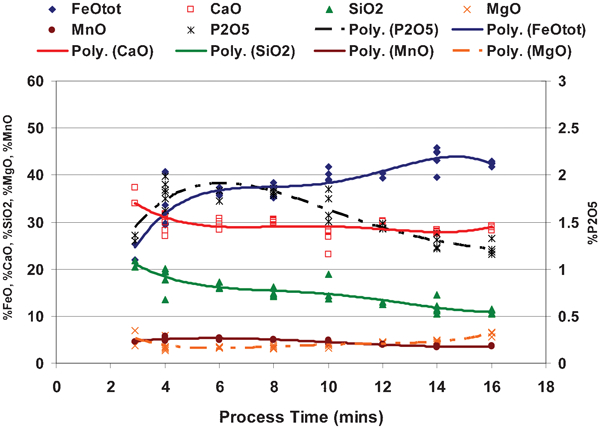
Heat S1841: slag evolution (wt-%)
Figure 13 shows the evolution of the slag compositions for heat S1835, S1845 and S1841, normalised to the CaO–SiO2–FeO ternary system and superimposed onto published liquidus contours.14 The slag paths followed by the three heats are very different although the path followed by heat S1845 is similar to that observed by other researchers.6 – 8 Heat S1835 appears to go into and out of the C2S region during the blow and is firmly in this region at blow end while heat S1845 is also in and out of the C2S region during the blow but heads out of this region and towards the FeO corner at end-of-blow. Heat S1841 is in the C2S region during the initial stages of the blow before moving towards the FeO corner where it is finishes up at blow end.
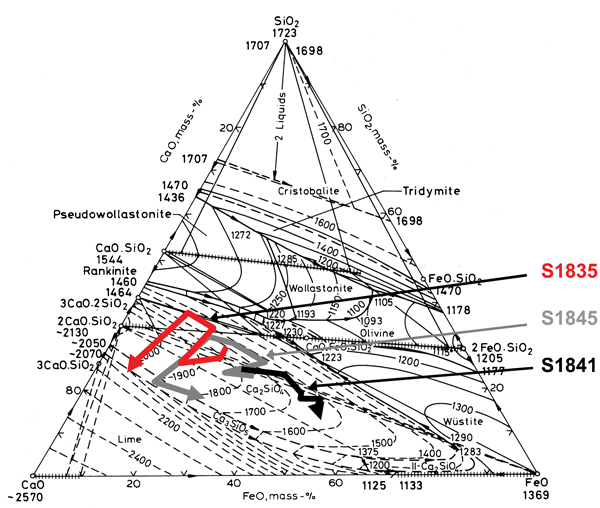
Slag paths for heats: S1835, S1845 and S1841
For these three IMPHOS heats, the slag constituent changes are more usefully expressed by calculating the slag weight and then converting changes in weight percentages to changes in mass. Slag weight changes through the blow were calculated on the basis of a silicon balance.
For IMPHOS heat S1835, Fig. 14 shows that the slag weight increases by a small amount from the beginning of the blow and then flattens out to around 50 kg/tls at approximately 7 min into the blow. From ∼13 min into the blow, there is another small increase in slag weight and it reaches ∼70 kg/tls at blow end.
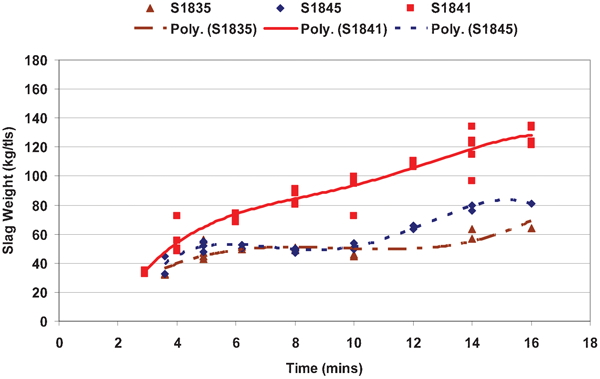
Changes in slag weight for heats S1835, S1845 and S1841
For IMPHOS heat S1845, Fig. 14 shows that the slag weight increases by a small amount from the beginning of the blow and then flattens out to ∼50 kg/tls at approximately 5 min into the blow. From ∼10 min into the blow, the slag weight increases again and reaches ∼80 kg/tls at blow end.
For IMPHOS heat S1841, Fig. 14 shows that the slag weight increases continuously from beginning to the end of blow and reaches ∼130 kg/tls at blow end. This is nearly double the developed slag weights of the other two heats.
For IMPHOS heat S1835, Fig. 15 shows the progress of the main slag components during the blow but now expressed in kg/tls. It is seen that the general trends are similar to those in Fig. 10.
Heat S1835: slag evolution (kg/tls)
For IMPHOS heat S1845, Fig. 16 shows the progress of the main slag components during the blow but now expressed in kg/tls. In a similar way to heat S1835, it is seen that the general trends are similar to those in Fig. 11 except that both FeO and dissolved CaO start off low and then rise and plateau-out at ∼6 min into the blow before the FeO reduces to a minimum at ∼12 min while the dissolved CaO rises. The P2O5 profile is similar to that shown in Fig. 11 showing a minimum at ∼11 min into the blow a difference being that the final value of P2O5 at blow end is comparable to that reached at the peak time of ∼5 min into the blow. As observed for Fig. 11, the late rise in P2O5 does not correspond with the late rise in FeO.
Heat S1845: slag evolution (kg/tls)
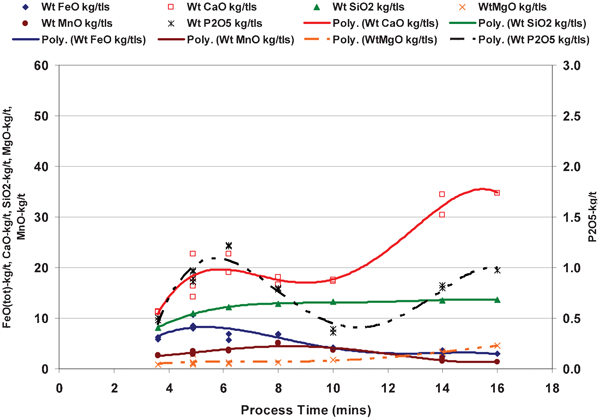
For IMPHOS heat S1841, Fig. 17 shows the progress of the main slag components during the blow but now expressed in kg/tls. In this case, the slag constituent profiles appear quite different from those in Fig. 12. Both FeO and dissolved CaO show a steady increase during the course of the blow while P2O5 rises to a maximum at ∼ 7 min into the blow and then plateaus out for the rest of the blow at peak value. The relatively high slag weight profile associated with this heat (Fig. 14) results largely from the generation of especially large amounts of FeO through the blow.
Heat S1841: slag evolution (kg/tls)
Slag phase thermodynamics
Changes in slag chemistry and temperature give rise to thermodynamically stable slag phases that appear at different times throughout the blow. In order to determine the nature of these slag phases together with the periods through which they are thermodynamically stable, proprietary thermodynamic software MTDATA (http://www.npl.co.uk/science-technology/advanced-materials/mtdata/), has been applied to IMPHOS heats S1835, S1841 and S1845. These heats are from phosphorus removal groups: (iv), (iii) and (ii) respectively (see the section on ‘Metal profiles’).
The chemical components used were CaO–SiO2–FeO–Fe2O3–MgO–MnO–Al2O3–P2O5.
The following solution phases were allowed:
amorphous liquid slag phase containing slag components mentioned above (oxide_liquid)
di-calcium silicate phase (C2S): a solid solution of Ca2SiO4 and Ca3PO4
halite phase consisting of four components: MgO–FeO–MnO–CaO
spinel phase consisting of five components: MgO–FeO–MnO–CaO–Al2O3.
For IMPHOS heats: S1835, S1845 and S1841, Figs. 18–20 show the changes in total slag weight through the blow together with the thermodynamic calculations for the change in weight of the component slag species: amorphous liquid slag; C2S; spinel; and halite.
Heat S1835: slag phase weight changes
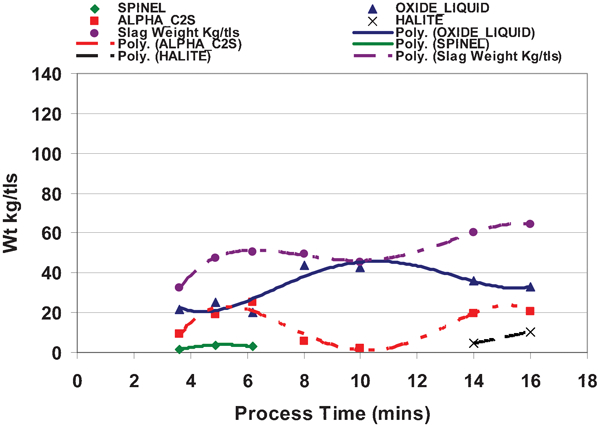
Heat S1845: slag phase weight changes
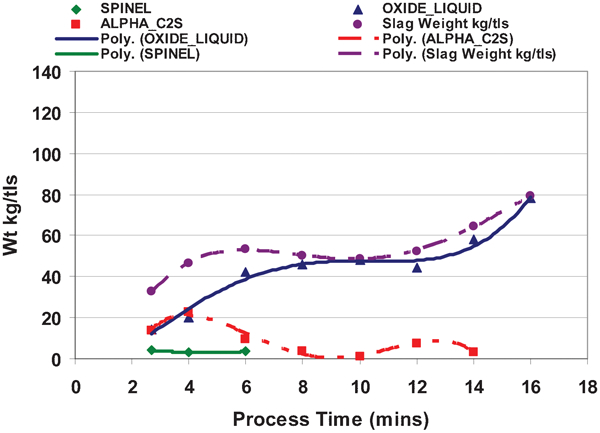
Heat S1841: slag phase weight changes
Figure 18 shows the thermodynamically stable slag phase profiles for heat S1835. At ∼5 min into the blow, the weight of C2S and amorphous liquid slag phases are similar while a small amount of spinel phase appears as a stable phase between ∼4 and ∼6 min into the blow. As the blow progresses, the amorphous liquid slag phase continues to increase to a maximum weight at ∼10 min into the blow while the weight of the C2S phase decreases to almost zero at ∼11 min into the blow. The slag is made-up almost entirely of amorphous liquid slag phase at this point. Further on, the amorphous liquid slag phase steadily decreases while the C2S phase steadily increases and at blow end, the amorphous liquid slag phase is ∼50% of the total slag weight and the C2S phase is ∼33% of the total slag weight. At this time the halite phase is thermodynamically stable and makes up ∼16% of the total slag weight.
Figure 19 shows the thermodynamically stable slag phase profiles for heat S1845. The slag phase profiles for this heat appear quite similar to those for heat S1835 for the first half of the blow except that the weight of the C2S phase fails to increase significantly after the ∼10 min minimum, and from ∼14 min into the blow it has completely disappeared. For this heat, the small amount of halite phase also fails to appear as thermodynamically stable during the last few minutes of the blow. At end-of-blow, the slag is exclusively an amorphous liquid.
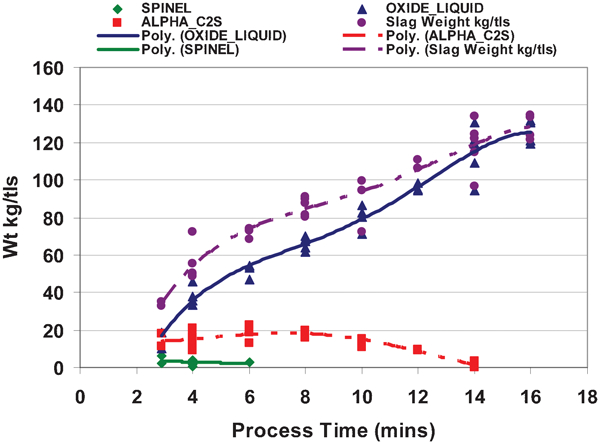
Figure 20 shows the thermodynamically stable slag phase profiles for heat S1841. At ∼3 min into the blow, the weight of C2S and amorphous liquid slag phases are similar while a small amount of spinel phase appears as thermodynamically stable between ∼3 and ∼6 min into the blow. As the blow progresses, the amorphous liquid slag phase continues to increase steadily to end-of-blow, while the C2S phase plateau’s out until ∼8 min into the blow and then, steadily decreases until at ∼14 min into the blow it has disappeared completely and at blow end, the slag consists entirely of amorphous liquid. It should be noted that the total slag weight profile for this heat is significantly higher than those for the other two heats and the total slag weight at blow end is almost double that of the other two heats. Therefore, it might be expected that phosphorus capacity through the blow will also be significantly higher, particularly during the first 6 min to 8 min of the blow when the weight of the C2S phase is maximum.
MTDATA has been further applied to IMPHOS heats: S1835, S1845 and S1841, to calculate the change in weight of phosphorus in each of the thermodynamically stable slag phases through the blow. It should be noted that only the C2S and amorphous liquid slag phases are able to take up phosphorus. For each of the heats, Figs. 21–23 show the change in weight of phosphorus in C2S; the change in weight of phosphorus in the amorphous liquid slag phase; and the total change in weight of phosphorus in the slag through the blow.
Heat S1835: weight of phosphorus in each slag phase
Heat S1845: weight of phosphorus in each slag phase
Heat S1841: weight of phosphorus in each slag phase
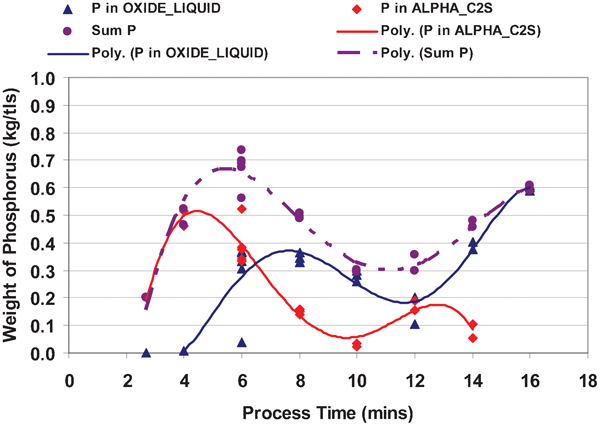
For heat S1835, Fig. 21 shows that for the first ∼4·5 min into the blow, almost all the phosphorus in the slag is contained in the C2S phase. At ∼10·5 min into the blow, the amount of phosphorus in the C2S drops to a minimum while the weight of phosphorus in the amorphous liquid phase reaches a maximum. The total phosphorus in the slag reaches a minimum at ∼11 min into the blow. As the blow progresses to blow-end, phosphorus is again transferred to the C2S while the amount of phosphorus in the amorphous liquid phase is depleted. At end-of-blow, over 83% of phosphorus in the slag is contained in the C2S phase even though it makes up only ∼33% of the total slag weight (Fig. 18).
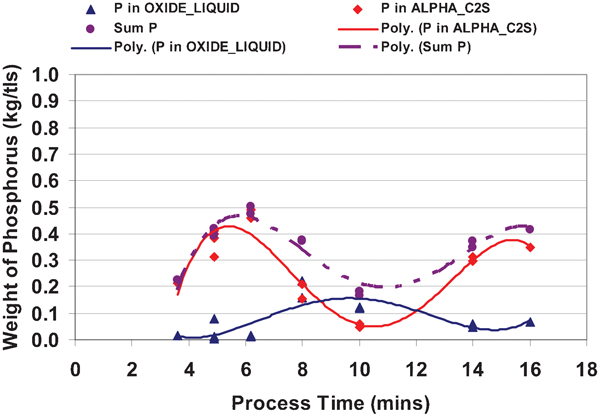
For heat S1845, Fig. 22 shows that for the first 4 min into the blow, almost all the phosphorus in the slag is contained in the C2S phase. There is rapid depletion of phosphorus in C2S until it reaches a minimum at ∼10 min into the blow while during this time, phosphorus rapidly increases in the amorphous liquid phase where it peaks at ∼8 min into the blow. The maximum weight of phosphorus in the slag occurs at ∼6 min into the blow. As the blow continues, the phosphorus in the amorphous liquid phase reduces and reaches a minimum at ∼12 min into the blow while phosphorus in the C2S phase increases to a peak at ∼13 min into the blow and then drops off again. At end-of-blow, all the phosphorus in the slag is in the amorphous liquid phase.
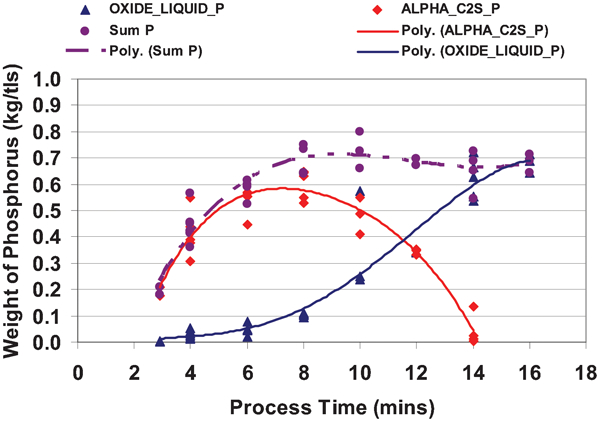
For heat S1841, Fig. 23 shows that for the first 4 min into the blow, almost all the phosphorus in the slag is contained in the C2S phase. As the blow progresses, phosphorus continues to build-up in both the C2S and the amorphous liquid phase and at ∼7 min into the blow, phosphorus in the C2S phase reaches a maximum and then continuously reduces to zero at ∼14 min into the blow when the C2S phase is no longer thermodynamically stable (Fig. 20). During this time, phosphorus in the amorphous liquid phase continues to increase until end-of-blow. At end-of-blow, all the phosphorus in the slag is in the amorphous liquid phase. Maximum phosphorus weight in the slag is at ∼8 min into the blow from which time it remains approximately constant until end-of-blow. It should be noted that for heat S1841, from 8 min into the blow the total weight of phosphorus in the slag is always higher than for the other two heats although at blow end, the weight of phosphorus in the slag for heat S1845 approaches that of S1841.
It is useful to compare the outcome of phosphorus distribution between thermodynamically stable phases in the slag with the phosphorus removal profiles in the metal component of the emulsion and the bulk metal bath. It is seen that maximum weight of phosphorus in the slag (Figs. 21–23) corresponds with minimum phosphorus in the metal component of the emulsion and bulk metal bath (Figs. 7–9) and minimum weight of phosphorus in the slag corresponds with maximum phosphorus in the metal component of the emulsion and bulk metal bath. The extent of thermodynamically stable phases in the slag that are able to take up phosphorus and the manner in which phosphorus is able to distribute between these thermodynamically stable phases appears to be fundamental to the way in which phosphorus transfers between the slag and the metal component of the emulsion. For heat S1845, Fig. 24 is a phosphorus balance over the blowing period and gives the changes in phosphorus weight distribution between the slag, the metal component of the emulsion and the liquid portion of the bulk metal bath. Figure 24 shows also the summated change in total phosphorus weight during the blow. This has a mean phosphorus weight of 3·987 kg with a standard deviation around the mean of 0·189 kg, which is very low and indicates a good phosphorus balance. It should be noted that the weight of phosphorus in the liquid portion of the bulk metal bath is approximately constant between ∼8 and ∼13 min, indicating that at any time over this period, the weight of phosphorus leaving the bulk metal bath is approximately equal to the weight of phosphorus returning to the bulk metal bath.
Heat S1845: change in phosphorus weight distribution between slag, metal component of emulsion and liquid portion of bulk metal bath
Scrap melting
The phosphorus balance described above (see Appendix) determines the change in weight of the liquid portion of the bulk metal bath over the blowing period which, in turn, can be used to derive the scrap melting profile. For heat S1845, Fig. 25 shows the change in weight of the solid portion of the bulk metal bath which consists of the scrap charge plus skull that has solidified onto the scrap pile during the initial stages of converter operation. It is seen that the skull component continues to increase for the first ∼5 min into the blow after which, it starts to melt back.
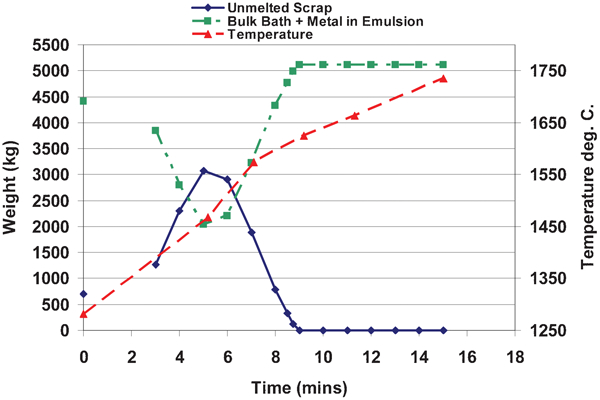
Heat S1845: scrap melting profile; change in weight of liquid portion of bulk metal bath plus metal in emulsion; bulk bath temperature
At just under ∼9 min into the blow, when the temperature of the bulk bath is ∼1610°C, all the skull and scrap has completely melted. At its peak at ∼5 min into the blow and when the bulk bath temperature is ∼1460°C, the solid scrap and skull component makes up just over 60% of all the metal charged to the converter. The converse of this is that, at this time, the liquid portion of the bulk metal bath plus the metal in the emulsion makes up less than ∼40% of all the metal charged to the converter.
Slag characteristics
RC Urquhart and WG Davenport18 defined a foam as an expanded gas–liquid emulsion, and an emulsion as a heterogeneous system consisting of two intimately dispersed immiscible liquids. Figures 26–28 show examples of slag/metal emulsion sampled from one IMPHOS heat (S1840) at level 6 (Fig. 1), and at 6, 10 and 14 min into the blow.
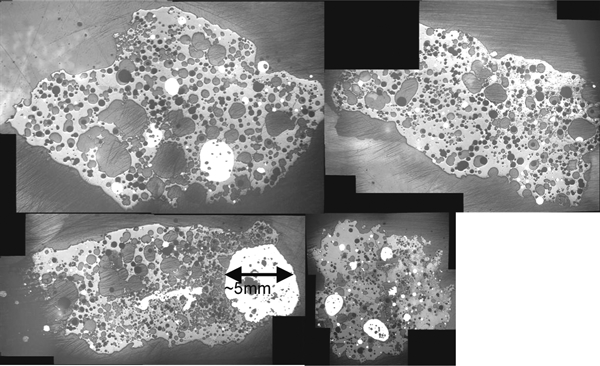
Unstable foamy emulsion: 6 min - Level 6; total occluded area = 512×106 μm2
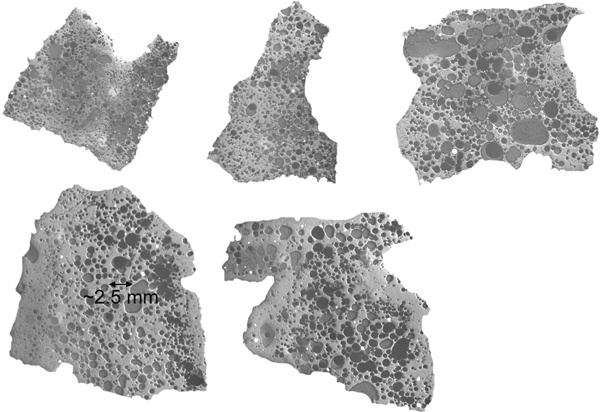
Stable foamy emulsion: 10 min Level 6; total occluded area = 466×106 μm2
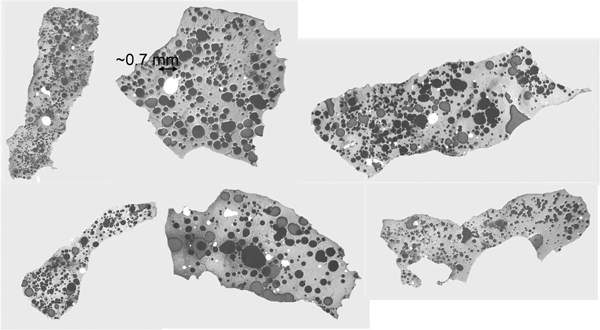
Collapsed foam: slag/ metal emulsion, 14 min - Level 6; total occluded area = 392×106 μm2
It is observed that the stability of the foamy slag/metal emulsion over the blowing period goes from unstable–(highly non-uniform bubble size distribution) to stable (uniform bubble size distribution) to collapse (continuous emulsion phase).
For the same heat (S1840), Fig. 29 compares slag height and FeO(tot)wt-% plotted against temperature and with the sampling times highlighted. It is seen that slag height increases with increase in FeO(tot)wt-% up to a maximum of ∼42%FeO(tot)wt-% (ignoring the slopping period), before decreasing with a decrease in decarburisation rate and the collapse of the foamy slag.
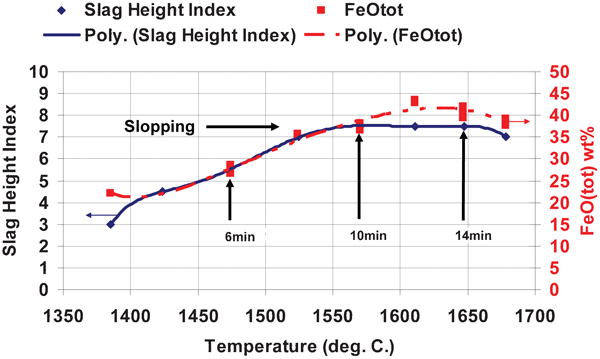
Heat S1840: foamy slag height and FeO(tot)wt-%
Conclusions
With emulsion boundary limits defined between Level 4 and Level 7 and the assumption that all decarburisation takes place in the slag/metal emulsion then maximum metal residence time in the emulsion is just under 9 s. The maximum amount of metal in the emulsion, which occurs at peak decarburisation rate, is approximately half the total amount of metal in the converter. The amount of metal in the emulsion is low at the beginning and at the end of a blow.
At a fixed oxygen lance height, the distance between the lance tip and the metal bath ‘surface’ will vary significantly because of the changing amount of metal that is transferred between the bulk metal bath and the emulsion throughout the blow. Successful evaluation of the effect of changes in slag component chemistry on phosphorus refining should account for changes in slag weight, which can vary substantially throughout a heat and be significantly different heat-to-heat. The appearance of thermodynamically stable slag phases through the blow and their ability to take-up phosphorus is a key factor in the control of phosphorus transfer between the slag, the metal component of the emulsion and the bulk metal bath. While application of proprietary thermodynamic models such as MTDATA and FACTSage can help to clarify such events, they should be used with care to ensure reliable results. Skull build-up on the scrap pile is at a maximum at ∼5 min into the blow when the bulk bath temperature is ∼1460°C. At this time, the solid scrap and skull component of the bulk bath makes-up just over 60% of all the metal charged to the converter. All scrap and skull is melted-out at a bulk bath temperature of ∼1610°C, at just under ∼9 min into the blow. The stability of the foamy slag/metal emulsion over the blowing period goes from: unstable to stable to collapse. Slag height increases with increase in FeO(tot)wt-% before decreasing with decrease in decarburisation rate and the collapse of the foamy slag.
Footnotes
Acknowledgements
This paper is a revised and extended version of a presentation made at the International Symposium of NMD-ATM 2012, Jamshedpur, India, which will be published in a Special Issue of Transactions of the Indian Institute of Metals.
The authors wish to acknowledge the helpful discussions on decarburisation with Professor Ken Coley at McMaster University.
The authors also wish to acknowledge that this work was carried out with a financial grant from the Research Fund for Coal and Steel of the European Community.