
Abstract
The corrosion of MgO–C refractories during decarburisation of liquid ferromanganese alloys was investigated using the finger rotating test. An oxide layer containing MnO is formed on the surface of the MgO–C refractories in contact with molten low carbon ferromanganese alloys (Fe–75Mn–0·8C) but is not formed when the refractories are in contact with high carbon ferromanganese alloys (Fe–75Mn–7C). The thickness of the oxide layer decreases with increasing carbon content in the ferromanganese alloy and increases with immersion time. We conclude that the formation of the oxide layer strongly depends on the driving force, which is the difference in carbon content between MgO–C refractories and molten ferromanganese alloys.
Introduction
Recently, there has been a trend towards increased demand of high strength steel such as twinning induced plasticity steel, which is high in manganese. Ferromanganese alloys are manufactured using a submerged arc furnace in a reducing atmosphere and contain ∼7% carbon. If high carbon ferromanganese alloys are directly used in the steelmaking process, the production of high manganese steel associates with simultaneous increase in carbon content; thus, extensive refining is required in the following primary steelmaking. Therefore, it is more efficient to use low carbon ferromanganese alloys instead. By refining with oxygen, the high carbon ferromanganese alloys can be turned into low carbon ferromanganese with carbon content of ≤1·5%. 1–4
MgO–C refractory is used in such a decarburisation process. MgO has high melting point and high refractoriness, and carbon has high thermal conductivity, low thermal expansion and low wettability of slag. When these two are combined, excellent resistance against thermal shock and corrosion is obtained. 5,6 Contact with the molten slag, however, does cause the corrosion of refractory and has to be replaced after tens of heating cycles. Recently, a paper on the corrosion mechanisms of the MgO–C refractory due to ferromanganese slag has been published. 7 The main factors are the MnO content of the slag and the diffusion rate of the MgO into the slag, which is the dominant and rate limiting step in the corrosion.
However, the effect of ferromanganese alloys on the corrosion behaviour of the MgO–C refractories in the decarburisation process has not been found in open literature so far.
In this study, the corrosion behaviour between the MgO–C refractories and ferromanganese alloys was investigated during decarburisation conditions. A finger rotating test was introduced to observe the corrosion behaviour of the MgO–C refractories. The effect of the carbon content in ferromanganese alloys on the corrosion behaviour is presented.
Experimental
Materials preparation
The MgO–C refractories were cut from commercial refractory brick and processed to cylindrical specimens of 50 mm in height and 20 mm in diameter. The chemical composition for these MgO–C refractories is 80·18MgO–0·26SiO2–0·02Fe2O3–0·54CaO–19C (mass-%).
The ferromanganese alloys were from those used in actual operation. The chemical compositions are specified in Table 1.
Chemical compositions of Fe–75Mn–C alloy/mass-%
Finger rotation test
Figure 1 illustrates the experimental apparatus used to study the corrosion behaviour of MgO–C refractory in the molten ferromanganese alloy system.
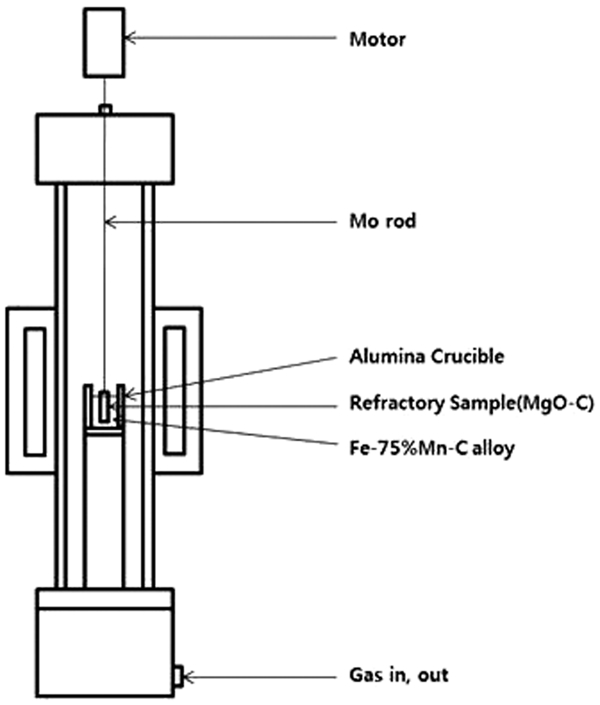
Experimental apparatus
Ferromanganese alloy of 300 g was placed in an alumina crucible (diameter, 50 mm; height, 150 mm) and heated in a high temperature vertical tube furnace under an Ar atmosphere. The refractory specimen was glued to a 6 mm diameter Mo rod using ceramic adhesive. When the temperature reached a desired value, about two-thirds of the specimen was immersed into the molten ferromanganese and rotated for a determined time. The experimental conditions are summarised in Table 2.
Test parameters
The change in the appearance of the MgO–C refractory specimen that reacted with Fe–75Mn–C alloy at 1600°C for 300 min is shown in Fig. 2. The changes in appearance and weight were not significant. Horizontal cross-section of reacted MgO–C refractory cut at 1 cm from the bottom was observed using an optical microscope.
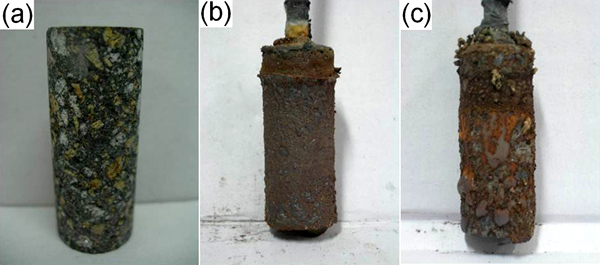
Surface of MgO–C refractory specimen
Oxide layer thickness analysis
X-ray computed tomography (CT) scanning analysis was used to obtain the accurate thickness of the oxide layer. The horizontal cross-section of MgO–C refractory that reacted with Fe–75Mn–C alloy cut at 1 cm from the bottom was observed using an X-ray CT. The specimen is scanned by an X-ray CT (X-EYE CT System, SEC Corporation). There have been few studies that employed X-ray CT for characterising the properties of refractories for steelmaking industry. The X-ray CT used in this study has a capability of attaining high spatial resolution up to 0·005 mm. A pixel has 0·0108×0·01078 mm in size, and each two-dimensional image contains 1024×1024 pixels. Total 1024 images are taken every 0·00868 mm in spacing. This provides a non-destructive approach to achieve consecutive sectional images of internal structure of three-dimensional (3D) specimen. The thickness of the oxide layer was obtained from the 3D reconstructed images of X-ray CT scanning. X-ray CT scanning analysis can provide more effective and reliable way to quantify oxide thickness.
Chemical composition analysis
The oxide layer formed at the surface of the reacted refractory was identified by X-ray diffraction (XRD) analysis, and the reaction product on the surface was analysed using energy dispersive spectroscopy.
Results and discussion
Dependence on carbon content in Fe–75Mn–C alloy
The corrosion behaviour with changes of carbon content in FeMn was performed by finger rotating test. Figure 3 shows a plot of thickness of oxide layer as a function of carbon content of FeMn obtained by the analysis using an X-ray CT.
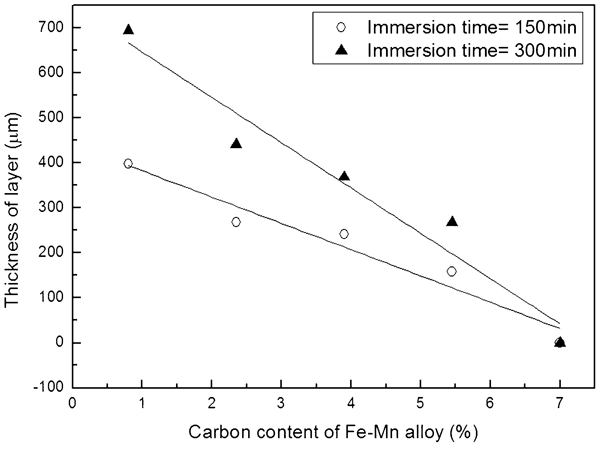
Plot of thickness of oxide layer as function of carbon content of Fe–75Mn–C alloy at 1600°C
It can be seen that the thickness of oxide layer decreased with increasing carbon content in the FeMn and decreasing immersion time. This implies that the dissolution of carbon of the MgO–C refractory starts first by contacting the molten FeMn with lower carbon content, and then the molten FeMn was penetrated into dissolved area. Therefore, there is formation of oxide layer on the surface of the MgO–C refractory.
Figure 4 shows the reaction area of refractory specimen that reacted to FeMn–0·8C alloy at 1600°C for 300 min (Fig. 4a ), FeMn–2·4C alloy at 1600°C for 300 min (Fig. 4b ) and FeMn–7C alloy at 1600°C for 300 min (Fig. 4c ). It can be seen that the oxide layer was formed on the surface of the reacted MgO–C refractory with 0·8%C and 2·4%C alloy (Fig. 4a and b ). However, the oxide layer formed by the 7%C alloy (Fig. 4c ) was small compared with the one formed by the other two.
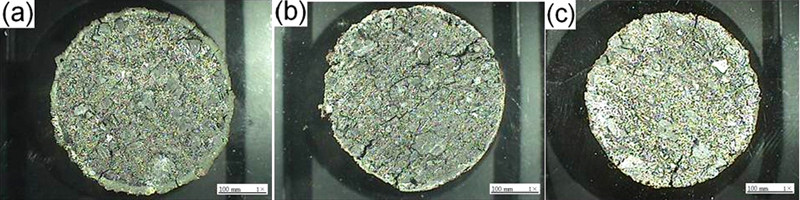
Images showing reaction area of MgO–C refractory specimen reacted to a Fe–75Mn–0·8C alloy at 1600°C for 300 min, b Fe–75Mn–2·4C alloy at 1600°C for 300 min and c Fe–75Mn–7C alloy at 1600°C for 300 min
Figure 5 shows X-ray images of the reaction of area of MgO–C refractory that reacted with 0·8%C alloy at 1600°C for 300 min (Fig. 5a ), 2·4%C alloy at 1600°C for 300 min (Fig. 5b ) and 7%C alloy at 1600°C for 300 min (Fig. 5c ). As the oxide layer is not uniformly formed on the surface of the refractory that reacted with −0·8%C alloy and 2·4%C alloy, the determination of thickness of reacted oxide layer using X-ray CT is a very useful way to diminish the representative problem that might be inevitable when only one cross-sectional image analysis is performed. X-ray CT analysis considers oxide layer as 3D annulus in shape. It examines whole volume of interest of the reacted MgO–C refractory specimens. As shown in Fig. 5, the oxide layer of the reacted refractory specimens manifests as it has different intensity CT value compared to the inner section (i.e. non-reacted oxide). The oxide layer having higher CT value means that it has changed into another material with higher density after reaction. Thus, the representative thickness of the oxide layer of the reacted refractory specimens is determined by averaging the total of measured thickness values from all the slice images that the X-ray CT scanner produced. Figure 6 shows the process of determining the thickness of the outer oxide layer from the X-ray CT images. The thickness is calculated by the linear inspection of CT intensity as shown in Fig. 6b .
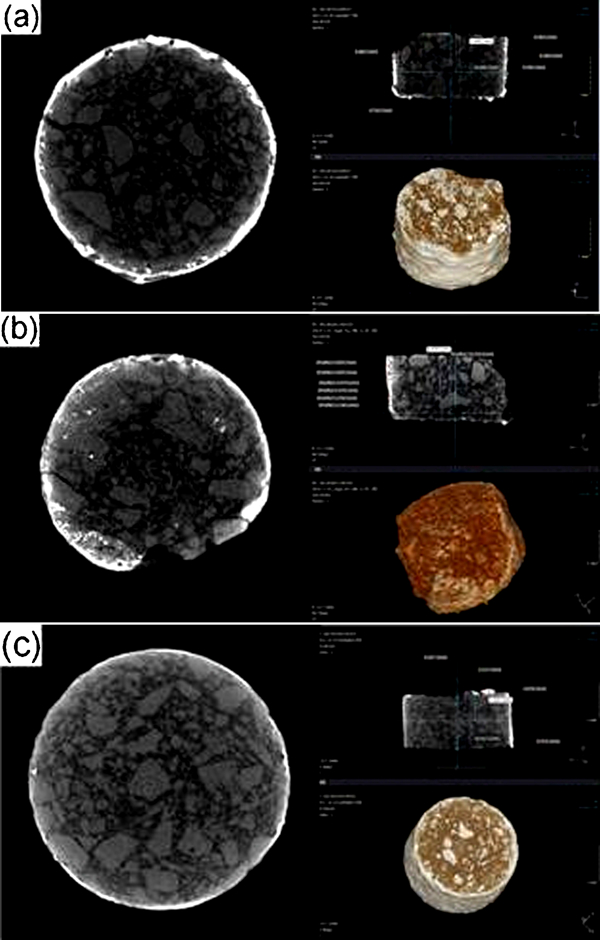
X-ray CT images showing reaction area of MgO–C refractory specimen
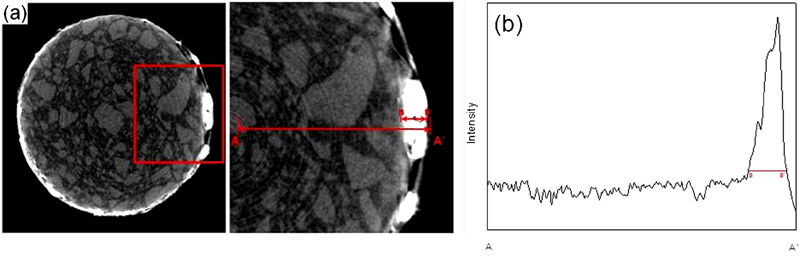
Determination of outer oxide thickness from X-ray CT image
Analysis of oxide layer formed at surface of reacted MgO–C refractory with Fe–75Mn–C
Figure 7 shows the chemical composition of the oxide layer of the refractory specimen that reacted to −0·8%C alloy at 1600°C. Energy dispersive spectroscopy analyses of the oxide layer (Fig. 7) reveal that the Mg content increases as the Mn level decreases as it gets closer to the MgO–C refractory surface (along the paths 

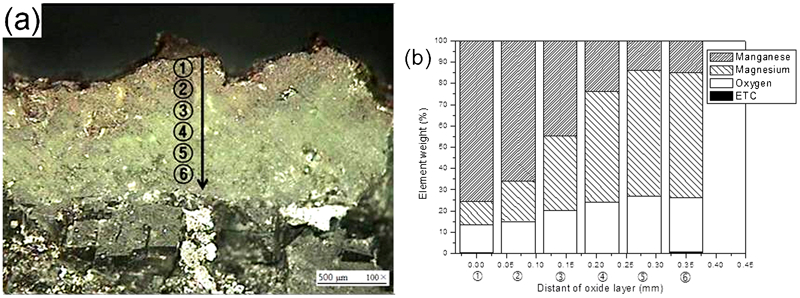
Energy dispersive spectroscopy analyses of oxide layer (Mg,Mn)O solid solution
The XRD analysis of the oxide of the MgO–C refractory that reacted to FeMn is presented in Fig. 8.
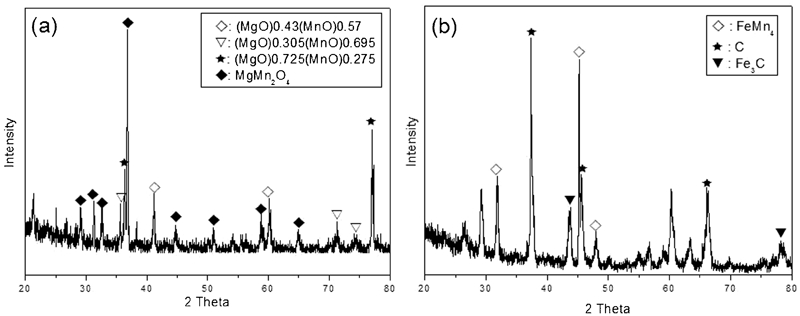
X-ray patterns of MgO–C refractory specimen
According to this XRD analysis, the oxide of the surface of the refractory that reacted with 0·8%C alloy was found to be MgMn2O4 and (Mg,Mn)O solid solution (Fig. 8a ), and the phases of the surface of the refractory that reacted with 7%C alloy were found to be FeMn4, Fe3C and C (Fig. 8b ). This indicates that no oxide formed at the surface of the refractory and alloys were formed due to physical adsorption.
Mechanism of oxide layer formation
The formation mechanism of the oxide layer observed at the surface is discussed. At first, dissolution of C into the molten Fe–Mn–C alloy is in accordance to the following reaction in the initial state of Fig. 9a

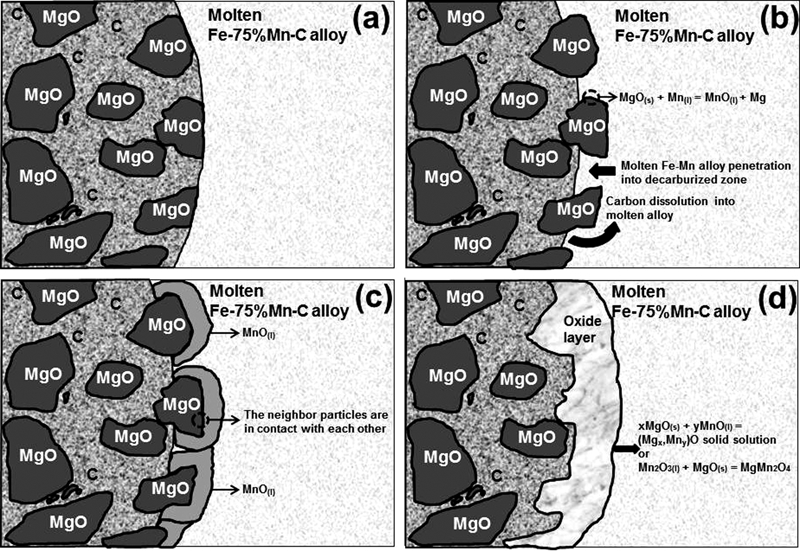
Schematic of oxide layer formation mechanism of reacted MgO–C refractory to Fe–75Mn–C alloy with lower carbon content
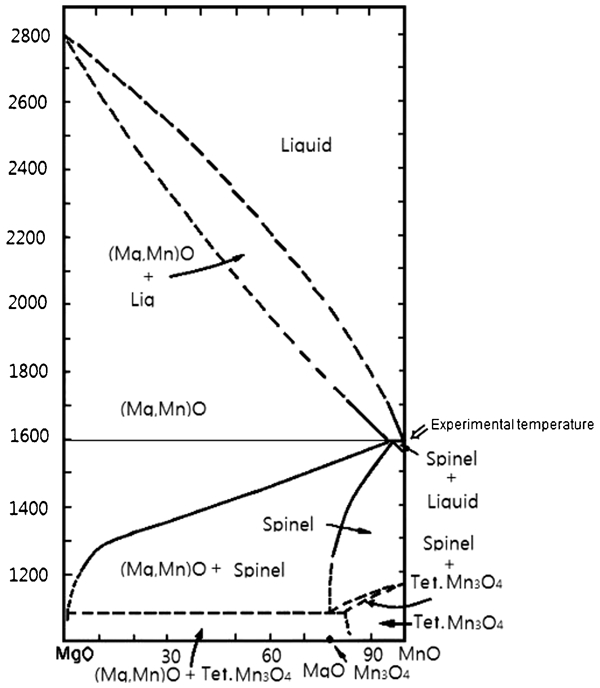
System MgO–MnO in air (probable phase relations >1000°C)
Thus, the following reaction can take place


In addition, the MnO phases that partially molten at the surface may soften the particles to deform their shape. At some moment, the neighbour particles are in contact with each other as shown in Fig. 9c . Finally, every particle gets connected to produce the oxide layer with ring morphology as shown in Figs. 4a and 5a . With the above reactions and diffusion of MnO and MgO, the inner front of the oxide layer meets the other green MgO particles. As a result, this layer grows as depicted in Fig. 9d . The reacted product is considered to consist mainly of (Mgx, Mny)O solid solution and the liquid MnO phases at the surface.
The specimen was cooled after removal from the furnace. During cooling in air, the solid solution of (Mgx, Mny)O should be separated to the two phases (Mgx, Mny)O and MgO.Mn2O3 spinel, referring to the phase diagram (Fig. 10). This is consistent with the XRD pattern shown in Fig. 8.
Figure 11 is a schematic showing the dependence of the formation of the oxide layer on the carbon content in FeMn based on the experimental results. The horizontal axis represents the spatial dimension from the refractory toward the molten alloy, and the vertical axis represents the carbon contents in the refractory and the molten FeMn. The difference in the carbon content between the refractory and the molten FeMn serves as the driving force for the carbon dissolution from the refractory into the molten FeMn. The thickness of the oxide layer increases with increasing carbon dissolution, indicating that the thickness of oxide layer strongly depends on the difference in the carbon content between the refractory and the molten FeMn.
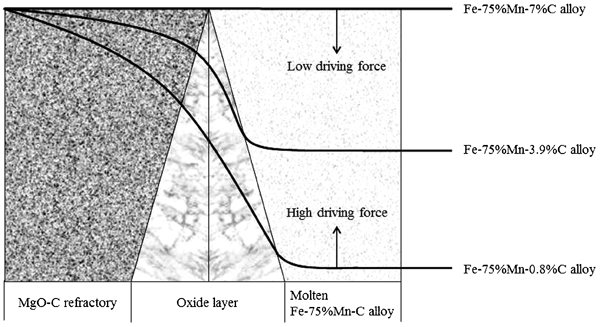
Schematic of driving force of carbon between MgO–C refractory and molten Fe–75Mn–C alloy
Conclusions
An oxide layer containing MnO is formed on the surface of MgO–C refractories in contact with molten low carbon ferromanganese alloy (Fe–75Mn–0·8C) but not formed with high carbon ferromanganese alloy (Fe–75Mn–7C).
The thickness of the oxide layer decreases with increasing carbon content in the Fe–75Mn–C alloy and increases with immersion time.
The oxide was found to be MgMn2O4 or (Mg,Mn)O solid solution by XRD analysis.
The large difference in carbon content between MgO–C refractories and molten ferromanganese alloys enhances the formation of the oxide layer, which is the major cause of the corrosion. This suggests that reducing the carbon content in MgO–C refractory would help in improving the life of the refractory in contact with low carbon ferromanganese alloys.
Footnotes
Acknowledgements
This work was supported by the Industrial Strategy Technology Development (grant no. 10033389, Development of e-FERA Technology) through a grant provided by the Ministry of Knowledge Economy.