
Abstract
Conventional tests of sinter strength such as the Tumbler test and the shatter test cannot predict the effect of transport parameters such as the drop height, conveying length, etc. on the amount of return fines generated during transport. In this work, various steps involved in transportation were simulated using customised drop and vibration tests, and the effect of sinter size, drop height and conveying time on the percentage of return fines and volume breakage was examined. Drop and vibration tests revealed that the extent of volume breakage is higher in case of larger sinter particles, but the percentage of return fines from various size fractions did not follow the corresponding trend in volume breakage. The contribution of various size fractions of sinter to generation of return fines was found to be in the order: 5–10 mm>20–30 mm∼30–40 mm>10–20 mm. For any size fraction, the percentage of fines generated was found to be linearly related to the drop height in the case of drop tests and logarithmically related to the vibration time in the case of vibration tests.
Introduction
Mechanised mining of iron ore generates a large percentage of fines (<10 mm in size) that cannot be directly charged into the blast furnace as they adversely affect the permeability of the bed and productivity of the furnace. Therefore, ore fines are typically agglomerated to form bigger particles before being charged into the furnace. Sintering is one of the most commonly used agglomeration processes in which a mixture of ore fines, fluxes and revert materials are agglomerated by partial melting and re-solidification of the particles to form ‘sinter’, a heterogeneous, porous, hard and reducible lump. Solid fuel (typically coke breeze) is used to generate the heat required for melting of the particles.
The result of sintering is a sinter cake that is crushed and screened to obtain ‘product sinter’ in the size range 5–40 mm that can be used in the blast furnace. However, due to its brittle nature, product sinter undergoes size degradation as it is transported to the blast furnace and generates fines that are less than 5 mm in size. These are screened out at the end of the transportation circuit and are recycled to the sinter plant as ‘sinter return fines’ shown in Fig. 1. Typically 15–25% return fines are generated during transportation. Return fines represent a loss of useful sinter that could have been used in the blast furnace. Hence there is a need to minimise generation of return fines by identifying the underlying factors and addressing them appropriately.
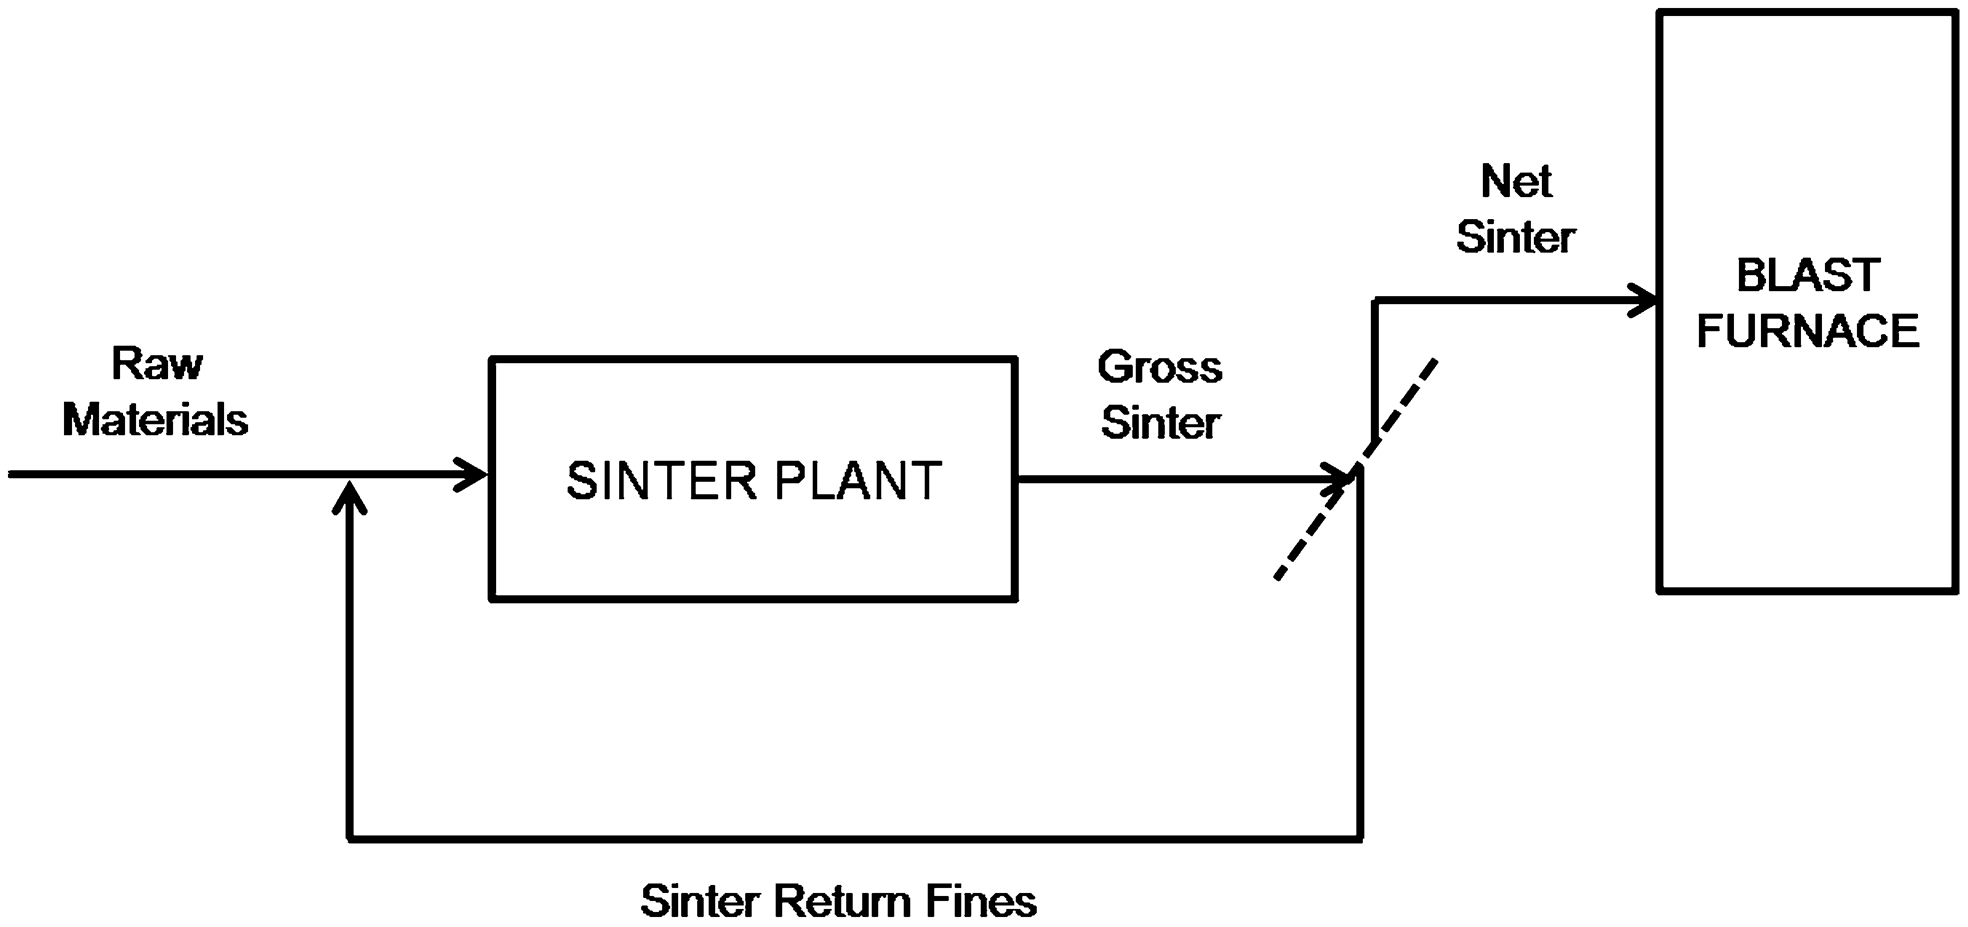
Schematic showing flow of material around sinter plant
The cold strength of sinter is measured using standard tests such as the Tumbler test 1 and the shatter test. 2 While these tests provide a useful indication of sinter strength, they cannot provide information on the amount of return fines that would be generated in a certain transport circuit. Apart from the cold strength of sinter, parameters specific to a transport circuit such as the length of conveyors, the height of drop between conveyors and the number of drops determine the percentage of return fines generated. The effect of these parameters cannot be captured through standard tests of cold strength and needs to be investigated using customised tests.
The literature available on degradation of sinter during transportation is limited. The most comprehensive work on the subject is probably that of Teo et al. 3 In this work, the authors quantified the effect of particle size, drop height and number of drops on degradation of lumpy materials such as iron ore sinter, coal, coke and iron ore. Theories of breakage were also used to explain experimental observations of degradation. Delebarre et al. 4 used the Epstein theory to predict the size distribution of sinter and coke after a certain number of drops. Both these works, however, did not report the effect of various parameters on generation of sinter return fines and it is the objective of the present work to address this.
The objective of this work was to simulate the steps involved in transportation of sinter, i.e. conveying and drops, and to investigate the effect of sinter size, drop height and conveying time on generation of return fines (<5 mm). Details of the experimental setup used to simulate sinter degradation, the design of experiments and the results are presented in the sections that follow.
Experimental
Three types of experiments, namely, Tumbler tests, Drop tests and Vibration tests were conducted on different size fractions of sinter to investigate their breakage behaviour. Tumbler tests were conducted as per ISO 3271/75 to estimate the cold strength of sinter and to provide a basis for comparison against drop tests and vibration tests. The size of sinter was varied in the Tumbler tests as shown in Table 1. After each test, sinter was screened into various size fractions and the weight percent of each size fraction was determined.
Plan of experiments for Tumbler tests
Drop tests were conducted to simulate the drop of sinter from one conveyor onto another during transportation from the sinter plant to the blast furnace. In the drop tests, 20 kg of sinter of a particular size fraction was taken in a steel box of dimensions 500×850×500 mm with flaps on the bottom surface and dropped from a predetermined height onto an impact surface by opening the flaps. The drop box setup used for drop tests is shown in Fig. 2. The size of sinter, the height of drop and the impact surface were varied at the levels shown in Table 2. A ‘full factorial design’, i.e. all possible combinations of the levels across the variables were employed in the drop tests. Two different impact surfaces, namely a mild steel plate and a rubber mat were used. The steel plate was 5 mm thick and represented a ‘hard surface’. On the other hand, the rubber mat made of the material typically used in conveyors represented a ‘soft surface’. After each test, sinter was screened into various size fractions and the weight percent of each size fraction was determined.
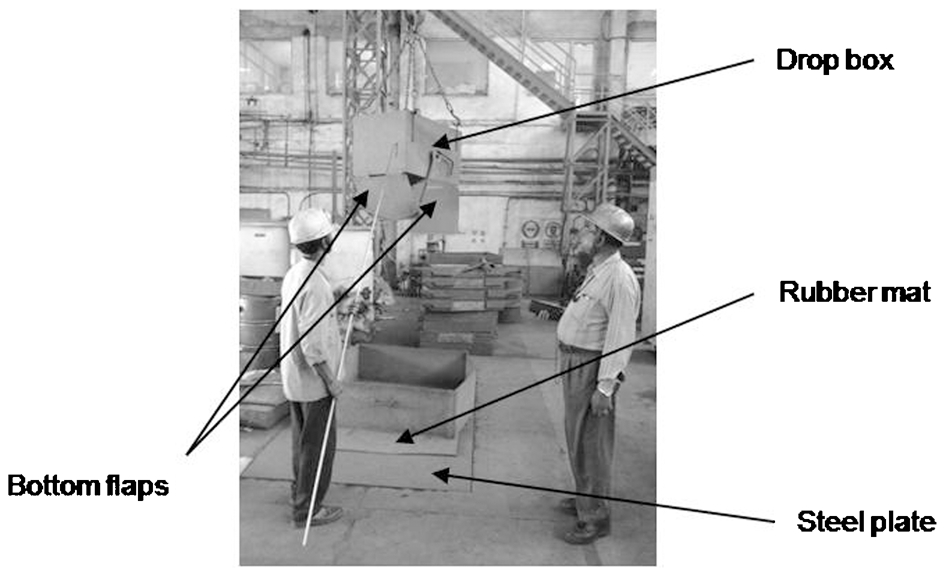
Setup used for drop tests
Plan of experiments for drop tests
It is known that sinter is subjected to a continuous vibration action when it is transported on conveyor belts that move on idlers. To determine the effect of conveying action on sinter degradation, vibration tests were conducted. In the absence of long conveyor belt systems, these tests were conducted in using a laboratory vibrating screen (shown in Fig. 3) having the following specifications: maximum batch weight of 10 kg, equipped with a 2 HP motor (operating at 1440 rev min−1 and 50 Hz). In the vibration tests, 10 kg of sinter of a particular size fraction was placed on a rubber mat which was placed in the receiving tray (without any apertures) of the vibrating screen. The tray was placed rigidly on the top most deck and the vibrating screen was operated for a fixed amount of time. The time of vibration was seen to be equivalent to the time spent by sinter on a moving conveyor. The size of sinter and the time of vibration were varied in the vibration tests as per the plan shown in Table 3. A full factorial design was employed here as well. After each test, sinter was screened into various size fractions and the weight percentage of each size fraction was determined.
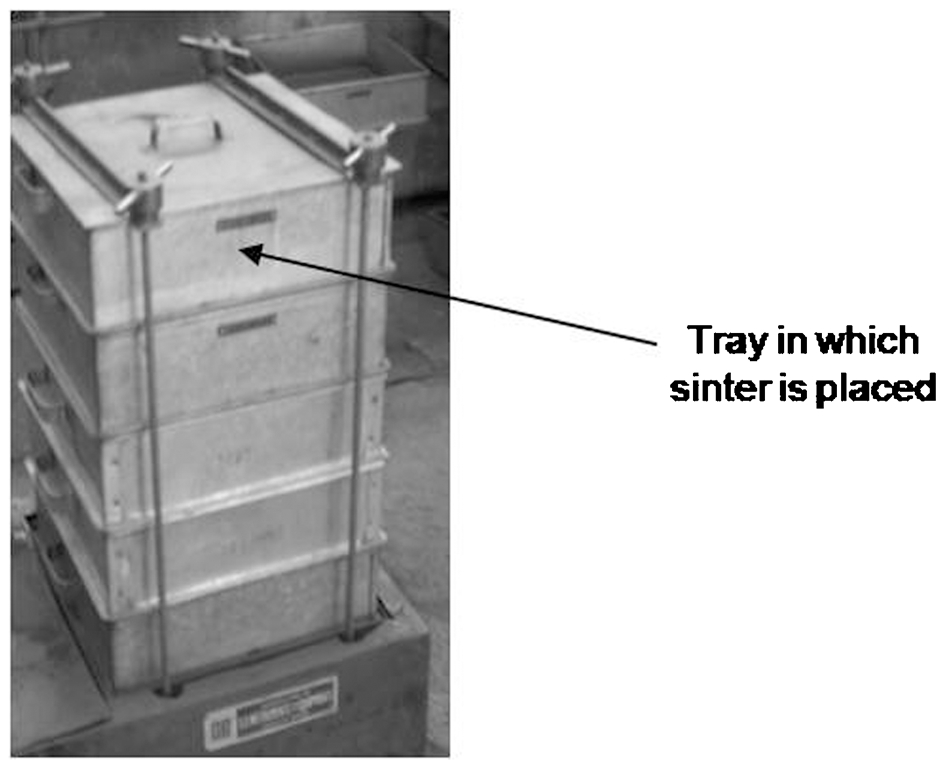
Vibrating screen used for vibration tests
Plan of experiments for vibration tests
In all the experiments, apart from the percentage of return fines generated, the volume breakage index was also calculated. The volume breakage index, proposed by Teo et al.,
3
is an indication of volume breakage in a material and is obtained by treating volume breakage as a first order process, i.e. the mass broken is proportional to the mass used in the test. The volume breakage index is defined as the fraction of material not present in the original size fraction after any test
The volume breakage index varies between 0 and 1, with a value of zero indicating that the material is very strong and did not disintegrate at all while a value of 1 indicates that the material has lower bulk strength and no amount of material is left in the original size fraction.
All the experiments were conducted using product sinter collected from Sinter Plant no. 3 of the Jamshedpur Works of Tata Steel. The cold strength parameters of collected sinter were: Tumbler Index – 73·9 and Abrasion Index – 6·3. The chemistry of collected sinter was: Fe(total) – 56·9%, FeO – 10%, CaO – 9·6%, MgO – 1·8%, SiO2 – 4·3% and Al2O3 – 2·3%.
Results and discussion
Tumbler tests
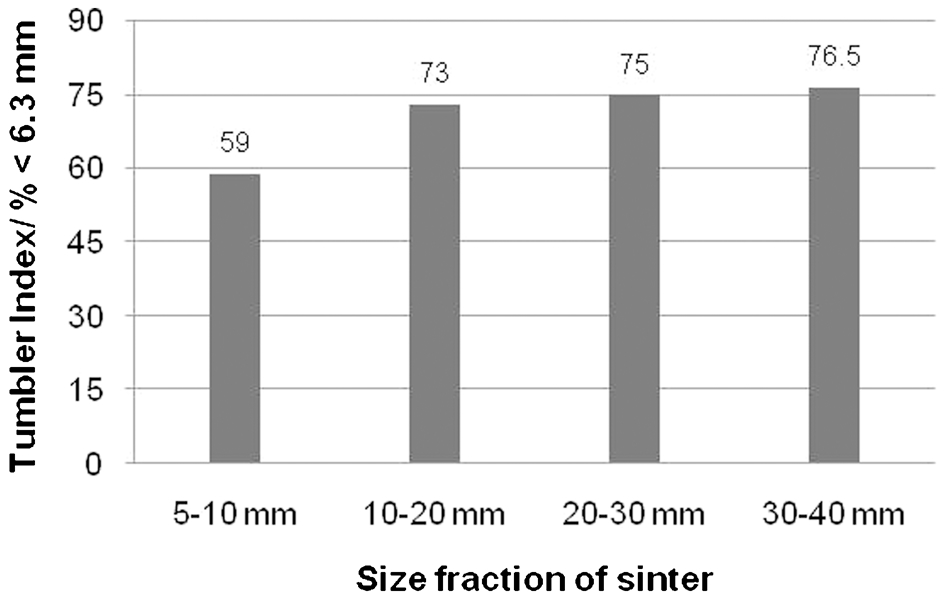
The Tumbler Index of various size fractions of sinter obtained from the ISO Tumbler test is shown in Fig. 4. Here it should be noted that the 5–10 mm fraction already contained some percentage of <6·3 mm sinter because of which the Tumbler Index which is the percentage of sinter >6·3 mm for this size fraction is lower. For the other three size fractions, it can be seen that the Tumbler Index increased slightly from 73% for 10–20 mm sinter to 76·5% for 30–40 mm sinter indicating that larger size fractions of sinter possess higher cold strength. However, the percentage of fines generated from these size fractions (shown in Fig. 5) exhibits a different trend. It can be observed from Fig. 5 that the percentage of fines generated from sinter in the size range 10–20 mm is the lowest (∼16%) while that generated from sinter in the size ranges 5–10 mm and 20–30 mm is the highest (∼20%). The 30–40 mm size fraction of sinter generated 19% fines during the Tumbler test. This indicated that the Tumbler Index of a sinter sample does not necessarily provide an indication of the percentage of fines (<5 mm) that would be generated from a sinter sample.
Tumbler Index of various size fractions of sinter
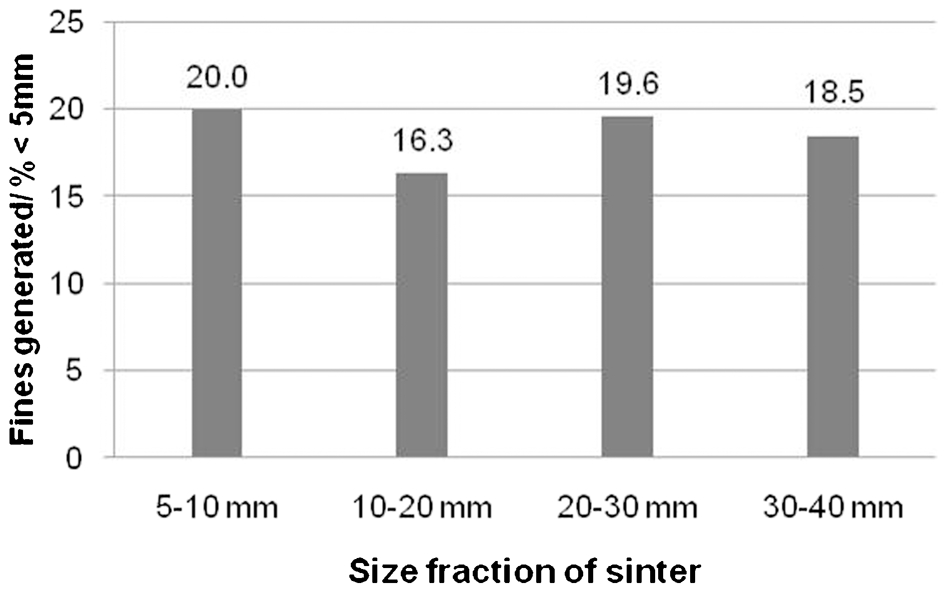
Percentage of fines (<5 mm) generated from Tumbler tests
Furthermore, the volume breakage index calculated for these tests showed yet another trend. Figure 6a shows the volume breakage index for various size fractions of sinter and Fig. 6b shows the same data of volume breakage index plotted against the mean size of sinter on a logarithmic scale. It can be seen from Fig. 6a that the volume breakage was lowest for the 5–10 mm size fraction of sinter and increased continuously with increase in sinter size. This observation is in line with the findings reported by Teo et al. 3 According to them, for a constant drop height, volume breakage index and the diameter of lumpy material would be positively correlated and the relationship was logarithmic in nature. In the present case, for the same Tumbler test, the relationship between volume breakage index and the size of sinter was observed to be logarithmic as shown in Fig. 6b . However, the trend in percentage of return fines generated from various size fractions of sinter is not in line with the trend in volume breakage index. This may be explained from the granulometry of sinter obtained after the Tumbler tests. Though the volume breakage index for 5–10 mm sinter is the lowest, any disintegration would result in the formation of sinter less than 5 mm that would report as fines. Therefore, the percentage of fines generated is the highest in the case of this size fraction.
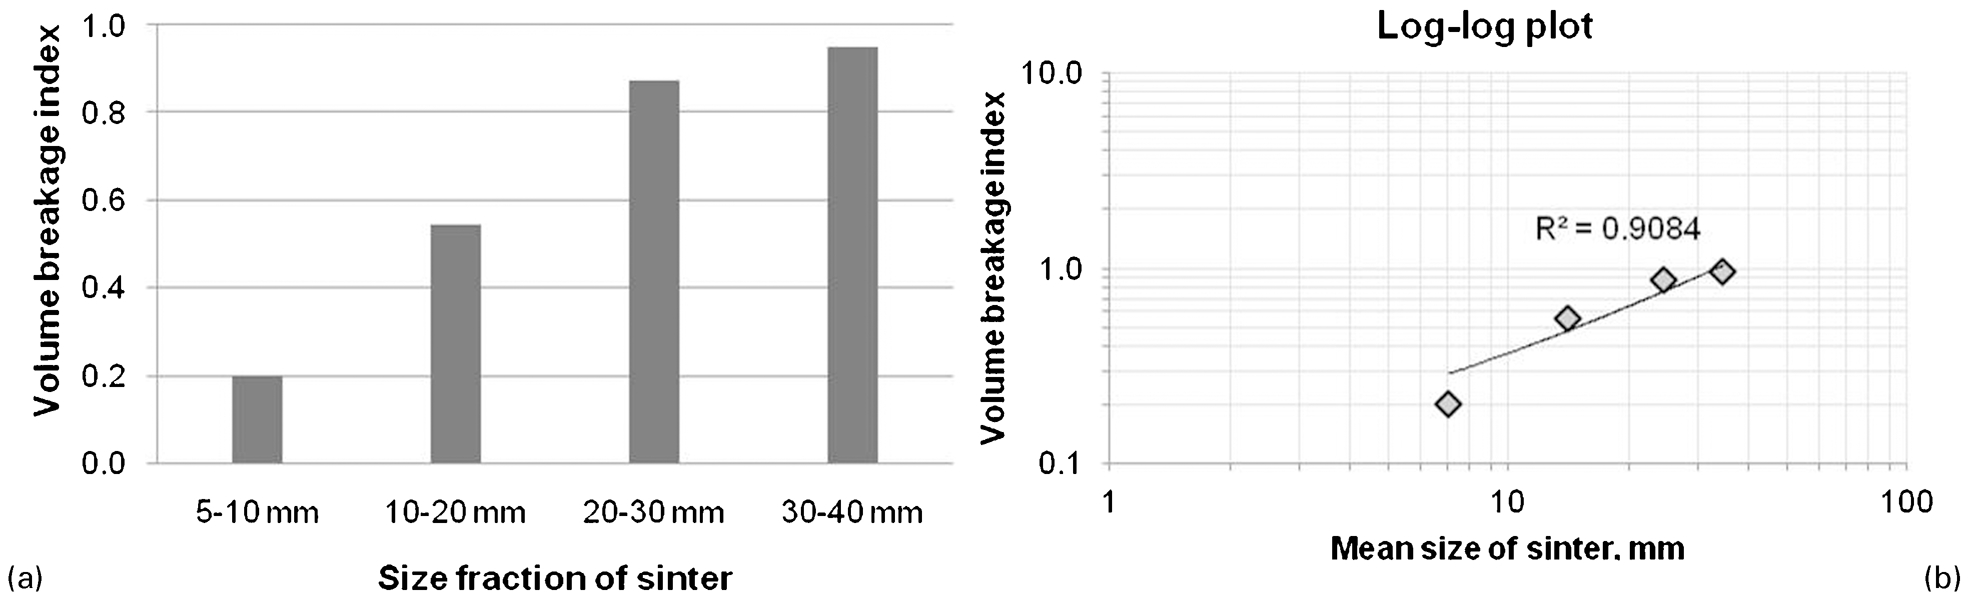
a volume breakage index of various size fractions of sinter obtained from Tumbler tests and b log–log plot of volume breakage index versus mean size of sinter used in Tumbler tests
On the other hand, although the volume breakage index of 30–40 mm sinter is the highest, it disintegrated into several lower size fractions and the percentage of sinter less than 5 mm was not the highest. From the above discussion, it is clear that the Tumbler Index of sinter and the volume breakage index do not provide an accurate indication of the percentage of fines that would be generated during sinter disintegration.
Drop tests
The volume breakage index for the drop tests for each size fraction of sinter is shown in Fig. 7. It can be observed from Fig. 7a that for any size fraction, the volume breakage index increases with increasing drop height. This is expected because the momentum with which sinter impacts the surface increases with increasing drop height. It can be observed from Fig. 7b that for any sinter sample, the relationship between volume breakage index and drop height is logarithmic in nature. Similar findings were reported by Teo et al. 3 who mentioned that for a given size of lumpy material, the breakage index and the drop height are positively correlated and exhibit a logarithmic relationship. It can be seen that once again, the volume breakage index increases with increasing size of sinter indicating that larger sinter particles are prone to undergo more volume degradation. Furthermore, it can be observed from the figure that for any size fraction, the volume breakage index was higher when sinter was dropped onto a steel plate compared to when it was dropped onto a rubber mat. This is because in the case of a steel plate that is a hard surface, less energy is absorbed by the surface and almost all the impact energy is transferred to the sinter, leading to propagation of cracks and generation of fines. In the case of a softer rubber mat, part of the impact energy is absorbed by the surface, therefore, the amount of energy transferred to the sinter is lower resulting in generation of less fines.
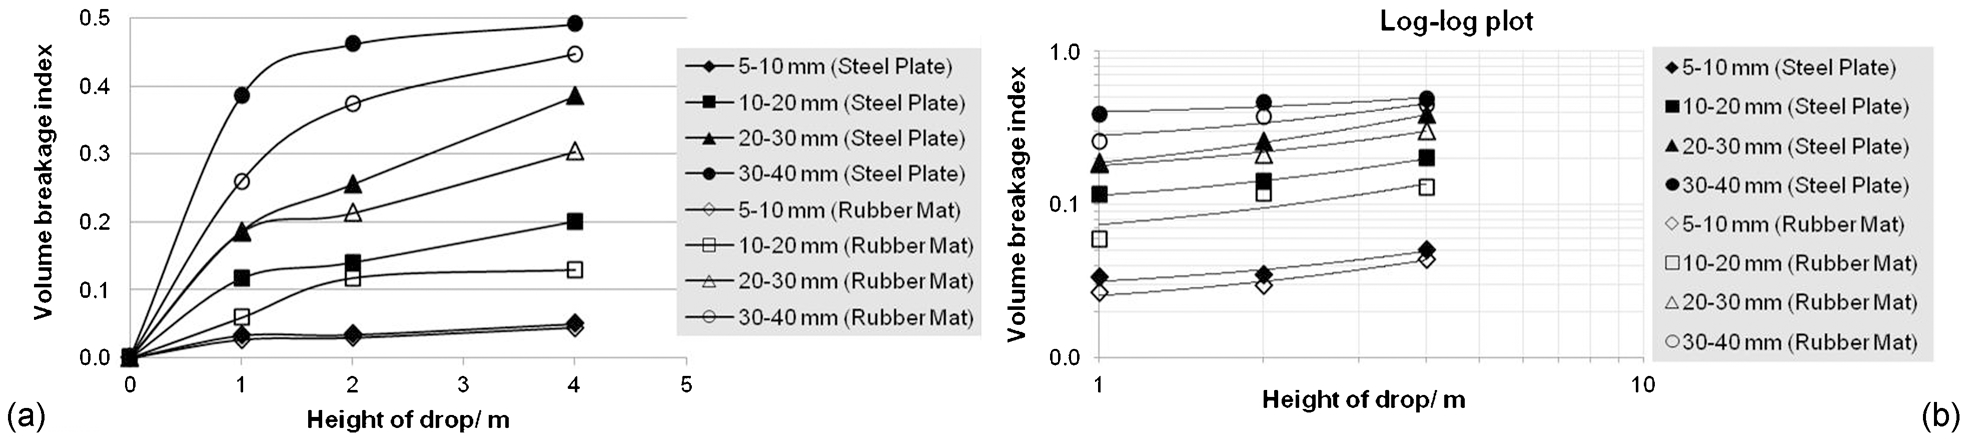
a volume breakage index versus drop height for various size fractions of sinter and b log–log plot of volume breakage index versus drop height for various size fractions of sinter
The effect of drop height on the percentage of fines generated from various size fractions of sinter during drop tests on both the impact surfaces is shown in Fig. 8. It can be seen that for any size fraction and impact surface, the percentage of fines generated increased with increasing drop height. This is expected as the momentum of impact increases with increasing drop height. It is however interesting to note that the relationship between percentage of fines generated and the drop height is linear in nature for all size fractions of sinter and impact surfaces. This is unlike the logarithmic relationship between volume breakage index and drop height observed earlier. It can also be observed that the percentage of fines generated is less when sinter is dropped on the rubber mat compared to when it is dropped on the steel plate. This can once again be attributed to the partial absorption of impact energy by the rubber mat. However, the difference in the percentage of fines generated by impact on the steel plate and the rubber mat is not discernible in case of the 10–20 mm size fraction of sinter. From Fig. 8, it can be observed that the contribution of sinter size fractions to percentage of fines generated in drop tests is in the following order:
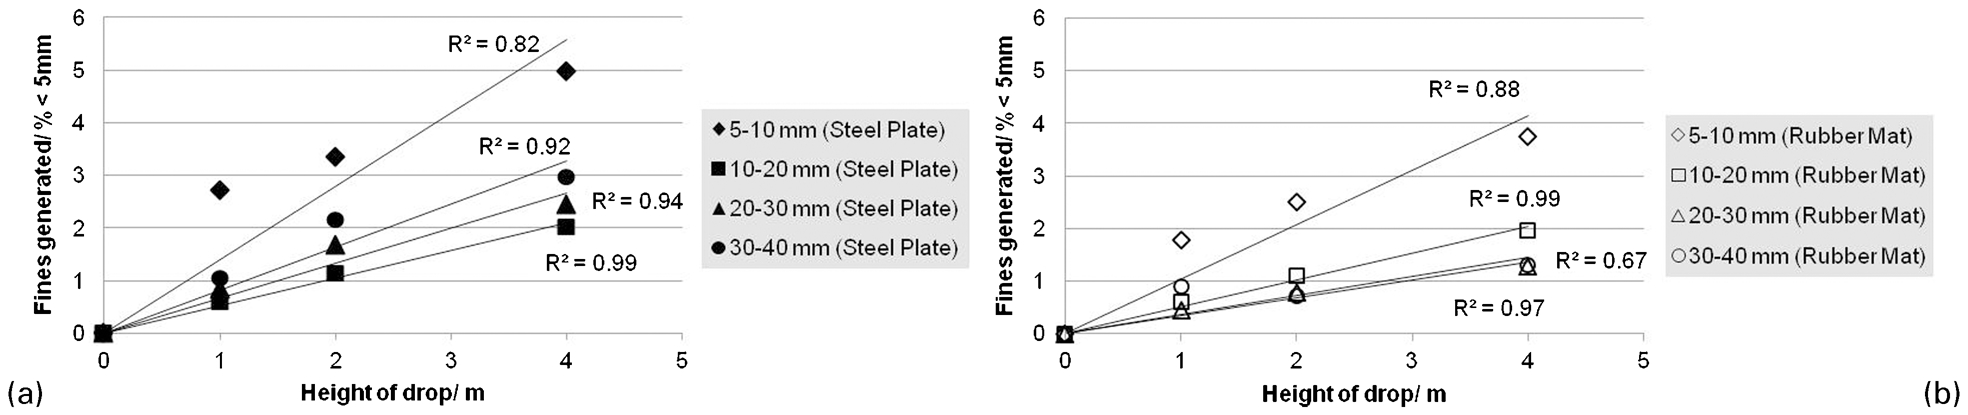
Effect of drop height on percentage of fines generated for various size fractions of sinter with a steel plate as impact surface and b rubber mat as impact surface
For any given drop height, the 10–20 mm size fraction of sinter generated the least fines while the 5–10 mm size fraction of sinter generated the most fines. The contribution of sinter in the size fractions 20–30 mm and 30–40 mm to fines was intermediate between that of 5–10 mm and 10–20 mm. From the results of drop tests it can be inferred that the trend in the percentage of return fines generated from various size fractions of sinter is not necessarily the corresponding trend in volume breakage index for the same reason discussed in the section on ‘Tumbler tests’.
Vibration tests
The volume breakage index from the vibration tests for various size fractions of sinter is shown in Fig. 9. It can be observed from Fig. 9a that the volume breakage index increased at a higher rate from an initial value of zero in the first few minutes after which it increased only slightly with increasing vibration time. Furthermore, the volume breakage index increases with increasing the size of sinter indicating that disintegration in the case of vibration tests is also a first order process.
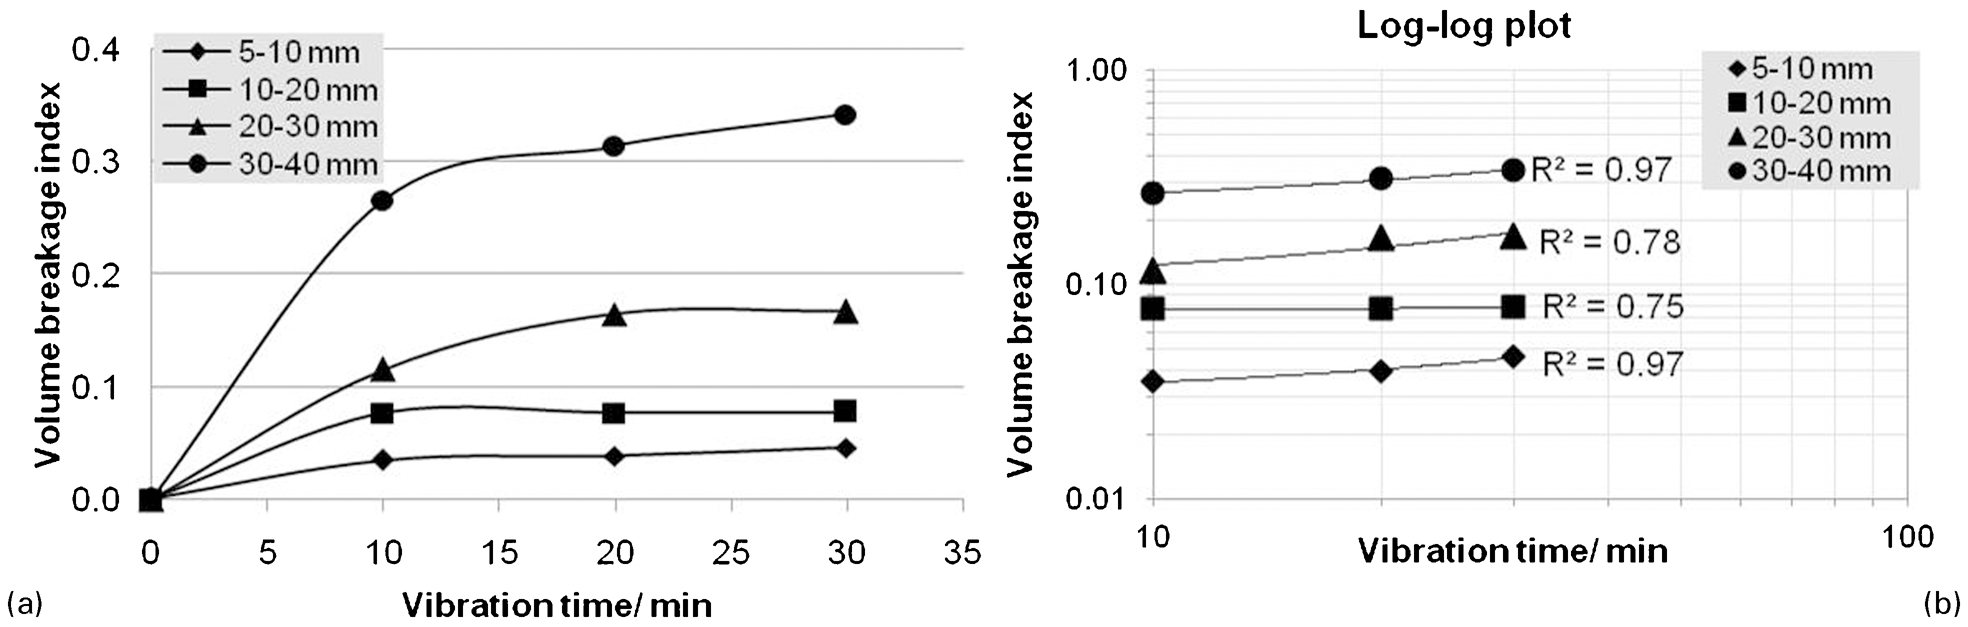
a volume breakage index versus vibration time for various size fractions of sinter, b log–log plot of volume breakage index versus vibration time for various size fractions of sinter
The drop test and the vibration test are different from the viewpoint of energy transfer to the sinter particles. In the drop test, the kinetic energy is spontaneously transferred to the particles upon impact and is used for breaking the agglomerates. In the vibration test, the transfer of energy to the sinter particles is not spontaneous and takes place continuously over the duration of the test. In spite of the difference in mode of energy transfer, volume breakage indices from the drop tests and vibration tests showed similar trends as can be observed from Figs. 7a and 9a . Furthermore, volume breakage index was found to exhibit a logarithmic relationship with vibration time as shown in Fig. 9b indicating that the volume breakage index initially increases at a faster rate and then tapers off. Physically, the trend may be explained as follows. In the initial few minutes of the vibration test, the energy transferred to the sinter would lead to propagation of cracks and generation of fines thereby increasing the volume breakage index. However, release of stress in the sinter and cushioning effect provided by the generated fines would slow down the rate of generation of fines and taper the volume breakage index. Cushioning effect of undersized particles was reported by Teo et al. 3 as well. A limited number of experiments were conducted using fines less than 5 mm along with the feed to examine their effect on disintegration behaviour of sinter. Results from these tests are discussed in the section on ‘Cushioning effect of <5 mm sinter’.
The effect of vibration time on percentages of fines (<5 mm) generated for various size fractions of sinter is shown in Fig. 10. It can be seen that for any size fraction of sinter, the percentage of fines increases with increasing vibration time. This is expected as the energy supplied to sinter increases with increasing vibration time because of which more and more cracks become critical and lead to disintegration. It is, however, interesting to note that the rate of fines generation is higher during the initial stages of vibration but slows down as the vibration time increases for all size fractions. For actual conveying of sinter, this implies that the rate of generation of fines will be higher at the charging end of the conveyor and will decreases towards the discharge end of the conveyor. The relationship between percentage of fines generated and the vibration time appears to be logarithmic unlike the case of drop tests where the percentage of fines was linearly related to the drop height. In this case, the logarithmic relationship may again be attributed to the de-stressing of sinter and the cushioning effect provided by the undersize particles generated as a result of vibrating action.
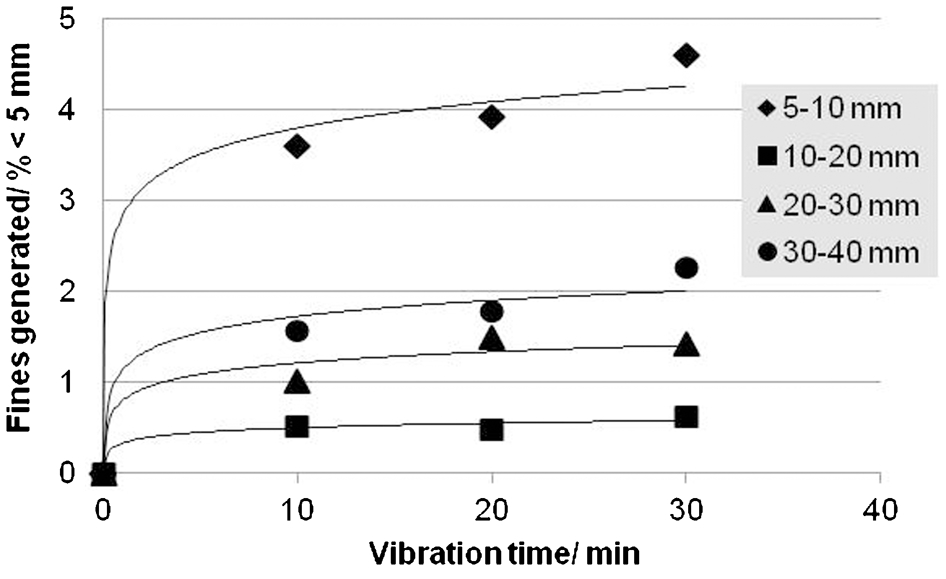
Effect of vibration time on percentage of fines generated for various size fractions of sinter
It can be observed from Fig. 10 that the contribution of sinter size fractions to percentage of fines generated in vibration tests is as follows:
Cushioning effect of <5 mm sinter
Teo et al. 3 reported that undersize material provides a cushioning effect and decreases the disintegration of lumpy materials. To examine their effect on percentage of return fines, the following experiments were conducted:
Tumbler tests on all size fractions of sinter with 10% sinter fines (<5 mm) added to the feed
drop tests on all size fractions of sinter from a height of 2 m using steel plate as the impact surface and 10% sinter fines (<5 mm) added to the feed
vibration tests on all size fractions of sinter using a vibration time of 30 min with 10% sinter fines (<5 mm) added to the feed.
The percentage of fines generated in all the above cases was compared against the percentage of fines generated from the corresponding tests in which sinter fines were not used and are shown in Figs. 11–13. It can be observed that the percentage of fines generated decreased by at least 4% (except for sinter in 5–10 mm size range) when undersized sinter was used. This indicates that <5 mm sinter provided considerable cushion from impact and abrasion in the Tumbler drum. From Fig. 12, it can be seen that the percentage of fines generated also decreased when <5 mm was used in the drop tests. However, the decrease in this case (∼1%) is lower than that observed in Tumbler tests. This is because in the drop tests, almost all the sinter particles hit the impact surface at the same time and particles influence each other to a limited extent. Figure 13 shows the percentage of fines generated from vibration tests with and without the presence of undersized sinter. It can be observed from the figure that there is negligible decrease in the percentage of fines generated with the introduction of undersized sinter. Only in the case of 5–10 mm sinter, the decrease was ∼1·6%. This indicates that undersized sinter did not act as a cushion during vibration tests, possible because the vibrational energy in these tests was being provided externally and all sinter particles were subjected to the same regardless of their size. This also indicates that the decline in the rate of fines generation at higher vibration times is more due to de-stressing of sinter and less due to the cushioning effect of generated fines.
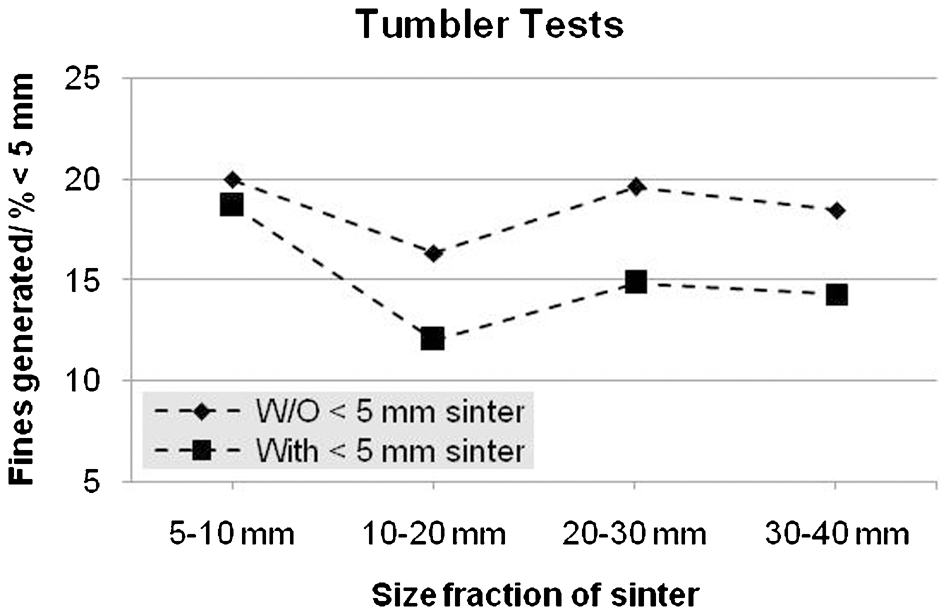
Fines generated from Tumbler tests with and without sinter fines
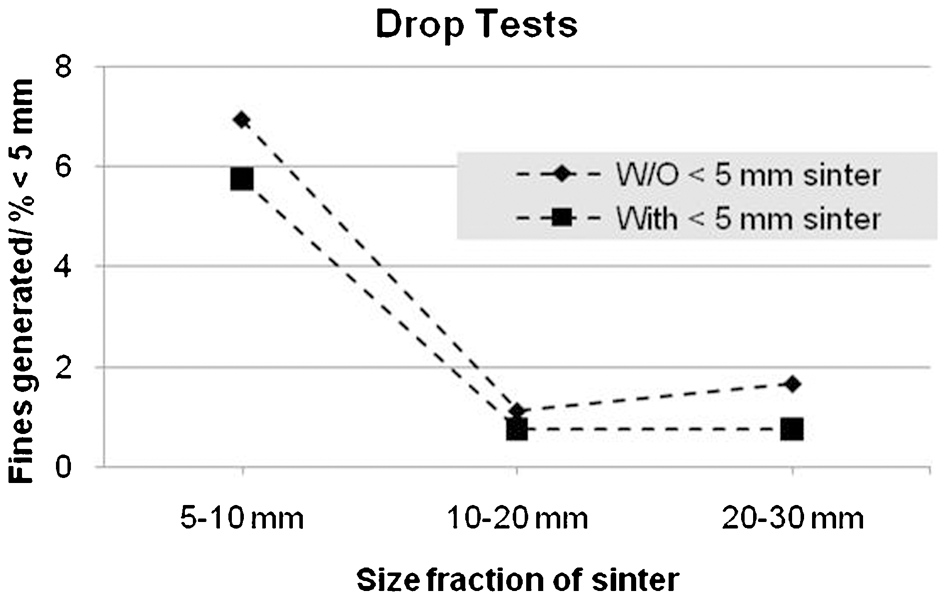
Fines generated from drop tests with and without sinter fines
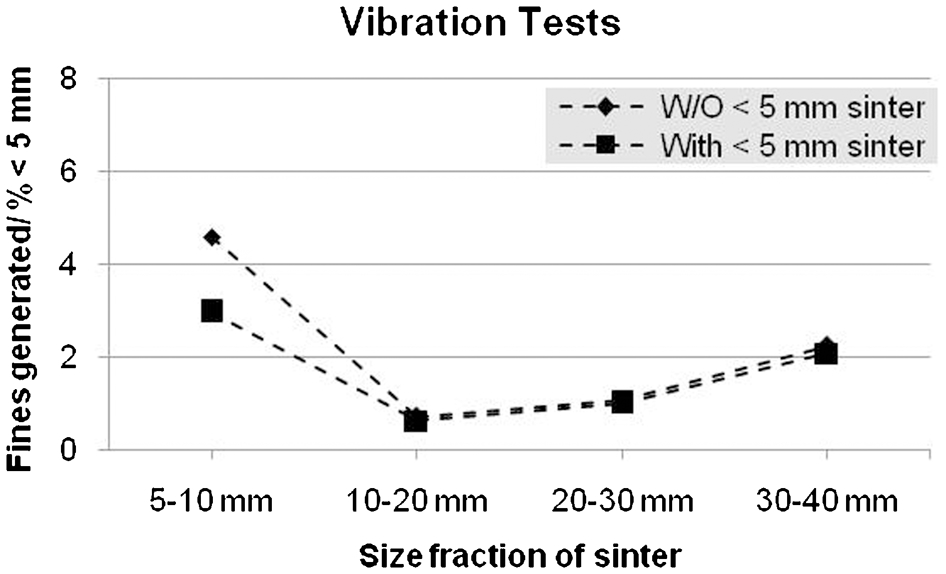
Fines generated from vibration tests with and without sinter fines
Conclusions
Iron ore sinter disintegrates during transportation to form return fines (<5 mm) that represent loss of useful sinter. Conventional tests of cold strength of sinter such as the Tumbler test and the shatter test cannot predict the effect of transport parameters such as the drop height, conveying length, etc. on the amount of return fines generated during transport. In this work, various steps involved in transportation were simulated using customised drop and vibration tests, and the effect of sinter size, drop height and conveying time on the percentage of return fines and volume breakage was examined.
Drop and vibration tests revealed that the extent of volume breakage is higher in case of larger sinter particles. The percentage of return fines from various size fractions did not follow the trend in volume breakage. The percentage of fines generated was found to be the highest in case of 5–10 mm sinter followed by 20–30, 30–40 and 10–20 mm sinter. The volume breakage index for all size fractions of sinter was found to be logarithmically related to the drop height and the time of vibration. For any size fraction, the percentage of fines generated was found to be linearly related to the drop height in the case of drop tests while it was found to be logarithmically related to the vibration time in the case of vibration tests. While sinter fines (<5 mm) provided excellent cushion to sinter during Tumbler tests, they had lesser cushioning effect during drop tests and negligible effect during vibration tests.
This work confirmed that the percentage of fines generated increase with increase in the height of the drop encountered by sinter during conveying. It revealed that vibrating action on the conveyors during transportation also leads to fines generation. One of the potential solutions to minimising return fines is, therefore, to transport sinter carefully for as little distance as possible. This can be achieved by:
decreasing the height of fall by using stone-boxes in the transfer chutes
using rubber mats as impact surfaces wherever possible
decreasing the overall conveying distance
minimising the number of drops by using a single long conveyor instead of multiple conveyors wherever possible.
For new sinter plants, it would be advantageous to incorporate these options during the design stage. Existing sinter plants can also incorporate some of these changes such as decreasing the height of fall and using rubber mats into their existing sinter transportation circuits to decrease generation of return fines and improve net sinter productivity.
This work also revealed that unit mass of sinter in the 5–10 mm size range contributes the highest to return fines with the actual contribution depending on the percentage of 5–10 mm sinter in product sinter. Elimination of 5–10 mm size fraction in product sinter is, therefore, another potential solution to minimising return fines. While it is impractical to prevent the generation of 5–10 mm sinter, it could be separated from product sinter and advantageously used as a hearth layer on the sinter strand. Typically sinter in the size range 10–25 mm is used as hearth layer on the sinter strand. Sinter in this size range contributes the least to return fines. Replacing the 10–25 mm size of sinter with the 5–10 mm sized sinter as hearth layer would decrease the percentage of unwanted size fraction and increase the percentage of desired size fraction in product sinter leading to overall reduction in return fines. The clearance between grate bars on sinter pallets is usually 4–6 mm. Hence sinter in the size range 6–10 mm may be used as a hearth layer provided the gas flow through the grate bars is not adversely affected. Pilot scale trials are in progress to investigate the effect of different size ranges of hearth layer on gas flow through the sinter bed.
Microstructural studies (image analysis and scanning electron microscopy) are also being conducted on the fractured (freshly created) surfaces of sinter from Tumbler, drop and vibration tests. These will help in the identification of phases that are susceptible to fracture during transportation. Results from microstructural analysis of fractured samples will be presented in a future communication.
Footnotes
Acknowledgements
The authors are grateful to the management at Tata Steel for the encouragement and support extended to this work. The authors would like to thank the supervisor of Pot Sinter Laboratory, Mr Kishore, research associate, Mr Rohit Shrivastava and other staff in the lab for their help with conducting experiments. Thank are also due to colleagues, Mr Shaik Shamshoddin and Mr Rajasekar for discussions and inputs on the subject.