
Abstract
Burden distribution in a blast furnace is vital to its smooth running. Mathematical models have been applied to guide the charging process to achieve desired burden distribution. The accuracies of such models depend on the prediction of falling curve, stock profile and burden descent mode. Among them, the stock profile model greatly influences the final burden distribution. In this study, a special evaluation index for the accuracy of the modelled burden profile based on charging volume is established. Six existing stock profile models were evaluated and compared with the published experiment data of a scaled blast furnace. It is found that all the models predicted the stock profile well. However, certain models showed increased accuracy for the particular case.
Introduction
The ironmaking blast furnace is a large scale, airtight, metallurgical reactor. Coke and ore are charged into the furnace layer by layer to form the burden distribution, which is essential for stable and efficient blast furnace operation. 1 In order to achieve the optimised furnace condition, it is important to predict and control the burden distribution. The distribution of the coke and ore layers can directly impact the gas flow pattern, the temperature distribution and the location of the cohesive zone. 2,3 With the wide range controllability of the bell-less charging equipment, the prediction of the burden distribution is the key to guide the charging procedures.
Burden distribution can be mathematically modelled by empirical model, 4 classical force theory, 5,6,18 discrete element method (DEM) 7 or neural networks. 8 Because of the accuracy and low computational cost, classical force theory has been widely utilised for predicting burden distribution, especially for online prediction. In classical force theory, the movement of raw materials is simplified to single particle movements. It includes discharging from the hopper, sliding along the rotating chute, free falling from the chute tip, stocking on the previous burden to form a new burden profile and descending to form the entire burden structure. It is known that the stock profile formation model greatly influences the burden distribution. Several models 10–16 have been proposed to predict the stock profile, which is closely related to the natural angle of repose, the chute angle, the depth of the falling curve and the radius of the impact point.
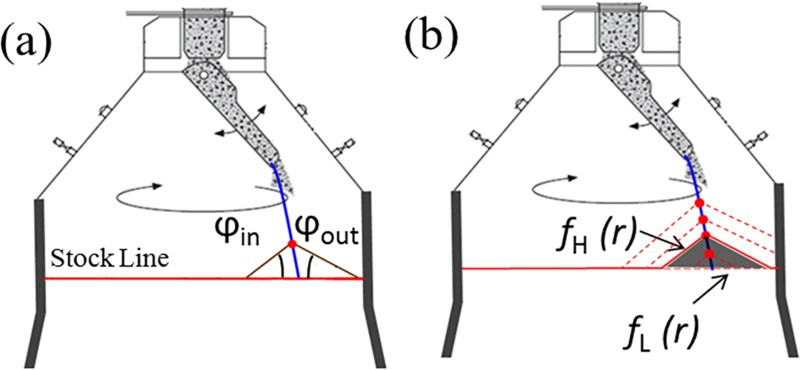
In general, the blast furnace is assumed to be two-dimensional and axisymmetric for simplicity. 1 The raw material falling on the stock line forms a ring shaped heap. The cross-section of the heap is assumed to be triangular and is determined by the inner angle of repose φin and outer angle of repose φout. 9
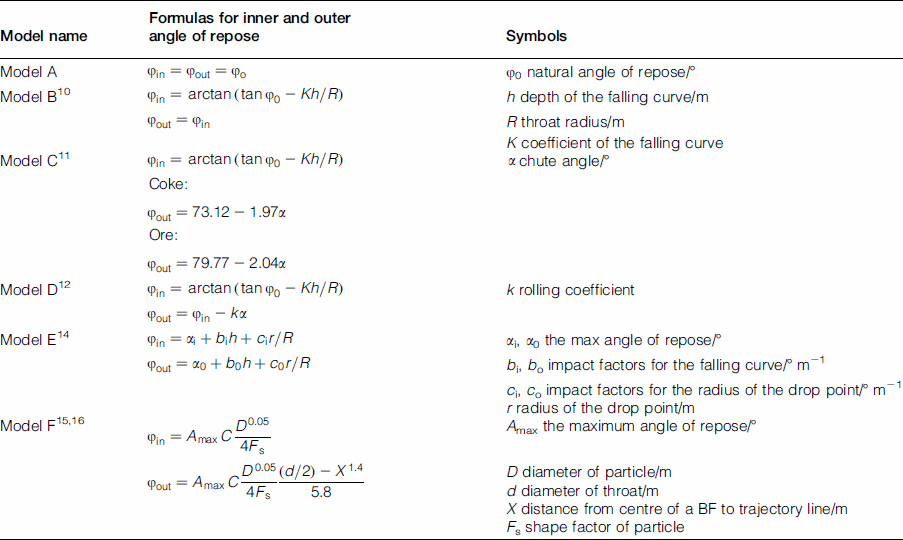
The main existing stock profile formation models are as follows: model A, the natural stocking model, which assumes that φin and φout are equal to the material natural angle of repose model B,
10
which considers the effects of the depth of the falling curve on the repose angle, and is a correction of the model A (natural stocking model) model C,
11
which treats the chute angle as the main factor, and is obtained by stocking experiments model D,
12
which takes into account the natural angle of repose, the chute angle and the depth of the falling curve, and is verified to be reliable by experimentation
13
model E,
14
which approximates the linear characteristics, and considers the influence of the radius of the drop point on the repose angle model F,
15,16
which takes into account the diameter of particle, the shape factor and the radial distance of the drop point, and is modified by a scaled model experiment and DEM simulation.
The purposes of this study are to evaluate the suitability of the different stock profile formation models and to analyse their accuracy through comparison with published experiment data of a scaled blast furnace.
Burden distribution model
Falling curve model
A brief description of the falling curve model is included here to clarify its basic features. A more detailed description has been published elsewhere, and it will not be repeated here. 15
This model is based on the balance of forces on a single particle, and it has been widely utilised to describe the trajectory of the raw material from the chute to the impact point of the stock profile. The movement of the raw material includes discharge through the hopper, sliding along the rotating chute and free fall from the chute tip. The validation of this model is detailed in the section on ‘Parameter determination of each stock profile formation model’.
Stock line profile formation model
Raw material falling on the stock line to form a ring shaped heap is shown in Fig. 1.
Stock profile formation
The stock line profile model assumes the following: the cross-section of the heap is assumed to be triangular, with the apex of the triangle on the falling curve trajectory; the shape of the triangle is determined by the inner angle of repose φin and the outer angle of repose φout and charging volume the distortion and collapse of the burden are neglected the volume of burden layer is conserved during stock formation and burden descent.
Currently, six conventional models are shown in Table 1.
List of stock profile formation models
φin and φout are the two key parameters of the stock profile formation model. Once the values of φin and φout are determined according to the specific model, the apex of the triangle moves along the falling curve trajectory until the volume formed by f
H(r) and f
L(r) satisfies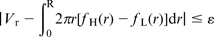
where f H(r) and f L(r) represent the upper and the lower regions of the burden profile respectively, V r is the charged volume for one ring, ε is the tolerance and R is the distance between the furnace centre and the wall region.
Calculation procedures
MATLAB is used to program the algorithm for burden distribution simulation. The algorithm is shown schematically in Fig. 2. At the beginning of the program, the parameters of the blast furnace, including furnace geometry, charging matrix, properties of the raw material, chute size, location of the chute suspension point and the location and profile of the initial burden surface, are entered. In this study, the above parameters are obtained from previous research. 17
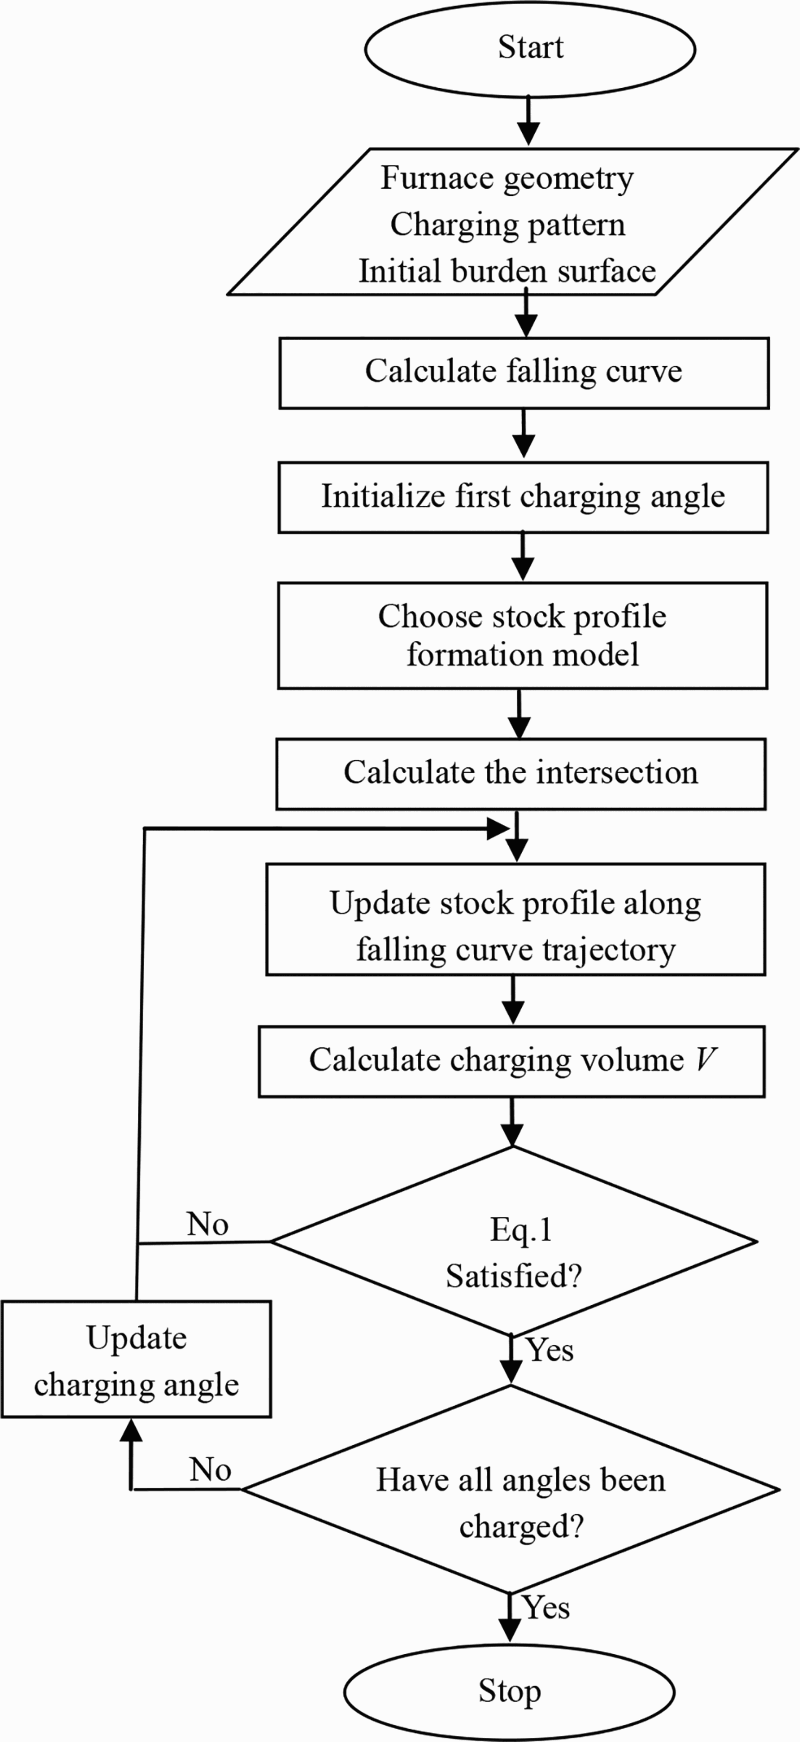
Schematic of calculation procedure for burden distribution simulation
Results and discussion
Experimental data
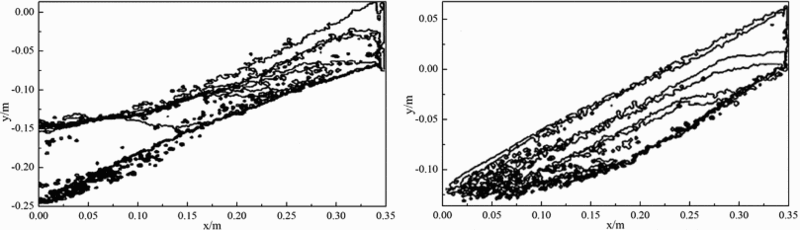
In the previous work by Jiménez et al., 17 a 1/10 scale semicircle model of Aceralia's blast furnace B shaft and bell-less top charging system has been developed to investigate the charging layer formation on the top of the blast furnace. The experimental data are employed to validate six stock profile formation models in this work. Table 2 represents the charging pattern employed in the scaled charging pattern for the model. One original feature of this charging pattern is the way in which the blast furnace is charged, beginning at the centre of the blast furnace and finishing at the wall. Table 3 shows the physical properties of the coke. During the charging process, coke and ore were charged ring by ring, and pictures of the layer profile after each dump were taken with the charge coupled device camera. The boundary of each rings in the picture are obtained by a reconstruction algorithm 17 as shown in Fig. 3.
Charging pattern for coke and ore in scaled model 17
Physical properties of coke in scaled model 17
Parameter determination of each stock profile formation model
The outline of each ring are digitalised into a piecewise linear profile as shown in Fig. 4. The detailed information of each pile top in Fig. 4 is calculated first as shown in Tables 4 and 5. The data are used to determine the parameters in each stock profile formation model by a least square estimation method, and the final result of the parameters are listed in Table 6.
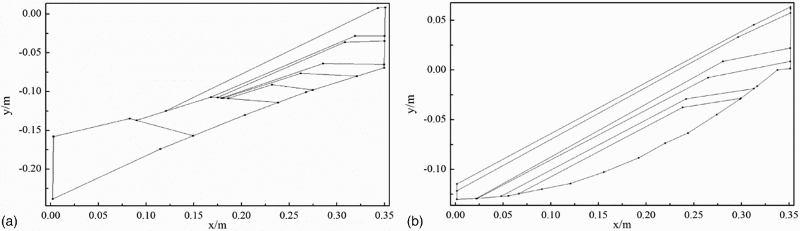
a piecewise linear profile of each ring in coke layer and b piecewise linear profile of each ring in ore layer
Information of coke layer's pile top
Information of ore layer's pile top
Parameterisation of each stock profile formation model
In Tables 4 and 5, it is obvious that the outer angle of repose for both the coke and ore layer decreases with increasing chute angle. The outer repose angle in the last coke ring and each ore ring is < 0, which indicates that the near wall part burden profile in these rings is up-inclined. This phenomenon often occurs in the last few rings in which the width of burden flow expands, 19 and part of the raw material may easily meet a collision with the furnace wall before stocking. The initial profile also has a great influence on the stocking process, and concave initial profile may easily cause collapsing and creep phenomenon, thus may be the reason that caused an up-inclined direction of the near wall part burden profile in the first few rings of the ore layer since there exists a concave initial profile for the ore charging process as shown in Fig. 3d . In general, these negative repose angles, which are not accepted in normal stocking process, will not be used to parameterise the stock profile formation model.
Validation of falling curve model
The calculated falling curve trajectory of each ring and the measured location of the pile top are shown in Fig. 5. In general, the calculated falling curve agrees well with the measured pile tops since all the pile top of the coke layer lie on the corresponding falling curves. Comparisons indicate that the mathematical model can predict the falling curve with acceptable accuracy.
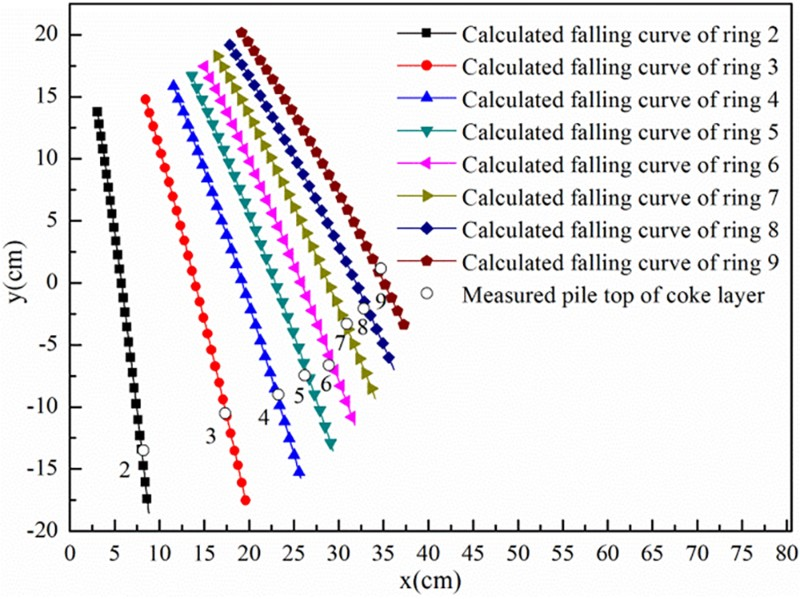
Calculated falling curve of coke layer and measured pile top location of coke layer
Evaluation of stock profile formation models
The stock line profile is formed by successive charged rings. The initial profile specified for the simulation is identical with the previous stock line profile obtained by the experiment. 17 The development of the stock line profile that is calculated by different stock profile formation models and the measured final profile of the coke layer is shown in Fig. 6.
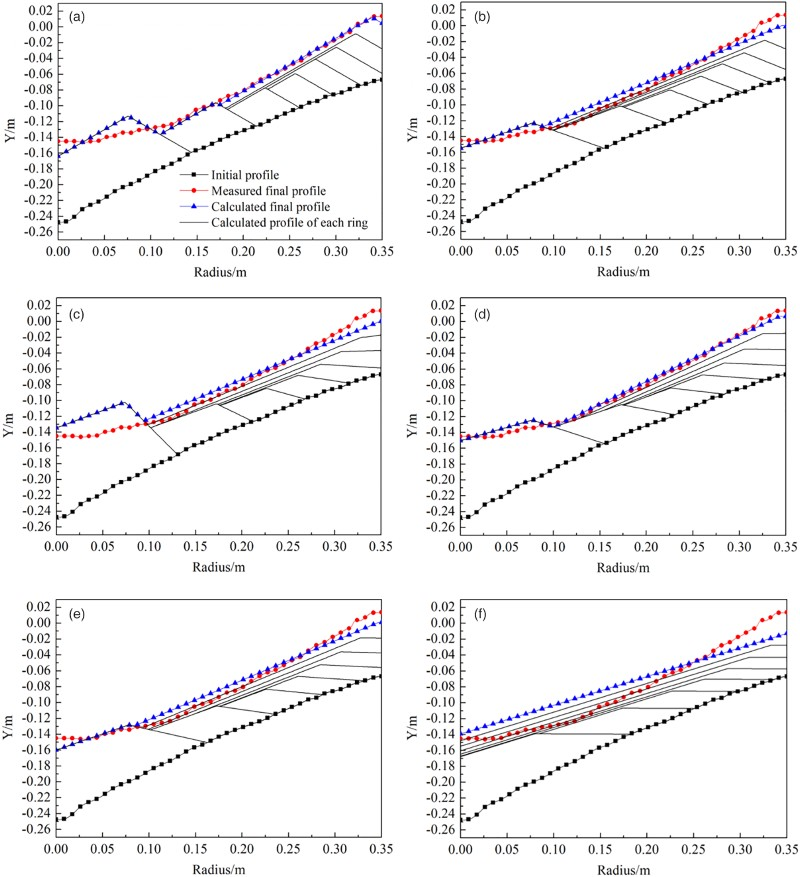
a coke layer calculated by model A, b coke layer calculated by model B, c coke layer calculated by model C, d coke layer calculated by model D, e coke layer calculated by model E and f coke layer calculated by model F
In Fig. 6, all the models predict the overall shape of the measured profile. However, the final coke layer profiles calculated by models A and C (Fig. 6a and c) result in considerable error in the central region of the blast furnace when compared with the measured final profile. Model F (Fig.6f) underpredicts the slope of the coke layer profile. The error of the profile in the central region is significantly reduced in model B (Fig. 6b ) compared with the models A and C. This indicates that the depth of the falling curve has a great influence on the burden profile since the effects of the depth of the falling curve on the repose angle is considered in model B. As for Fig. 5c , the error in the central region is probably caused by the limitation of model C, in which the outer repose angle may be larger than the natural repose angle when the chute angle is very small. This abnormal phenomenon can be found when comparing the first ring's profile between Fig. 6a and c. In model D, the influence factor of the chute angle to the burden profile, which is fixed in model C, is treated as variable and can be determined experimentally. With this correction, the error of the final profile in the central region decreases significantly.
To quantitatively evaluate the error between the experiment and calculated results, the evaluation error is established as follows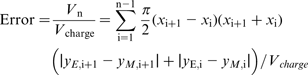
The quantitative error of each model is shown in Table 7. It is clear that model E has the minimum error of 5.81%. Model F leads to the maximum error of 25.13%, which is even higher than the error of the natural stocking model. With a correction on model C, the error of the final profile in model D decreased significantly from 13.88 to 8.64%. Over all, model D improves the accuracy for central coke charging pattern compared with model C. Model F needs to be enhanced when calculating the coke layer profile, which is formed in similar charging pattern. Models D and E show higher level of precision while calculating the burden profile for this particular case.
Quantitative error of different models
Conclusions
In this study, six models for the different expressions of the angle of repose are evaluated and compared with the published experiments data of a scaled blast furnace. It is found that all the models predicted the overall stock profile well. However, certain models show increased accuracy for a particular case. The major findings are listed below. The inner and outer repose angles of the charged material inside the blast furnace are different than the natural repose angle of the material. Overall, most models show improved accuracy over model A (natural stocking model) by considering the inner and outer repose angles as functions of the chute angle, the depth of the falling curve and the radius of the impact point. Model D improves the accuracy for central coke charging pattern. Model F has the largest error value and needs to be enhanced when calculating the coke layer profile in central coke charging pattern. Models D and E shows higher level of precision for this particular case.
Footnotes
Acknowledgements
This work was financially supported by the National Natural Science Foundation of China (grant no. 61290325).