
Abstract
In a continuous casting process, mould powder is typically adopted to cover molten steel, which prevents liquid steel from oxidation by air, preserves heat for the top layer of liquid steel, lubricates the initial shell and so on. However, mould powder may deteriorate the quality of the final product if the entrapment of mould powder forms, which is usually caused by the instability of the steel/slag interface. In the current work, a model to predict the critical point of interfacial instability for liquid–liquid stratified flow was developed based on the Kelvin–Helmholtz instability. To prove the validity of the prediction model, a water model experiment was carried out in a rectangular container. In this experiment, oil and water were used to simulate slag and molten steel respectively. The results of the water model prove that the prediction model is correct. Applying the prediction model to a steel–slag system, the critical velocity of molten steel for mould powder entrapment is 0.463–0.541 m s− 1. When considering the most severe chemical reaction, the critical velocity decreases to 0.29 m s− 1. The lowest critical velocity of molten steel is 0.264 m s− 1 when the viscosity of the slag and steel/slag interfacial tension is extremely low.
a constant a coefficient acceleration of gravity, m s− 2
height of a certain phase, m wavenumber molten steel pressure, Pa radius of curvature of interface, m slag/mould powder velocity of liquid flow, m s− 1
critical velocity, m s− 1
lighter phase heavier phase velocity potential interface coordinate amplitude of interfacial wave, m viscosity, Pa s kinematic viscosity, m2 s− 1
angle between the interface and the level density, kg m− 3
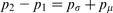
interfacial tension between two phases, N m− 1
frequency of interfacial wave, HzList of symbols
Introduction
Interface stability typically plays an important role during the metallurgical process. Severe fluctuation of the steel/slag interface will always lead to emulsification, including steel droplets dispersing into the slag and slag droplets dispersing into the steel. 1,2 As a result of the emulsification, the steel/slag interfacial area will increase with the deterioration of emulsification, which will enhance the chemical reaction rate. Moreover, if the entrained slag droplet is captured by the solidified shell, this will diminish the quality of the continuous cast steel.
Many studies have been published on slag entrainment. 3–14 This issue is divided into types in terms of the continuous casting process, as shown in Fig. 1. 3 However, vortexing, bubble rupture and high speed surface flow are considered more important in forming entrainment in the actual casting process. 6,7 Previous investigations have pointed out that the rupture of a large argon bubble can make the steel/slag interface unstable. 6,7 When the gas flowrate reaches a critical value, slag entrainment will form. 8 Moreover, in the case of asymmetrical flow or flow past a cylinder, a vortex will be induced by the collision of two molten steel flows, which come from the two narrow faces. 9 This is another important cause of slag entrainment. Watanabe et al. investigated the suction of Karman's vortex in various viscosities and interfacial tensions using a water and hot model. 10 It was found that the viscosity of the slag and the interfacial tension significantly influence slag entrainment and that the effect of viscosity is larger than that of interfacial tension. In addition, if high speed liquid steel flows along the steel/slag interface, slag entrainment may also form. This phenomenon is called the Kelvin–Helmholtz instability (KHI) problem. 11 In the KHI theory, shear stress causes the interface to become unstable, while the interfacial tension and gravity stabilise the interface. Hagemann et al. and Savolainen et al. studied the effect of physical properties on this item in the cold model. 12,13 They found that increasing the physical properties (viscosity of light phase, density difference, interfacial tension and thickness of light phase) results in a rise in the critical flow velocity of slag entrainment. As another phenomenon caused by KHI, the Marangoni flow is considered another cause of slag entrainment. In the study of Gaye et al., increasing amounts of sulphur in metal can significantly decrease the interfacial tension of the steel/slag. 14 This may also generate an interfacial tension gradient along the steel/slag interface. Cramb et al. found that this interfacial tension gradient may cause the Marangoni flow in the two liquid phases near the interface respectively. 15 When a velocity difference forms between the high viscosity phase (slag) and the low viscosity phase (steel), this will eventually lead to KHI.
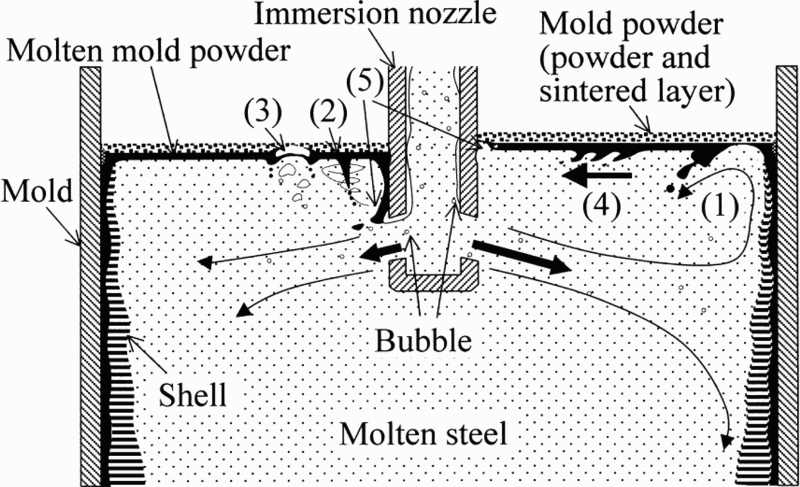
Mechanism of mould powder entrapment in continuous casting process3
To prevent slag entrainment in the casting mould, it is considered that the viscosity and the interfacial tension were benefitted as higher as possible. 5,6,12,13 However, excessive viscosity makes it difficult to control other metallurgical effects of the mould powder, such as lubrication of the solidified shell. Hence, understanding the fundamental of slag entrainment is necessary to be able to design more specific and accurate mould powders.
In the current work, the entrainment caused by shear flow with a dipping angle is investigated. First, a prediction model to explain the KHI of the liquid/liquid interface is deduced based on the kinematic boundary condition, the dynamic boundary condition and the Bernoulli equation. Then, an experiment is carried out using a water model. The effect of viscosity and interfacial tension on entrainment, compared with the calculated value of the prediction model, is discussed. Finally, the critical velocity of the steel–slag system is evaluated using the prediction model.
Model for liquid/liquid interfacial instability
Previous prediction models of liquid–liquid stratified flow
In terms of gas–liquid flow, previous investigators have suggested that liquid droplet entrainment in gas can be attributed to KHI.
16–18
In the KHI theory, the pressure variation of the gas/liquid interface due to the compression of the gas phase makes the interface unstable, and entrainment may easily form at the crest of the wavelet. In terms of liquid–liquid flow, KHI is introduced to explain the growing amplitude of the interfacial wave and the wave breaking phenomenon.
19
In infinite space, the critical occurrence condition for the beginning of KHI is expressed by
20
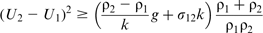
Equation (3) was introduced by Iguchi et al. to predict the onset of entrainment for the steel/slag interface in a continuous casting process. However, the effect of viscosity was not included in this case, and the calculated critical velocity of steel flow was 0.6 m s− 1, which was far faster than the value measured by Dauby.
24
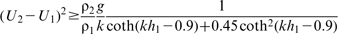
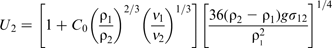
In addition, other transition equations for slag entrainment in the continuous casting process are given in the following sections.
25,26
The effect of viscosity is still not included in equation (4). Equation (5) considers the effect of viscosity, but the value of the interfacial tension substituted into the equation is just 1/50 times that of a typical situation. This means that the calculated critical velocity using the value of the interfacial tension in a typical situation is too fast

Development of viscous KHI problem
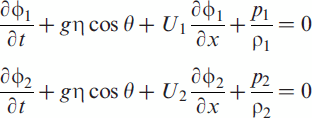
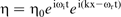
Owing to the reversing molten steel flow from the narrow face, a steel/slag interfacial wave will appear at the meniscus in the mould. This wave will grow with the increasing flow velocity of the molten steel flow. The interfacial wave can be considered a sine wave, as shown in Fig. 2. The coordinate system is set up based on the interface of two phases. The interface η can be expressed by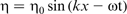

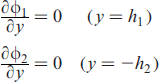
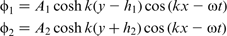
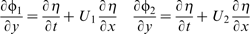

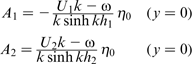
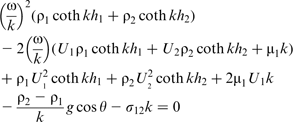

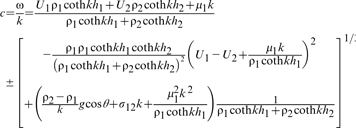
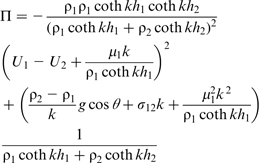

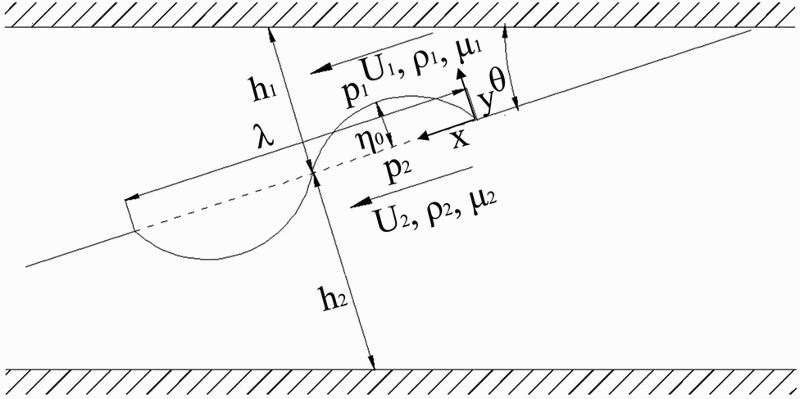
Schematic diagram of sinusoidal wave at beginning of entrainment
Experimental apparatus and testing procedure
An experimental apparatus was established to investigate the instability of a liquid–liquid stratified flow driven by shear flow. This experimental apparatus consisted of an acrylic reservoir, a water pump, a ball valve and a liquid flow meter. The reservoir has a width of 210 mm, a length of 1500 mm and a depth of 250 mm. Figure 3 shows the schematic diagram of this experimental apparatus and the dimensions of the reservoir. In the middle of the reservoir, a channel is formed by two acrylic slabs. Water flows into the channel along the slab and impacts the water/oil interface to the left of the channel, whereupon the water/oil interface becomes fluctuant.
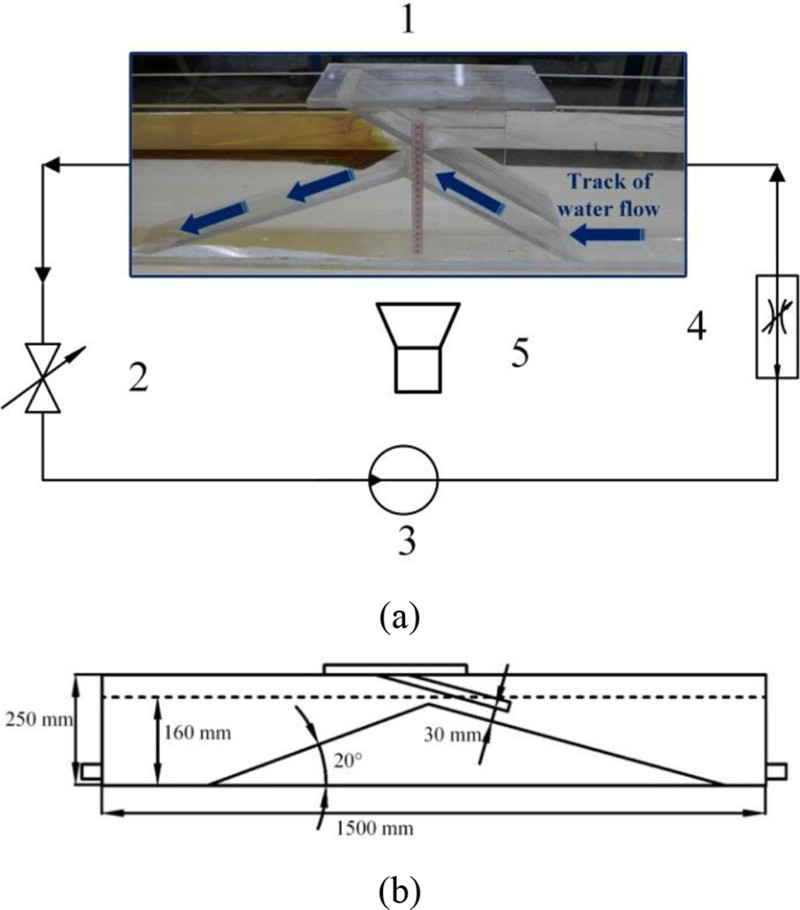
a schematic diagram of experimental apparatus (1: reservoir; 2: ball value; 3: water pump; 4: liquid flow meter; 5: CCD camera) and b dimensions of reservoir
Water and compound oil were used to simulate the molten steel and mould powder respectively. The depth of the water was constant at 160 mm, and the thickness of the oil was 15 mm for all the experiments. The compound oil was mixed by various rates of kerosene and mobile oil. The viscosity of the compound oil decreased with the increasing rate of kerosene. Moreover, a small amount of pure oleic acid (1–6%) was added to adjust the water/oil interfacial tension. Table 1 shows the physical properties of the compound oils. In the present work, viscosity at 298 K (25°C) was measured by a CQKJN-3 slag rotating viscometer based on the rotating viscometer method. The interfacial tension of the water/oil interface at 298 K (25°C) was measured by a JJ2000B spinning drop interface tension meter based on the spinning drop method.
Physical properties of liquids used for model study at 298 K (25°C)*
*Viscosity was measured by CQKJN-3 slag rotating viscometer based on rotating viscometer method. Interfacial tension of water/oil interface was measured by JJ2000B spinning drop interface tension meter based on spinning drop method.
A particle imaging velocimetry method was chosen to measure the velocity of the water flow near the water/oil interface. Fine solid particles, which should follow well with the water flow, were dispersed in the water as the tracer for particle imaging velocimetry. In this method, the velocity of the water flow was determined by the spatial displacement of a certain tracer at a constant time interval. The diameters of the particles range from 100 to 200 μm, and the density is 998.6 kg m− 3. A Cannon EOS700D was used in this experiment to record the experimental video. The frame number of this camera was 50 fps. In individual examinations, the rate of the water flow gradually increases until oil droplets form, and then the flowrate remains constant.
Interfacial phenomenon in cold model
Visual forming process of entrainment
The interfacial wave movement of compound oil F at a flow velocity of 0.266 m s− 1 in 0.48 s is shown in Fig. 4. Because of the shear flow of the water, the interfacial wave moved from right to left with time in this experiment. As shown in Fig. 4, the interfacial wave is first generated (Fig. 4a ). Then, it arrives at the protrusion with an increase in amplitude (Fig. 4c ). Finally, droplets form at the protrusion (Fig. 4d ). It was found that with an increase in the flow velocity, the fluctuation of the interface became more severe. After reaching a certain flow velocity, which is called the critical velocity, the interface became unstable, and droplets formed at the tip of the protrusion. Then, the flow velocity continued to increase, and the frequency of the entrainment rose sharply. This phenomenon observed in the current study is similar to that in other works using the water model. 11,13,29
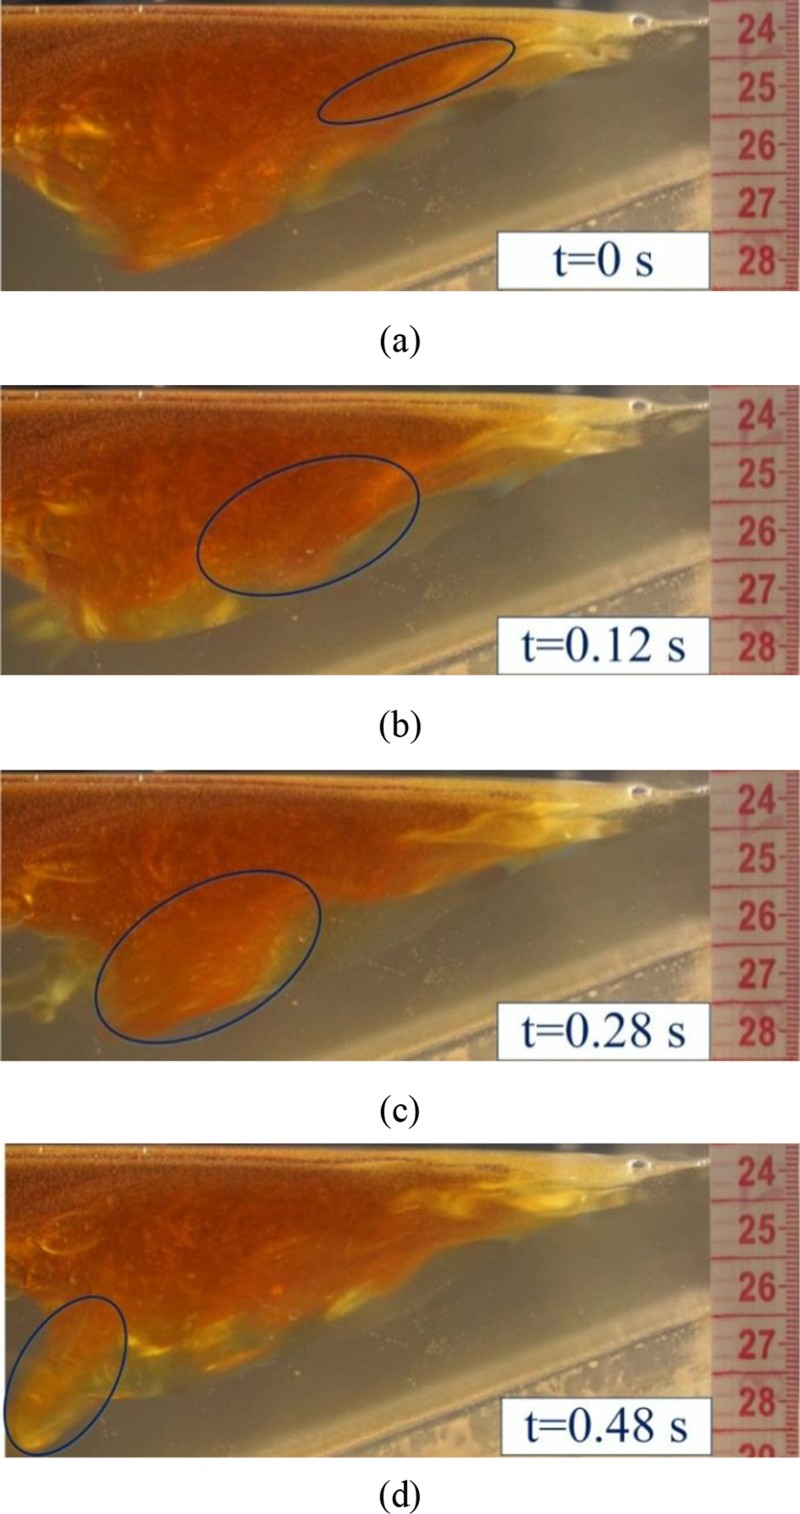
Interfacial wave movement of water–oil system with time at critical velocity in water model
Characteristics of interface wave
Twenty interfacial waves for each run of the experiment were analysed using the open source image processing software ImageJ. Then, the mean of λ was acquired. The wavenumber k can be calculated by equation (26).
27
Fig. 5 shows the relation between the interfacial wavelength and the viscosity of phase 1 μ1. The results indicated that, as the viscosity increased, the interfacial wavelength increased. A similar trend was obtained by Iguchi et al., who studied the characteristics of an interface wave for a water–oil system in a slant reservoir.
11
However, the interfacial wavelength measured by these researchers ranged from 0.035 to 0.056 m. Furthermore, as shown in Tables 2 and 3, the interfacial wavelength remained almost constant for various velocities of water flow and water/oil interfacial tensions
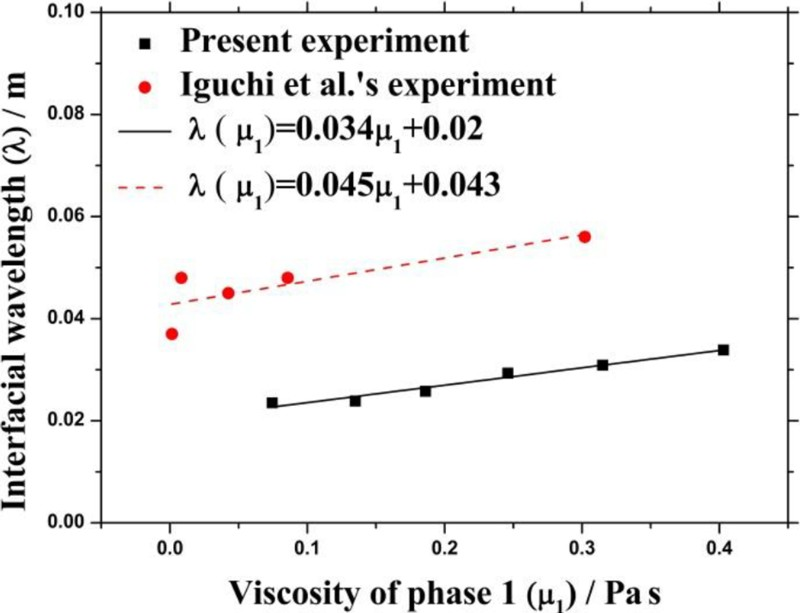
Relation between viscosity and interfacial wavelength at critical velocity
Relation between flow velocity and wavelength
Relation between interfacial tension and wavelength at critical velocity
Effect of viscosity on critical velocity of entrainment
The average critical velocity was acquired for three runs of experiments using compound oils A–F. Figure 6 shows the critical velocity with the increasing viscosity obtained from the present study and other studies compared with the estimated values calculated by the models. 13,29 The critical velocity U c for entrainment increases with increasing viscosity μ1. The trends of all these experiments are in agreement. However, the critical velocity of this investigation is higher than that of Hagemann et al. and lower than that of Savolainen et al. 13,29 In addition, the critical velocity obtained from Iguchi et al. approximates to this work, which is 0.16–0.23 m s−1. 11 The variation in the critical velocity between different studies is mainly due to the difference in the density of the oils, interfacial tension and experimental conditions. For the models’ estimated values, all the calculated critical velocities kept the same trend by substituting the physical properties of compound oils A–F into their models. The value calculated using the present model is in agreement with that of the current experiment. Moreover, the value calculated by Lei et al. is much higher than that of the other experiments except for that of Savolainen at al. 11,25 The researchers explained that because the Re number at the interface is too large, the substituting interfacial tension should decrease to 1/50 times of the measured value.
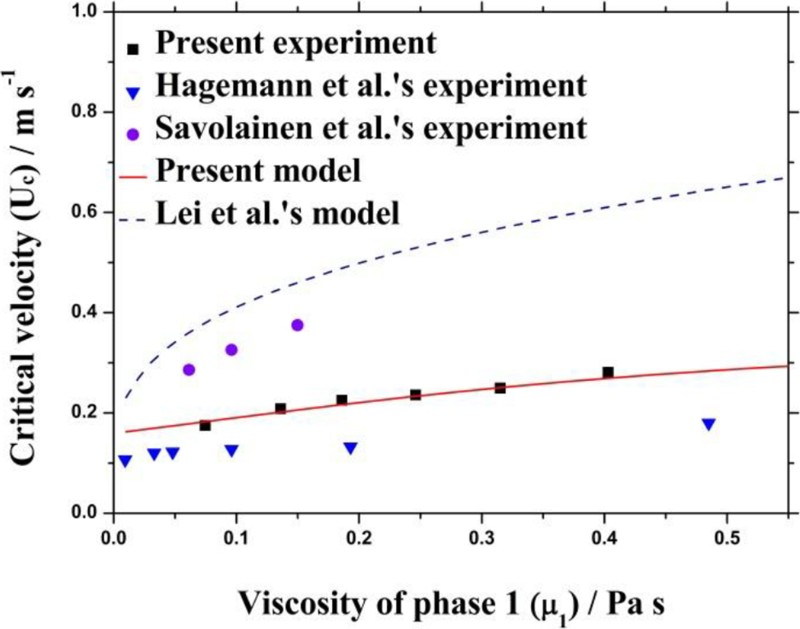
Comparison of effect of viscosity on critical velocity between different experiments and models
Effect of interfacial tension on critical velocity of entrainment
Using compound oils D, G, H, I and J, experiments were carried out for three runs. The water model results in Fig. 7 show the relation between the critical velocity and the water/oil interfacial tension. The experimental results show that, with the increase in the interfacial tension, the critical velocity of entrainment slowly rises, which is similar to the work of other studies. 12,13 For the calculated values of various models, the trends are in agreement. However, the estimated critical velocity of the model of Lei et al. still increases more rapidly than that of other models. 25 The increasing rate of the present model is similar to those of Walker et al. and Tozawa et al. 20,26 However, the value of the present model is slightly higher than the values of Walker et al. and Tozawa et al., which seems to be due to the other models not including the effect of viscous force. 20,26
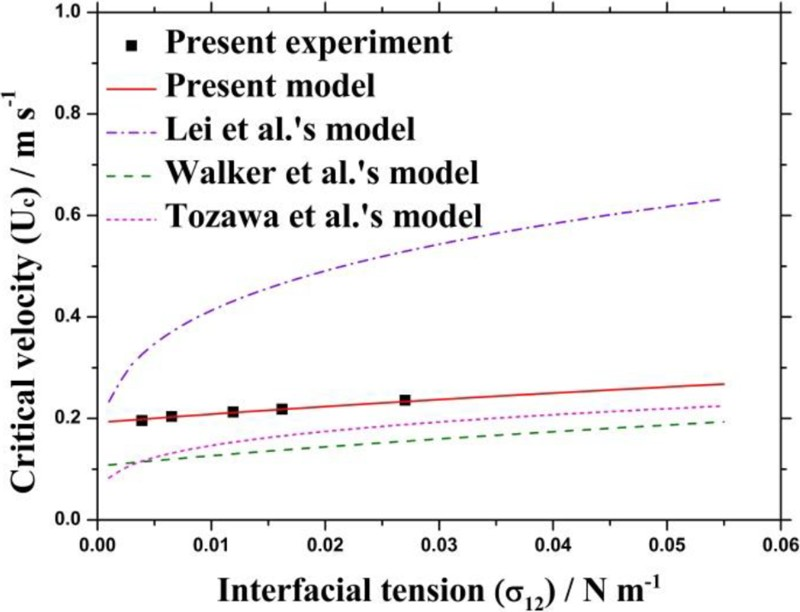
Comparison of effect of interfacial tension on critical velocity between present experiment and different models
Critical velocity of slag entrainment for steel–slag system
Estimated critical velocity for mould powder entrainment
Several kinds of slag and steel were obtained by Hagemann et al., and the thermophysical properties of slags and steels at 1823 K (1550°C) are provided in Table 4 . 29 Fig. 8 shows the critical velocities of various steel–slag systems (Tables 4), calculated by different models. The trends of critical velocity for different steel–slag systems are similar for all models: the critical velocity increases with the increasing viscosity of slag μs and the steel/slag interfacial tension σms, which is in agreement with the results of the water model. However, out of all the given slags in Fig. 8, the value calculated by Hagemann et al. and Lei et al. is higher than that by the other three models. 25,29 The maximal estimated value difference between various slags is 0.29 m s− 1 for the model of Hagemann et al. and that for Lei et al. (∼0.63 m s− 1). 25,29 However, for the other three models based on KHI, the maximal critical velocity difference between various slags is not higher than 0.08 m s− 1– < 20%. According to the measured flow velocity of the molten steel in a continuous mould, which is just 0.3 m s− 1, the latter seems more reasonable.
Thermophysical properties of several kinds of slags and steels at 1823 K (1550°C) 28
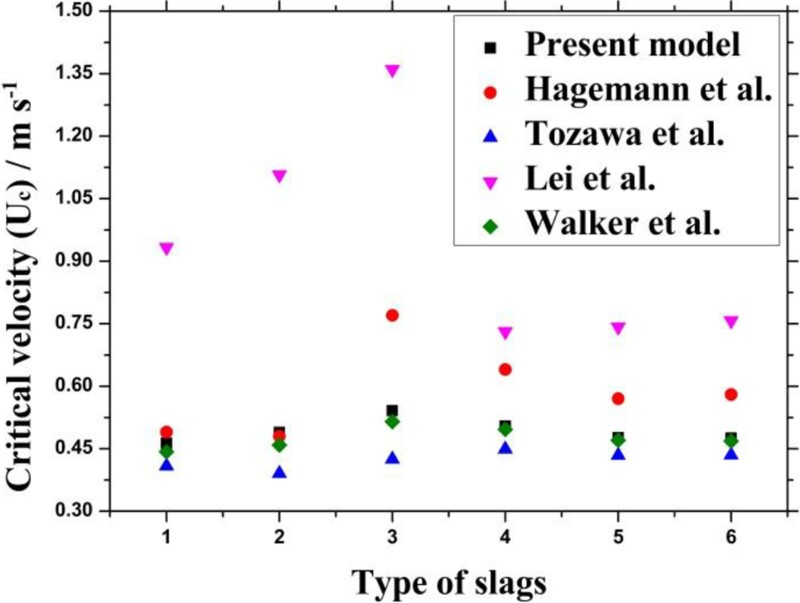
Comparison of estimated critical velocities of various models for steel–slag system at 1823 K (1550°C)
In addition, the critical velocities estimated by the present model and by Walker et al. based on KHI are in good agreement. 20 Although the model of Walker et al. does not take the viscous force into consideration, the effect of the viscosity on the wavelength is taken into account in their model. Without considering the effect of the viscous force of the slag, the value estimated by the model of Tozawa et al. is the lowest. 26
Consideration of chemical reaction of steel/slag interface
In a real casting process, the chemical reaction can reduce the steel/slag interfacial tension. Chung and Cramb found that the content of Ti in the alloys caused a significant decrease in the interfacial tension. 15 For the Fe–11Ti alloy in contact with 40CaO–40SiO2–20Al2O3 slag, the interfacial tension, which can reach 1414 mN m− 1 without a chemical reaction, suddenly decreased to < 50 mN m− 1 at the initiation of the reaction. Consequently, considering the worst serious chemical reaction assumes that the interfacial tensions of all the slags in Table 4 decrease to 1/30 times. The estimated critical velocities of the slags in Table 4 after considering the chemical reaction are shown in Fig. 9. The critical velocities of slags 4–6 estimated by the present model decrease to ∼0.29 m s− 1. These values are below 0.3 m s− 1, which means that slag entrainment may form because of the decrease in the interfacial tension due to the chemical reaction. However, the critical velocities of slags 1–3 are still above 0.3 m s− 1, varying from 0.358 to 0.491 m s− 1. Compared with those without a chemical reaction, the critical velocity difference among slags 1, 2 and 3 seems large. It seems that the effect of viscosity becomes more important when the interfacial tension is low. Hence, it is significant that high viscosity can prevent slag entrainment, especially for low interfacial tension slag.
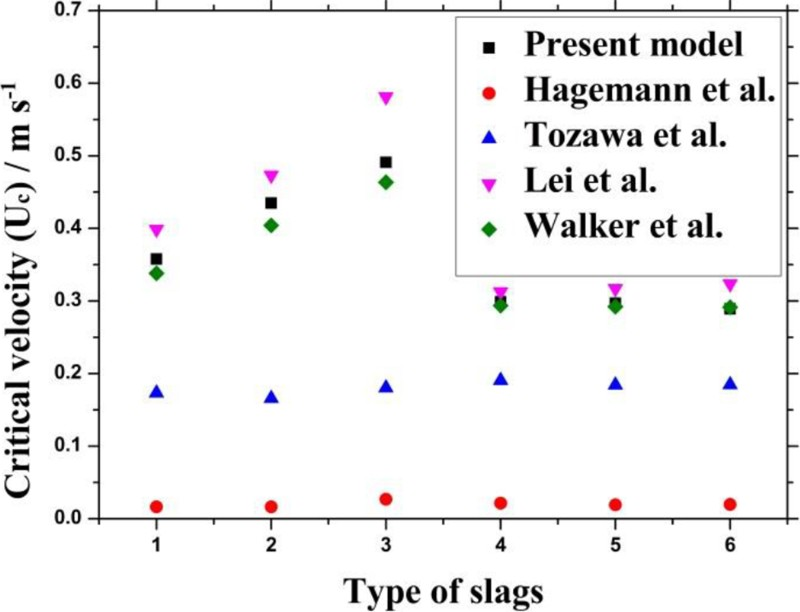
Comparison of estimated critical velocities of various models for steel–slag system at 1823 K (1550°C) after considering decreasing of interfacial tension due to interface chemical reaction
Moreover, the values estimated by the models of Lei et al. and Walker et al. are in good agreement with those of the present model. 20,25 However, contrary to the present model, the critical velocities for different slags calculated by the model of Tozawa et al. nearly descend to ∼0.25 m s− 1. 26 This is mainly because, after the rapid decrease in the interfacial tension, only the effect of the density difference remains, which is nearly the same among different slags. Deduced from experimental data from the water model, the values calculated by the model of Hagemann et al. decrease to ∼0.02 m s− 1, which is not suitable for a steel–slag system in the case of a chemical reaction. 29
Lowest critical velocity for mould powder entrainment
Depending upon different compositions to fit a given steel or casting situation, a wide range of slag viscosity and steel/slag interfacial tension is possible in an actual casting mould. The critical velocity for various viscosities and interfacial tensions estimated by the present model is shown in Fig. 10. The lowest critical velocity for mould powder entrainment is 0.264 m s− 1. Although the viscosity and interfacial tension are 0, there is also a respectable critical velocity due to the stabilising effect of the difference in density. Additionally, if just one of the properties, i.e. the viscosity or interfacial tension, is high enough, slag entrainment will not easily form.
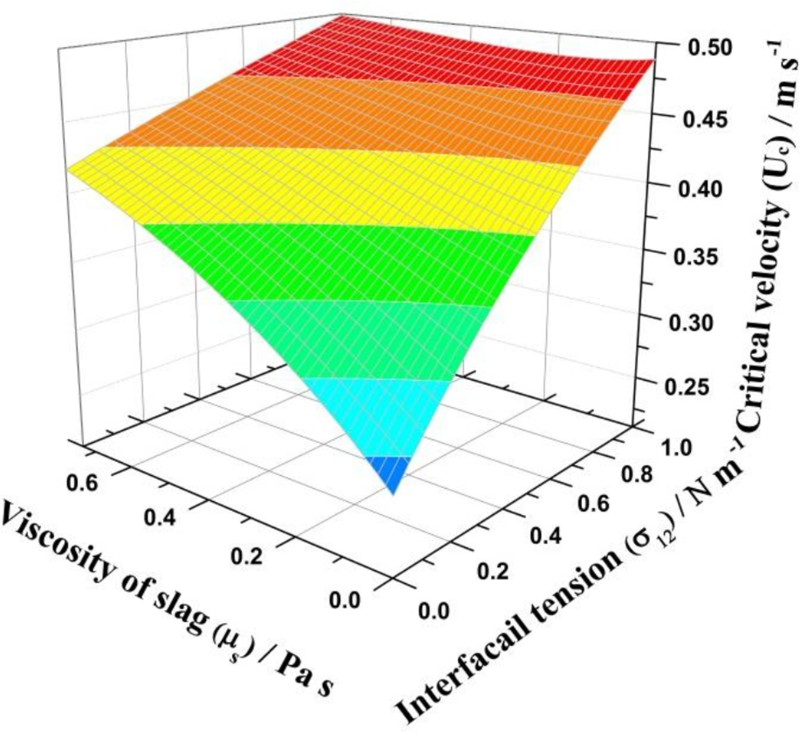
Estimated critical velocities of present models for steel–slag system (ρs = 2530 kg m− 3, ρm = 6953 kg m− 3) at 1823 K (1550°C)
Summary
Based on the kinematic and dynamic boundary conditions and the Bernoulli equation, a viscous KHI model to predict the initiation of interfacial instability in terms of liquid–liquid stratified flow for a finite location was developed. This model was validated by various water–oil experiments. The critical velocity U c (0.184–0.266 m s− 1) for entrainment increased with the increasing viscosity of the light phase μ1 (0.0745–0.403 Pa s) or the increasing interfacial tension of two phases σ12 (0.0039–0.027 N m− 1). The results of the water model were in good agreement with those of the prediction model.
Applying the prediction model to the continuous casting process, the estimated critical velocity of steel flow was approximately 0.463–0.541 m s− 1 for a typical situation. Considering the interfacial tension decrease due to the strongly chemical reaction of the steel/slag interface, the critical velocity of low viscosity slag decreased to 0.29 m s− 1. In this case, the critical velocity was lower than the measured flow velocity of molten steel (0.3 m s− 1) and could lead to entrainment. However, the critical velocity could still remain above 0.3 m s− 1 (0.358–0.491 m s− 1) for high viscosity slag, and entrainment may not occur. In addition, because of the stabilising effect of the density difference, slag entrainment will never form when the flow velocity of steel is below 0.264 m s− 1.