
Abstract
HIsarna technology combines the cyclone converter furnace (CCF) technology owned by Tata Steel and the HIsmelt technology owned by RioTinto. The CCF is mainly a prereduction vessel that prereduces and melts the iron ore particles, while the final reduction to metallic iron takes place in the smelt reduction vessel. The off-gases from the smelt reduction vessel undergo post-combustion in the CCF. Depending on the operating conditions of the HIsarna process, the off-gases may still contain small amounts of unburnt carbon and hydrogen; hence, for process safety and environmental reasons, they are passed through an incinerator that needs to be operated within a temperature window that will guarantee full combustion of the off-gases. In one of the HIsarna campaigns, it was observed that the temperatures in the incinerator dropped significantly during short periods of production. In order to avoid this phenomenon, the HIsarna process can be adjusted to meet the design conditions in the incinerator, but this is not a preferred option. A computational fluid dynamics study of the incinerator was carried out with different compositions of off-gases from the CCF with varying degrees of post-combustion and flowrates, in order to improve its design and operation. The combustion model predicted complete burn out of CO, CH4 and H2 when sufficient air/O2 was injected. The computational fluid dynamics study showed that in all the cases, the flow pattern of the gases remained asymmetric. The temperature in the incinerator was generally higher if natural gas was mixed with the cyclone off-gas and much higher if oxygen was also injected. Modifications to the incinerator layout were recommended. In subsequent HIsarna trials, the new design was successfully implemented.
List of symbols
constants
pre-exponential factor
activation energy
molar fractions
blending functions in the shear stress transport k–ω model
turbulent kinetic energy
rate coefficient
molecular weight of carbon monoxide
absolute pressure
production limiter
products
backward reaction rate
chemical reaction rate
forward reaction rate
universal gas constant
reactants
magnitude of the strain rate
temperature
distance from the field point to the nearest wall
turbulent dissipation rate
kinematic eddy viscosity
density
model constants
shear stress
turbulent frequency
Introduction
HIsarna technology combines the cyclone converter furnace technology developed at IJmuiden Works, The Netherlands, and the HIsmelt technology developed by RioTinto, Australia. A pilot plant based on the HIsarna technology capable of producing 8 t h− 1 hot metal has been set up in the Ijmuiden Works of Tata Steel Europe. The HIsarna has two main parts, namely the cyclone or the cyclone converter furnace and the smelt reduction vessel (SRV), with the cyclone placed atop the SRV.
Crushed iron ore and oxygen are injected into the cyclone through injectors. The oxygen combusts the off-gasses from the SRV and also provides necessary heat to reduce and melt the iron ore. The reduced and molten iron oxide droplets are flung against the wall of the furnace that then fall from the wall into the molten iron bath in the SRV. On the way down, the droplets pass through a second set of heated oxygen injectors and then a set of coal powder injectors. The reduction reaction now continues ‘as normal’ at the bottom of the furnace, with the partially reduced iron ore further reducing to regular pig iron and the whole separating into two molten layers (a top layer of slag and a bottom layer of molten pig iron). 1 Both layers can be tapped individually, and the pig iron can be used immediately in the steelmaking process. In summary, the cyclone prereduces and melts the ore and also post-combusts the off-gases from the reduction vessel, while the SRV reduces the prereduced iron oxides to iron.
The gases along with the dust from the SRV are finally combusted in an incinerator and then are passed through dust collectors and scrubbers and are vented out through a side port. Depending on the post-combustion degree (PCD) of the off-gases in the cyclone, its composition and hence its temperature vary widely. It is required that the temperature in the incinerator remains within an acceptable operational window to ensure its stable operation and also the complete combustion of the gases. During one of the HIsarna campaigns, it was observed that the temperatures in the incinerator dropped significantly during short periods of production. Detailed data analysis showed that high post-combustion in the cyclone resulted in the incinerator receiving less fuel gas from the smelter than expected and hence lower temperatures. The low temperatures in the incinerator could present two worst case scenarios: the fuel components (CO) might not combust fully leading to unwanted emissions in the case of extremely high solid carbon load in the off-gas, explosive mixtures could form and then ignite at a later stage, causing process instability and possible damage to the plant. to investigate flow pattern, mixing and combustion of fuel components in the off-gas to predict the level of combustion in the incinerator to predict the gas concentration at its exit to suggest a safe model of operation of the incinerator particularly for fuel lean off-gas compositions.
To investigate this, a detailed computational fluid dynamics study of the incinerator was carried out. The study was aimed to support engineering and operational decisions under high time pressure rather than aiming for the academically perfect model. It had the following objectives:
A simplified approach was adopted to model the incinerator burner, and the model was tested for its accuracy. Detailed modelling studies were then carried out including all the combustion reactions for different flow conditions.
Incinerator design details
A schematic of the incinerator is given in Fig. 1. The incinerator has three rings of eight air inlet ports (24 in total, each 0.1 m in diameter) positioned at different heights and angles. The positioning of the ports ensures mixing of the off-gases with the injected air/oxygen. Through these ports, a total amount of 10 000 to 45 000 N m3 h− 1 of air can be injected and, if necessary, can be replaced by oxygen. In case the gas mixture is too lean or too cold, a maximum of 500 N m3 h− 1 natural gas can also be mixed with the off-gas, above the cyclone exit.
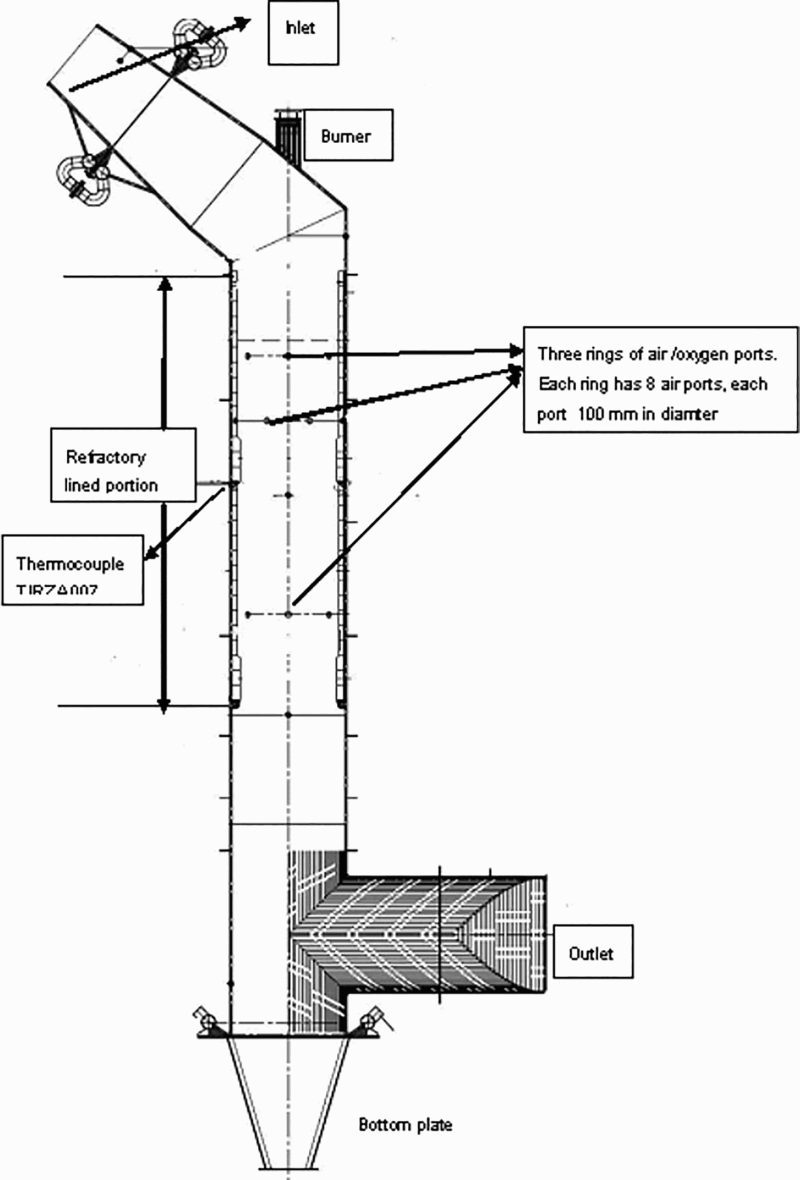
Detailed drawing of incinerator
The vertical part of the incinerator containing the air inlet ports is lined with a refractory that is ∼100 mm thick, but the thickness varies along the height.
A photograph of the incinerator burner is shown in Fig. 2. It is a 2.2 MW natural gas fired burner. Air passes mainly through a central duct, while natural gas flows through eight peripheral tubes around the duct and diffuses out through rectangular slits/holes inclined at an angle. The gas exit has a swirl component to stabilise the flame. The length and diameter of the flame are typically 2.800 and 0.680 m, respectively. The flame has a ‘cigar’ shape, and the flame ignites between 0.05 and 0.1 m from the burner head.
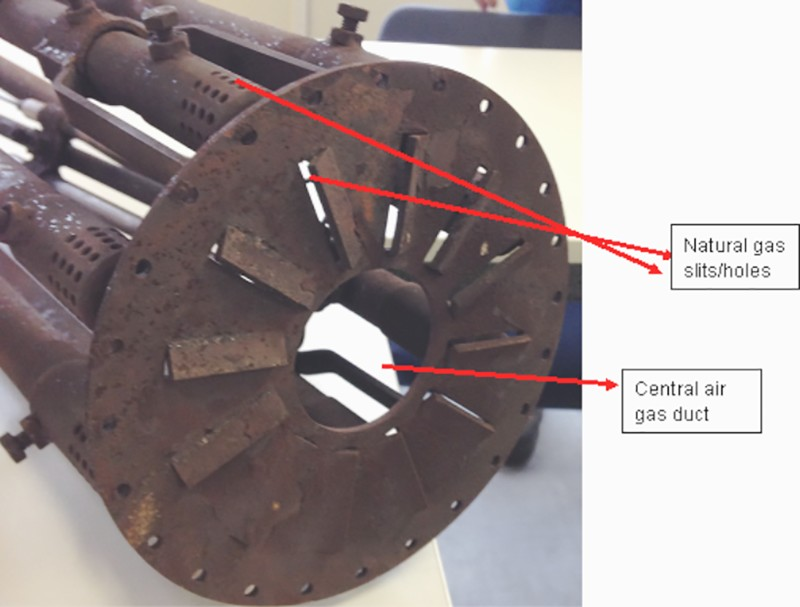
Photograph of incinerator burner
Preliminary modelling studies
Preliminary modelling studies with a simplified geometry (a straight vertical cylinder with a burner in the centre and with one ring of eight ports for air injection) were carried out to determine a suitable chemical/turbulence model and to get as close a flame profile as possible to the actual. Detailed measurements of the burner properties were not available; hence, the authors had to rely on mass flow balances and visual comparison. The number of mesh elements was 5.3 million. The simulations were carried out in steady state.
Assumptions
To simplify the modelling study, the following assumptions were made: in the incinerator burner, the air was assumed to pass through a central opening, while the natural gas was assumed to pass through an annular opening around the central duct; a swirling motion was imposed on the natural gas radiation model was kept as simple as possible, the details of which are explained in the next section for simplicity, a uniform lining thickness was assumed for the refractory part of the incinerator in reality, coal and iron ore dust particles also flow into the incinerator along with the off-gases; this was not modelled uniform flow conditions at the inlet for the off-gases were assumed.
To provide ignition, it was decided that an artificial heat source (a point source) will be used in the flow domain. The specified source was added as a source term to the general scalar equation and was distributed among the vertices of the element/mesh in which the point was located. The number of energy sources was increased gradually from one until the flame developed a full cigar-like structure. It was found that eight point sources, each with a heat input of 10 kW, arranged equidistant from each other in a circular pattern were required to obtain a stable flame in the numerical simulation.
Boundary conditions
The inlet was modelled as a velocity inlet with a uniform velocity profile. The eight air ports in the incinerator were ‘inlets’ for combustion air. The inlet gas composition and flow conditions are given in Table 1. The values correspond to HIsarna operation at 8 t h− 1 hot metal with 89%PCD in the cyclone, which is the designed operating capacity. Two sets of simulations were run: with a combustion air flowrate of 10 000 N m3 h− 1 and with a combustion air flowrate of 45 000 N m3 h− 1.
Inlet conditions of off-gas and combustion air used for preliminary studies
This would be 10 000/45 000, if all 24 ports were run.
For the walls, a ‘no slip’ boundary condition was imposed. For wall heat losses, a heat transfer coefficient was used. The heat transfer coefficient was kept ‘high’ (150 W m− 2 K− 1) in the off-gas duct and ‘low’ (100 W m− 2 K− 1) in the area where the refractory lining was present.
The outlet was modelled as an opening to take into account any potential backward flow/recirculating flow at the outlet.
The flow of natural gas through the burner was maintained at 0.055 N m3 s− 1 or 55 L s− 1 (assuming a calorific value of ∼40 MJ N− 1 m− 3 for the natural gas), and the air flowrate was maintained at 0.55 N m3 s− 1.
Turbulence model
Shear stress transport model
The shear stress transport model was used to model the turbulence. This model is known to give acceptable results for swirling flow and is more economical and numerically stable than using the full Reynolds stress model. It was developed by Menter
1,2
using the standard k–ω model and a transformed k − ε model. The model behaves like a k–ω model near the walls, i.e. solves a turbulence frequency based model at the walls, and as a k − ε model in the bulk of the flow. A blending function is used to allow proper calculation of the near wall and far field areas. This blending function triggers the standard k–ω model in near wall regions and triggers the k − ε like model in areas away from the surface and hence ensures a smooth transition between the two models. The main difference is the way in which the model calculates the turbulent viscosity to account for the transport of the principal turbulent shear stress. The proper transport behaviour is obtained by a limiter to the formulation of the eddy viscosity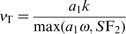
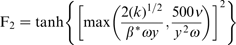
Again F2 is a blending function similar to F1, which restricts the limiter to the wall boundary layer
Note that F1 = 1 inside the boundary layer and 0 in the free stream
Combustion reactions and modelling
The two-step process proposed by Westbrook and Dryer
3
was used to study the combustion of hydrocarbon fuels. Westbrook and Dryer derived one- and two-step global reaction mechanisms for hydrocarbon fuels, which are well known and often used in the industry. In the single step mechanism, the fuel and oxidiser (air) react to give CO2 and H2O. The weakness of the single step mechanism is that by assuming that the reaction products are CO2 and H2O only, the total heat of reaction is overpredicted. To account for this, a two-step model for hydrocarbons was suggested by Westbrook and Dryer,
3
which can be seen below for methane–air gas. The two-step process predicts the formation of CO, which will improve the combustion simulations dramatically, but still ignores the formation of intermediate hydrocarbons

The reaction rate for the fuel combustion was

Kinetic coefficients 3 for two-step reaction mechanism described by equations (7) and (8)
In the CO oxidation reaction, at temperatures above 2100 K, CO2 dissociates back to CO and this reaction rate is dependent on the partial pressures of CO, O2 and CO2. To mimic this condition, an artificial limiting temperature was imposed, a maximum flame temperature of 2100 K, a temperature beyond which combustion of CO would not take place.
The combustion regime in the burner zone varied from partially premixed to non-premixed. To simulate this, various models like the eddy dissipation and finite rate chemistry model were tried. A brief description of the combustion models is given below.
Eddy dissipation model
The eddy dissipation model is based on the concept that chemical reaction is fast relative to the transport processes in the flow. There is no kinetic control of the reaction process. Thus, ignition and processes where chemical kinetics may limit the reaction rate may be poorly predicted. When reactants mix at the molecular level, they instantaneously form products. The model assumes that the reaction rate may be related directly to the time required to mix the reactants at the molecular level. In turbulent flows, this mixing time is dominated by the eddy properties, and therefore, the rate is proportional to a mixing time defined by the turbulent kinetic energy k and the eddy dissipation ε. For the following reaction
The eddy dissipation reaction rate of reaction r
K is determined by the following expression
For the modelled combustion reactions, a value of 1.3 was assigned to A. The reaction rate r K was clipped to a maximum of 2500 s− 1. This model when applied predicted the combustion of gases without an ignition source present, a situation far from reality, since it presumes combustion as soon as the oxidant and the fuel mix at the molecular level and there is no kinetic control of the reaction process.
Finite rate chemistry model
The finite rate chemistry model is best applied to situations where the chemical timescale is rate limiting. This model, as implemented in ANSYS CFX, assumes that the rate of progress of a reaction can be reversible only if a backward reaction is defined. The chemical reaction can be dependent on temperature, pressure, reactant mole fraction, product mole fraction but also on non-reactive components. This model, when applied, produced very slow flame ignition well below the visually confirmed point of ignition.
Combined model
For the combined finite rate chemistry/eddy dissipation model, the reaction rates are first computed for each model separately and then the minimum of the two is used. Hence, while the rate for one step may be limited by the chemical kinetics, some other step might be limited by turbulent mixing.
This model was found to be the best model to simulate the ignition in the burner. The model allowed local flame extinction when the turbulent strain rates were very high and allowed flame development only within a range of turbulent strain rate, at heights 0.05–0.1 m below the point of ignition, which was very close to reality.
Radiation modelling
In the HIsarna off-gas system, the medium is optically dense as a result of the dust load, and radiation interacts with the medium throughout the interior of the domain, as well as at surfaces. The radiant energy is either scattered or absorbed and re-emitted in all directions with a small length scale compared to the size of the domain. To take into account heat transfer through radiation, the P 1 radiation model with a diffusivity factor of 0.2 was used. The model is an attractive option because of its simplicity. It is well suited for optically thick media like the one that exists in the HIsarna, which is filled with particles, the majority being fine iron oxide particles.
The radiation intensity in the P
1 model is expressed as a Fourier series that is a variable separated into a function depending on coordinates and another on the direction as follows


Analysis
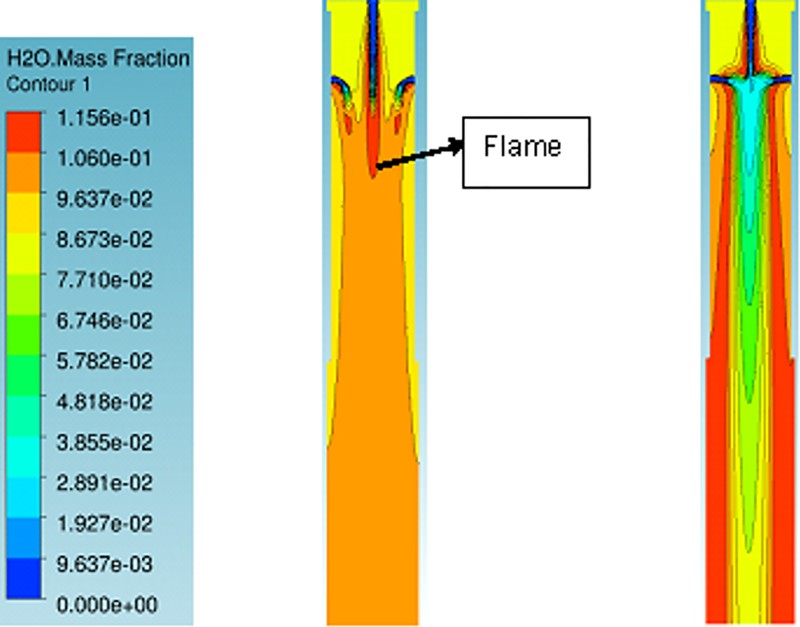
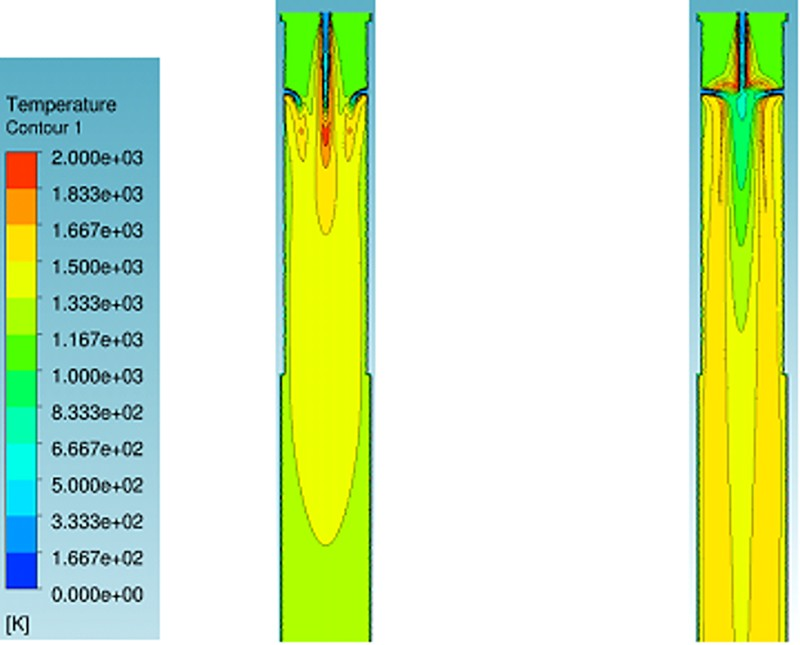
The results from the preliminary model are shown in Figs. 3–5: from the CO contour in Fig. 6, it can be seen that when the combustion air flowrate was 3333 N m3 h− 1, the combustion was incomplete; there is still some residual CO present; this is because the amount of combustion air is stoichiometrically insufficient for the complete combustion of CO when the combustion air flowrate was raised to 5000 N m3 h− 1, there was complete combustion of off-gases (Figs. 3 and 4); the very high air flowrates distorted the flame, however the flame profile was close to a cigar shape and was well developed (Fig. 4) the temperature contour (Fig. 4) showed higher temperatures with more combustion air, as expected the model could predict the shape of the flame and the combustion of the off-gases with a reasonable degree of accuracy.
H2O contour at two different air flowrates: (i) 3333 and (ii) 15 000 N m3 h− 1
Temperature contours at two different air flowrates: (i) 3333 and (ii) 15 000 N m3 h− 1
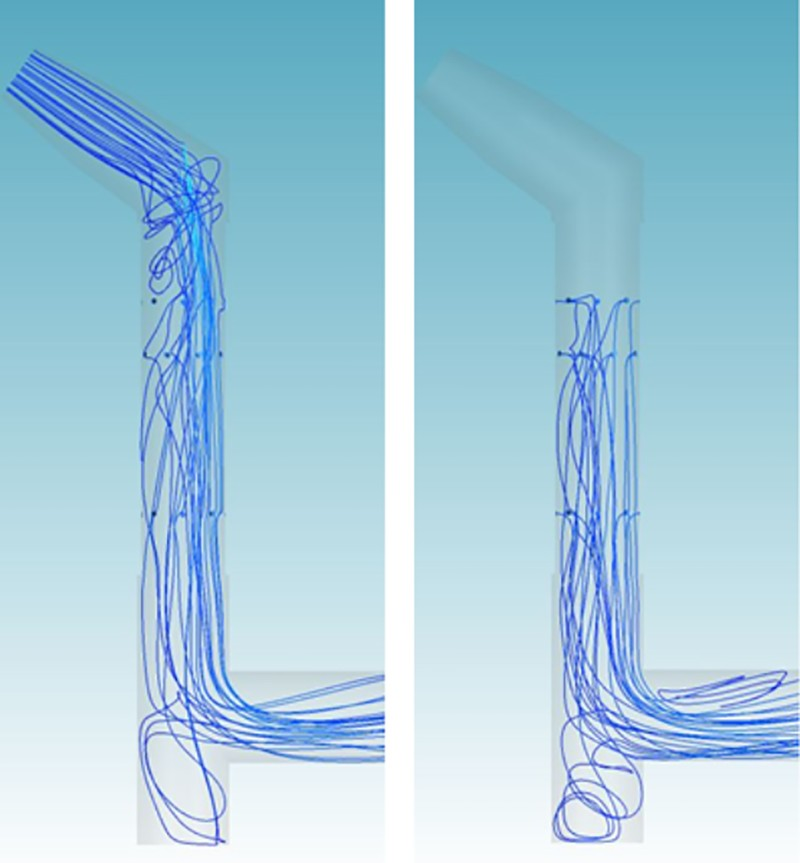
Streamlines showing flow of off-gases (left) and combustion air from incinerator ports (right) for case 1
CO contour at two different air flowrates: (i) 3333 and (ii) 15 000 N m3 h− 1
Detailed modelling studies
To study the interaction of the ignition burner and the fuel lean HIsarna off-gas, the model was then extended to include the skewed off-gas section upstream of the incinerator burner. It also included three combustion air inlet rings with eight combustion air inlet points each. Two opposite inlet points of the top ring were selected as potential oxygen inlet points. High density mesh regions were created at the incinerator and near the air ports. Simulation on a grid of eight million cells took ∼30 h to reach steady state.
The composition of natural gas used in the study is shown in Table 3 and was a mixture of methane, ethane and propane. The two-step process proposed by Westbrook and Dryer 3 with the reactions of ethane and propane with oxygen to form CO and H2O and the subsequent combustion of CO to CO2 were considered. The value of the coefficients used in the rate expressions are given in Table 2.
Composition of natural gas used in simulation
The remaining components, i.e. the C4 and C5 species, were included as part of CH4 in the simulations.
The boundary conditions were the same as mentioned above, except for the inlet flowrates and temperatures.
Three different compositions of off-gas/natural gas/air combinations were identified, the details of which are given in Table 4. The conditions were commanded by what was possible on the plant at short notice and what could be calculated in a limited time frame. Lack of experimental data caused by limited access to the incinerator during operation also dictated the conditions that could be studied.
Inlet conditions for air and off-gases used in simulation
Extra natural gas mixed with off-gas.
The off-gases in all the cases were assumed to have a high PCD of 90%. In cases 1 and 2, the flowrate of off-gases was high corresponding to the maximum designed capacity of 8 t h− 1 hot metal production. In the former case, there was no natural gas or oxygen injection, while in the latter, air was passed through 22 ports and O2 through two ports in the incinerator. The reason for injecting oxygen along with air was given as follows: if the off-gas is very lean, the generated heat is small and the flame may be quenched by too much cold air. In that case, pure oxygen may help to boost the flame temperature and reduce the quenching effect. A ‘worst case’ scenario was studied as case 3. In this case, lean off-gas corresponding to low hot metal production of 4.55 t h− 1 was used. High PCD off-gas/lean off-gas was mixed with natural gas; air was passed through 22 ports in the incinerator and O2 through two of the upper ring ports. To inject the oxygen effectively with good mixing, the inlet ports for oxygen were made smaller in diameter (0.05 m) when compared to the inlet ports for combustion air (0.1 m). In addition, an air flowrate of 3000 N m3 h− 1 was passed through the bottom of the incinerator to mimic the ‘air ingress’ at the bottom that occurs in the plant. A heat flux of 2 kW m− 2 was assumed in the refractory area.
Analysis
Streamlines
The velocity streamlines for the three cases are shown in Figs. 5, 7 and 8. The off-gas streamlines showed clear recirculation zones at the bottom and at the top. In case 3 (Fig. 7), the air from the incinerator ports moved upwards to the burner and started to recirculate. This could be due to the low pressure zone existing in these regions, allowing the air to be drawn upwards for recirculation. These recirculation zones could be potential zones for recirculation of particles that might be carried off with the gas. In addition, the oxygen from the two opposite oxygen ports penetrated deeper into the centre of the incinerator, thus resulting in better mixing of the oxygen and the gases. This could be because of higher velocity due to the smaller diameter holes.
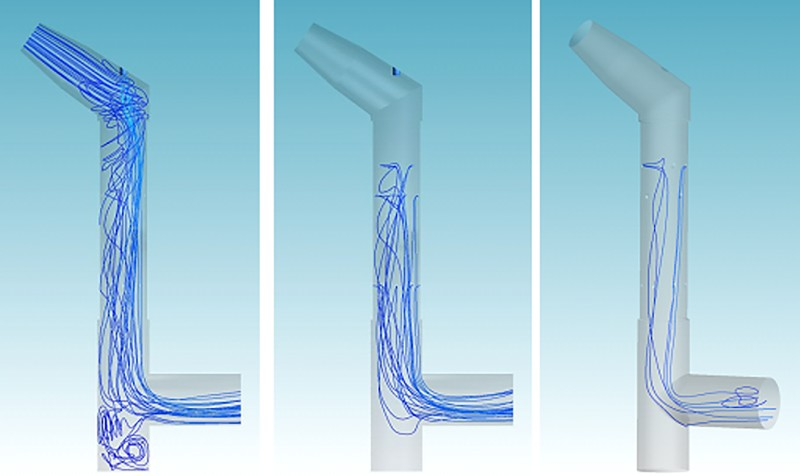
Streamlines showing flow of off-gases (left), combustion air (middle) and oxygen from incinerator ports (right) for case 2
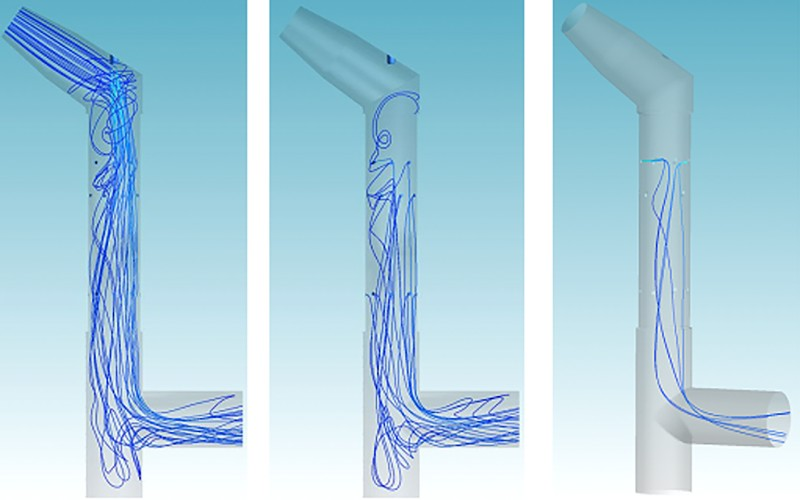
Streamlines showing flow of off-gases (left), combustion air (middle) and oxygen from incinerator ports (right) for case 3
Gas compositions
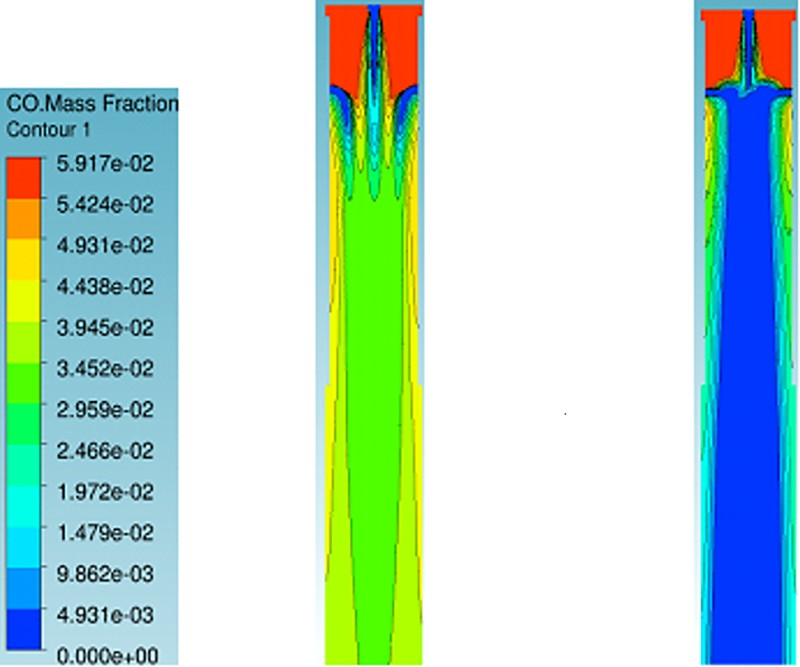
Figures 9–11 show the contours of CO, H2 and CH4 for the three cases. In all the cases, the gases showed complete combustion of CO and H2 and CH4 in the incinerator. The CO2 mass fraction decreased over the length of the incinerator due to higher N2 input from the air injected. The mass fraction of oxygen varied between 5 and 12% in the outlet depending on the composition of the inlet gas.
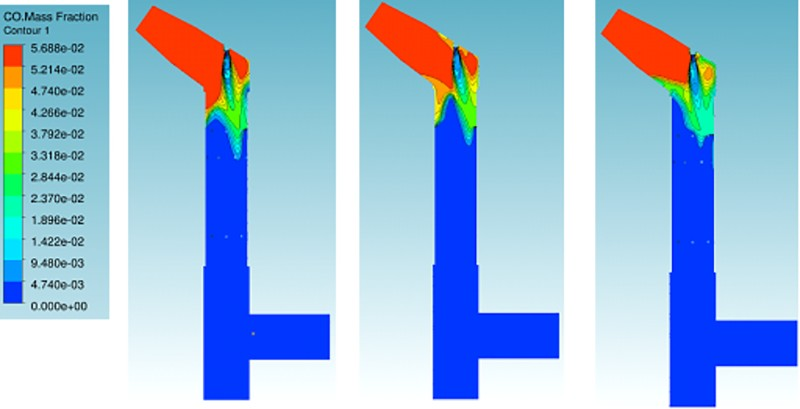
Contours of CO mass fraction for cases 1–3 (left to right)
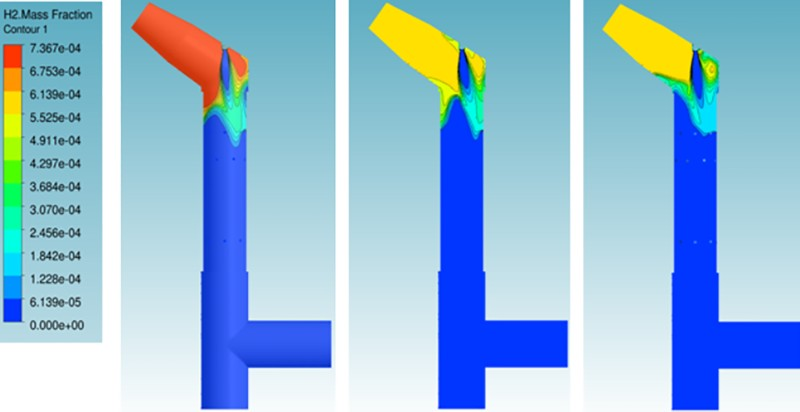
Contours of H2 mass fraction for cases 1–3 (left to right)
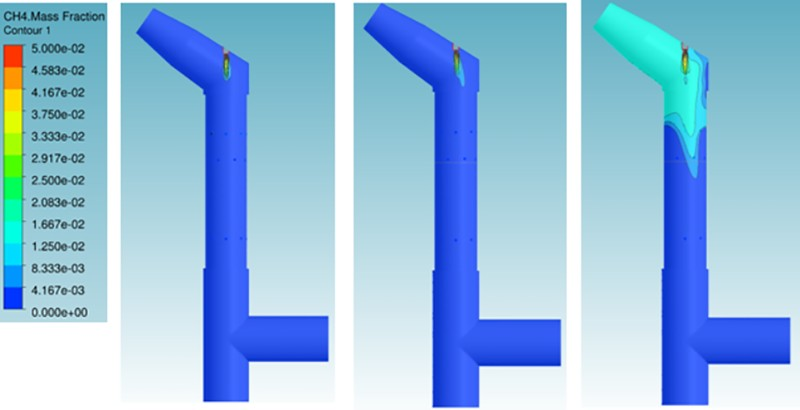
Contours of CH4 mass fraction for cases 1–3 (left to right)
For case 3 (Fig. 11), the mass fractions of CO2 and H2O were zero at the bottom due to air injection. The air ingress also appeared to pull the gases more towards the side outlet.
Velocity
In all the cases, the velocity contours showed a high velocity jet impinging on one side of the incinerator wall (Fig. 12). High temperature jets impinging on one side of the refractory wall for long periods could affect the refractory in the long run.
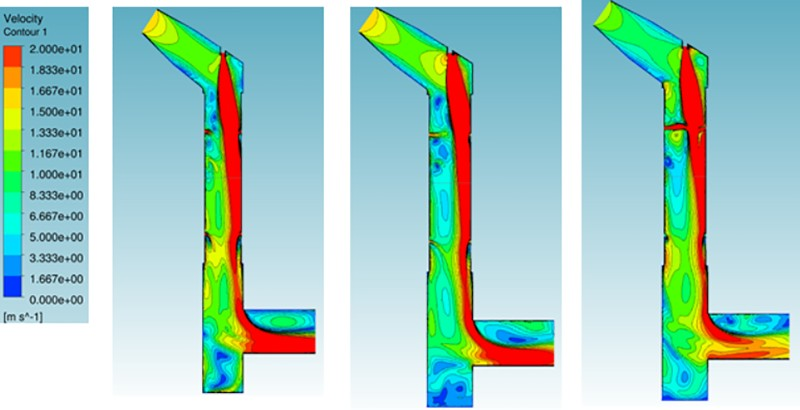
Contours of velocity (magnitude) for cases 1–3 (left to right)
Temperature
The temperature varied from 800 to above 2000 K close to the incinerator burner (Fig. 13). The temperature inside the incinerator progressively increased with the replacement of air with oxygen and subsequently lesser diameter oxygen ports. The temperature in the bulk of the incinerator was higher by 200 K when the diameter of the oxygen inlets was reduced to 0.05 m. The presence of more oxygen and natural gas mixed with the off-gas in case 3 were responsible for higher temperatures in the incinerator. The smaller diameter of the ports also ensured better mixing due to more oxygen flow in the middle of the incinerator and hence better combustion.
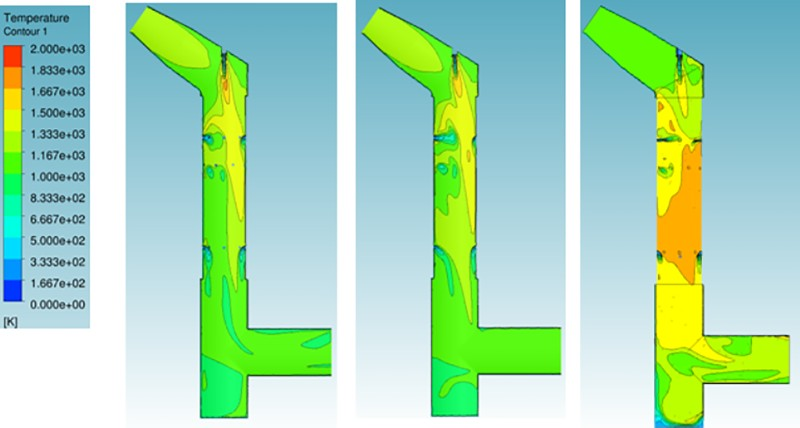
Contours of temperature for cases 1–3 (left to right)
The results clearly showed that under all conditions, the off-gases will undergo full combustion in the incinerator. Risk of accumulation of potentially unburned particles or off-gas components will be higher at higher metal production rates. When highly post-combusted off-gases pass through the incinerator, it will be best to mix the off-gases with natural gas and replace two air inlets with 0.05 m diameter oxygen inlets. This will ensure complete mixing and combustion of off-gases and also higher incinerator temperatures.
Following the study, during the subsequent HIsarna trials, the diameter of two of the eight inlet ports in the upper ring of the incinerator was reduced from 0.1 to 0.05 m. Natural gas was mixed with the off-gases from the HIsarna SRV; combustion air was injected through the 22 ports, while oxygen was injected through the two smaller diameter ports. This ensured that the temperature in the incinerator remained in the acceptable range, irrespective of the composition of the off-gases from the cyclone.
Conclusions
A computational fluid dynamics combustion model was developed for the HIsarna off-gas incinerator. It was initially validated with a simplified incinerator design using crude empirical observations at the HIsarna pilot plant. The model was then extended to study the combustion in the full scale incinerator. The studies showed that from a number of options, it would be best to use natural gas mixed with the off-gases from the HIsarna cyclone and also to introduce pure oxygen through two smaller diameter ports along with combustion air from other ports to ensure higher temperatures in the incinerator. In accordance with the study, necessary modifications were made in the incinerator layout and the design was successfully implemented at the HIsarna pilot plant.
Footnotes
Acknowledgements
The authors are grateful to the HIsarna pilot plant production team for their support in data collection. The authors are also thankful to Dr C. Treadgold of RD&T, Tata Steel Europe and M. Davis and R. Dry of RioTinto for their guidance during the work.