
Abstract
Thermodynamic calculations and thermogravimetric (TG) analysis were performed in order to understand the mechanism of carbon deposition on the surfaces of iron particles during the reduction of iron ore in a CO–CO2 atmosphere. The results of the thermodynamic equilibrium phase analysis indicate that the phases of the carbon deposition process can be predicted on the basis of the carbon potential, reaction temperature and gas pressure. The optimal thermodynamic conditions for carburisation are a low temperature (T < Tm) and a high carbon potential (αc>1). TG analysis is performed in a gas mixture of 65 vol.-% CO and 35 vol.-% CO2 at 650, 706 and 750°C. Cementite (Fe3C) is generated as an intermediate product, which acts as a catalyst for carbon deposition. Carbon deposition is inhibited at high temperatures (T>791°C) owing to the high stability of Fe3C. When the reaction temperature is higher than the thermodynamic limit for the formation of Fe3C, carbon deposition cannot occur. A mechanism for carbon deposition is proposed based on the experimental results.
Introduction
Gas based direct reduction of iron ore is a promising route to decrease the carbon dioxide emissions in the iron and steel industry. The results of theoretical calculation and production practice prove that carbon dioxide emission of a shaft furnace is far lower than that of the blast furnace. 1–2 In the shaft furnace reduction process, CO decomposes as (2CO = C + CO2) on the surfaces of reduced iron at temperatures of 400–900°C and at high carbon activities (αc>1). 3–6 The deposited carbon can fill in the pores and voids of the iron particles, generating internal stress and decreasing their strength. As a result, the iron particles are broken down and the furnace gas channels can become blocked.
Numerous efforts have been made to understand the mechanism of carbon deposition on the metallic iron particle surface. 7–15 Snoeck et al. 7 proposed that the driving force of carbon diffusion is the difference of carbon solubility between the gas/metal interface and the metal/carbon interface. Zhang et al. 8,9 studied this process with iron in a CO–H2–H2O gas mixture at 700°C and found that when a gas mixture with low (e.g. 5%) CO content is used, both α-Fe and Fe3C are detected. When the CO content increases to more than 30%, Fe3C is the only iron containing phase observed. Turkdogan and Olsson 10 and Fruehan 11 claimed that metallic iron is the active phase during CO decomposition. However, some researchers have suggested that Fe3C acts as the catalyst for the dissociation of CO. 12–14 Therefore, whether Fe or Fe3C serves as the catalyst for carbon deposition remains to be determined.
In the present study, the effects of carbon potential and reaction temperature on carbon deposition were investigated both thermodynamically and experimentally. The equilibriums at the metal/gas and metal/carbon interfaces were taken into account. Based on this, a mechanism of carbon deposition on iron surfaces is proposed.
Thermodynamic analysis
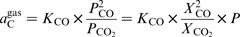
In a CO/CO2 gas mixture, the main carburisation reactions are expressed as reactions (1) and (2):

Using graphite as the standard state (


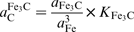


The thermodynamic calculations were performed using the software programme HSC Chemistry 6.0. The carbon potential in the CO/CO2 gas mixture was determined as a function of the gas composition, reaction temperature and total pressure, as shown in Fig. 1. The dotted lines represent the gas mixture with different CO/CO2 ratio and total pressure. Defining T
0 as the temperature where 


Dependence of carbon potential on gas composition, temperature and total pressure
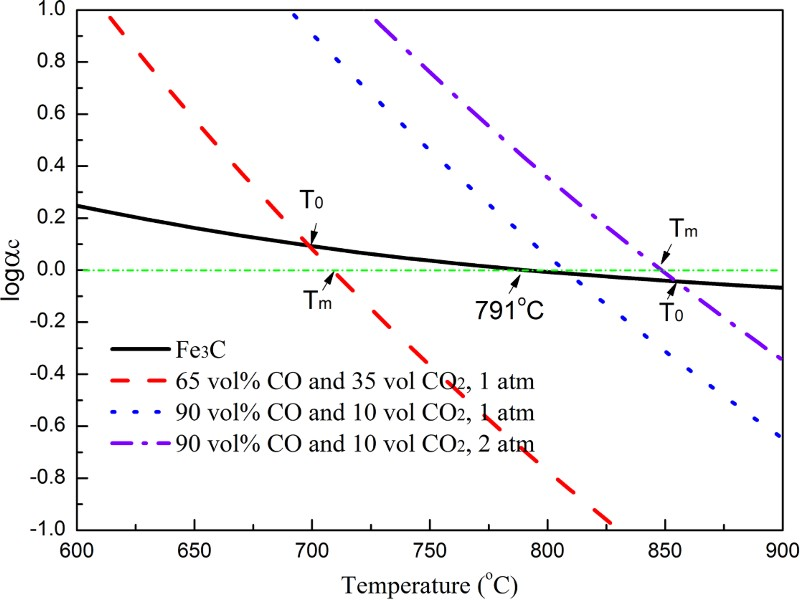
As shown in Fig. 2, the T 0 and T m values of the gas mixture (65 vol.-% CO and 35 vol.-% CO2) are 698 and 709°C respectively. The equilibrium temperature for Fe/FeO in the gas mixture is 831°C; the hatched areas represent the stable temperature regions for Fe and FeO. Three zones (A, B and C) can be differentiated on the basis of the T 0 and T m values. Various combinations of the carbon potential and temperature can be predicted thermodynamically, as shown in Table 1. In zone A, the carbon potential of the gas phase is higher than the thermodynamic limit for the formation of Fe3C. The gas phase provides adequate carbon for iron to form Fe3C. Consequently, the stable product of iron is Fe3C, and the excessive carbon is present in the form of graphite. In zone B, the carbon potential of the gas phase is lower than the thermodynamic limit for the formation of Fe3C. The iron phase is saturated with the dissolved carbon. In zone C, the carbon potential of the gas phase is less than unity, and the carbon dissolves in iron, forming an Fe–C solid solution.
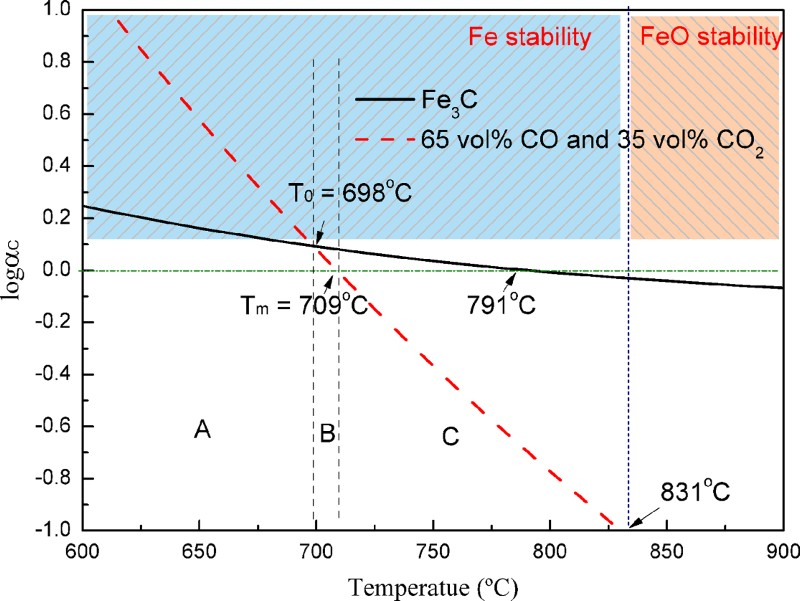
Different temperature zones for carburisation in 65 vol.-% CO and 35 vol.-% CO2 gas mixture
Thermodynamic prediction of carbon deposition based on Fig. 2
Experimental
Instruments
A thermogravimetric (TG) analyser (Cahn TherMax 700, Thermo Cahn Inc.) was employed as a flow microreactor for the in situ monitoring of weight changes in the test samples. The test sample was placed in an alumina crucible, which was hung in the TG analyser with silica hooks. The gas flowrate was fixed at 100 mL min− 1; the gas was purged into the TG analyser from the bottom of the furnace.
Materials
The composition of the iron ore sample used in the experiments is given in Table 2. After the milling and screening of the ore, a fine powder with particles smaller than the mesh size of a #80 mesh sieve was obtained and used. The weight of the sample was ∼150 mg. This amount of sample can cover the bottom of the crucible with a thin layer during TG experiments, thus ensuring good mass and heat transfers of gas–solid reactions in the experiments.
Composition of iron ore powder used in this experiment/wt-%
Pre-reduction
During the CO reduction process, carburisation may occur simultaneously with reduction. 16 Therefore, in order to clarify the mechanism of carbon deposition, the iron ore powder was pre-reduced in pure hydrogen at 800°C for 30 min. The reduced iron was cooled to room temperature and purged with argon gas for 1 h to remove the hydrogen gas adsorbed on the surfaces of the ore particles. Then, the completely reduced iron was used in the carburisation experiments.
Carbon deposition
The reduced iron was heated to the target temperature in argon gas at a rate of 10°C min− 1. Then, the gas mixture (65 vol.-% CO and 35 vol.-% CO2) was introduced into the reaction area. Based on the results of the thermodynamic analysis, the temperatures were chosen to be 650, 706 and 750°C. After the sample was held at the selected temperatures for 1 h, the fluidising gas was switched to argon, and the furnace was cooled to room temperature.
Characterisation
The crystal phases of the samples were determined by X-ray diffraction (XRD) analysis, performed on a Rigaku D/Max-2550 diffractometer using Cu K α (λ = 0.15418 nm) radiation operated at a voltage of 40 kV and a current of 40 mA. The morphologies of the samples were examined by scanning electron microscopy (SEM) performed on a HITACHI SU-1510 microscope and by transmission electron microscopy (TEM) on a JEM-2010F microscope.
Results and discussion
Carbon deposition in CO/CO2 gas mixture
The weight changes during carburisation at different temperatures are shown in Fig. 3.The results show that carbon deposition occurs at 650°C, with the weight gain being 7.85%. The weight gain is higher than the weight change corresponding to the transformation of Fe into Fe3C (7.14%), which means that the deposited carbon coexists in the obtained product. The result is further confirmed by the XRD analysis, as shown in Fig. 4. Diffraction peaks related to Fe3C and graphite are detected when the reaction temperature is 650°C. When the carburisation temperatures are 706 and 750°C, no obvious weight changes are observed from the TG curves. Correspondingly, peaks related to only α-Fe are detected in the XRD pattern.
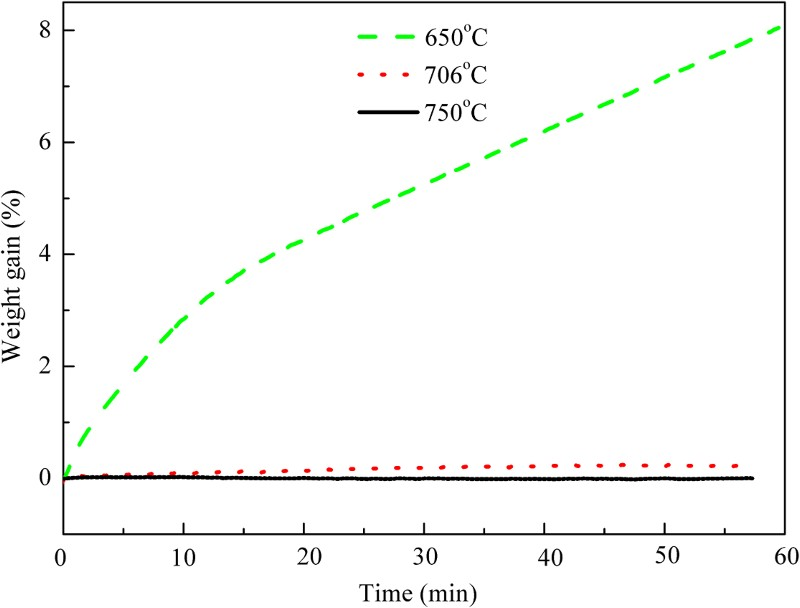
TG curves of carburisation processes at different temperatures with gas mixture of 65 vol.-% CO and 35 vol.-% CO2
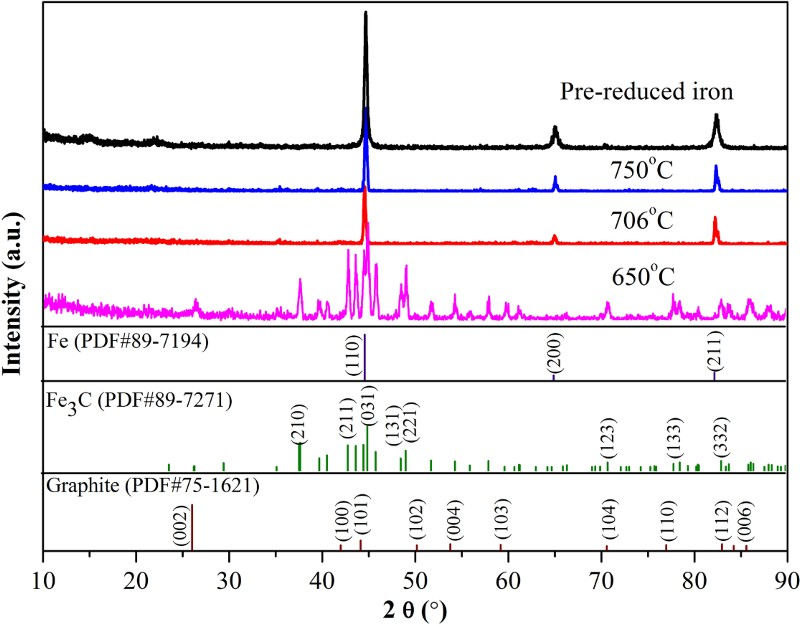
XRD patterns of pre-reduced iron and carburisation products obtained at different temperatures
The iron particles obtained at 706 and 750°C are well shaped with distinct boundaries, as shown in Fig. 5. In contrast, the sizes of the Fe3C particles generated at 650°C are smaller. The breaking process can be observed at the outer layer of the iron particles (Fig. 5b ). Furthermore, nanometre sized Fe3C particles occur on the particle surfaces, and some of the Fe3C particles are wrapped in the fluffy graphite, as shown in Fig. 6.
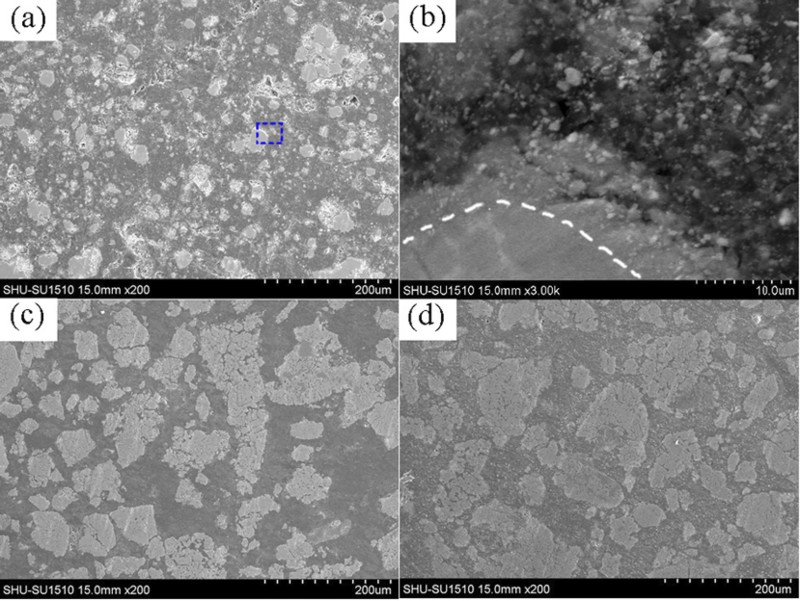
SEM images of carburisation products obtained at different temperatures: a 650°C; b high magnification image of area selected in (a); c 706°C; d 750°C
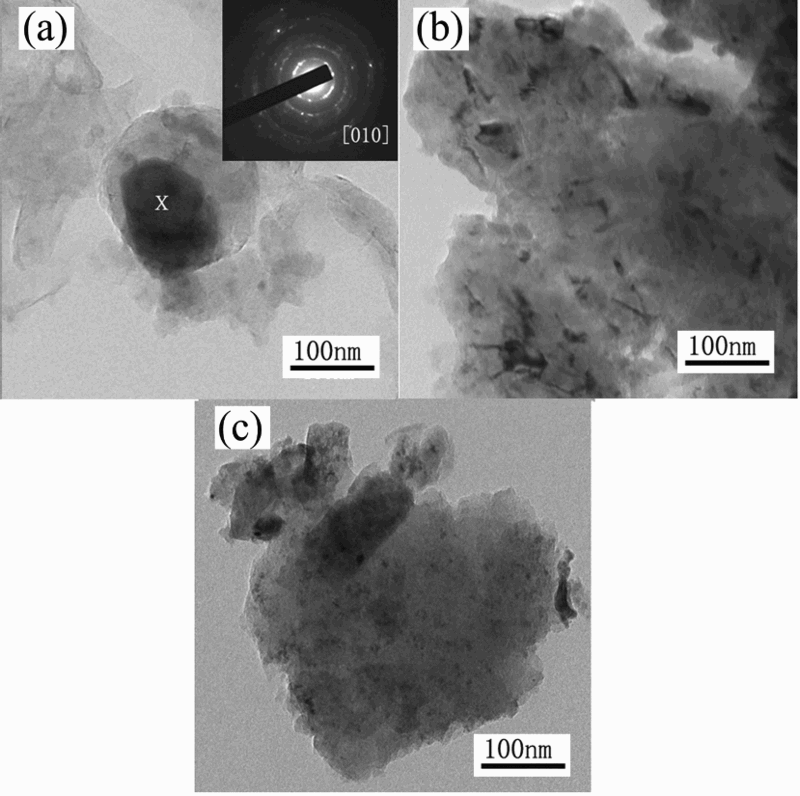
TEM images of carburisation products obtained at different temperatures: a 650°C (inset shows diffraction patterns of marked Fe3C particles); b 706°C; c 750°C
Effects of carbon potential on carbon deposition
The driving force for carbon diffusion is the differences in the carbon solubility at the gas/metal and metal/carbon interfaces. The solubility of carbon in iron changes with the carbon potential of the gas mixture used and the reaction temperature. The Fe–C phase diagram (Fig. 7) shows the phases corresponding to the different combinations of the carbon content and reaction temperature. The solid lines represent equilibrium with graphite, while the dotted lines represent equilibrium with Fe3C. At 727°C, the highest solubilities of carbon in ferrite (α-Fe, which is body centred cubic) and austenite (γ-Fe, which is face centred cubic) are 0.022% and 0.77% respectively. At 750°C, the carbon potential increases with the increase of the solubility of carbon in the α-Fe phase. In the α+γ zone, α-Fe and γ-Fe are in equilibrium, with αA1 = αB1 = 0.80 [calculated using Pandat 7.0 (demo version)]. At the intersection of the boundary line (point C), the carbon potential of γ-Fe is in equilibrium with graphite (αC1 = 1). In the γ-Fe + C/Fe3C zone, the carbon potential is equal to unity.
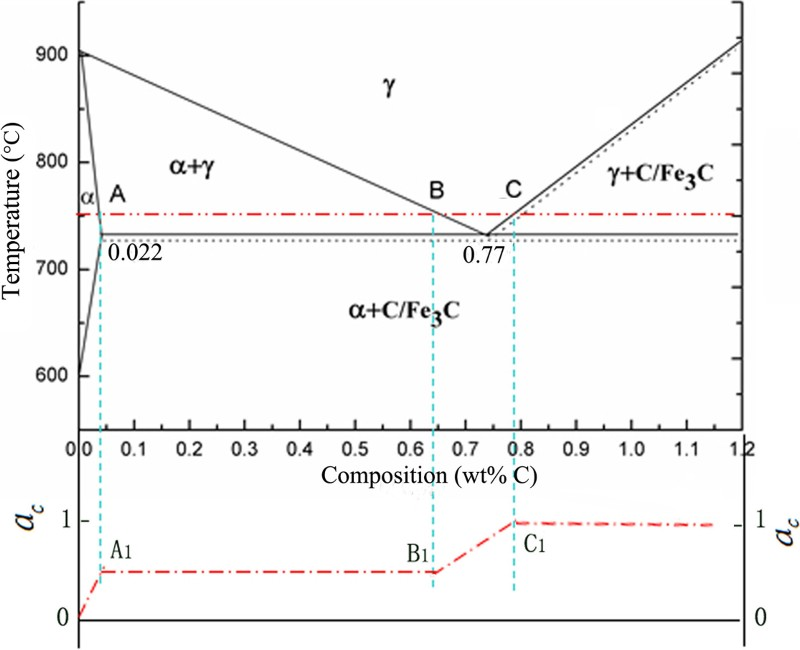
Schematic diagram showing carbon potential change of iron at 750°C
The phases of the carbon deposition process can be predicted under the equilibrium conditions on the basis of the carbon potential of the gas mixture and the reaction temperature. The carbon potential of the gas mixture (65 vol.-% CO and 35 vol.-% CO2) and Fe3C can be calculated using equations (3) and (4) respectively. The carbon potential of gas (


Mechanism of carbon deposition on iron surfaces
The results of the thermodynamic calculations and the TG analyses show that the phases of the carbon deposition in the CO/CO2 gas mixture change with the carbon potential of the gas mixture and the reaction temperature. The carbon deposition process on an iron surface includes the following steps: Adsorption of gas on the iron surfaces. Carbon diffusion in iron Chemical reaction at the metal/carbon interface Schematic diagram showing change in carbon potential on iron surface Desorption of gas products from the iron surfaces
In a CO atmosphere, the species strongly adsorbed on the iron surfaces are O, CO and C. Fruehan
11
verified that the rate controlling reaction in the CO–He gas mixture is the formation of the activated complex. The gas adsorption process can be expressed by reactions (5)–(8), where □ is the vacant site where adsorption takes place.


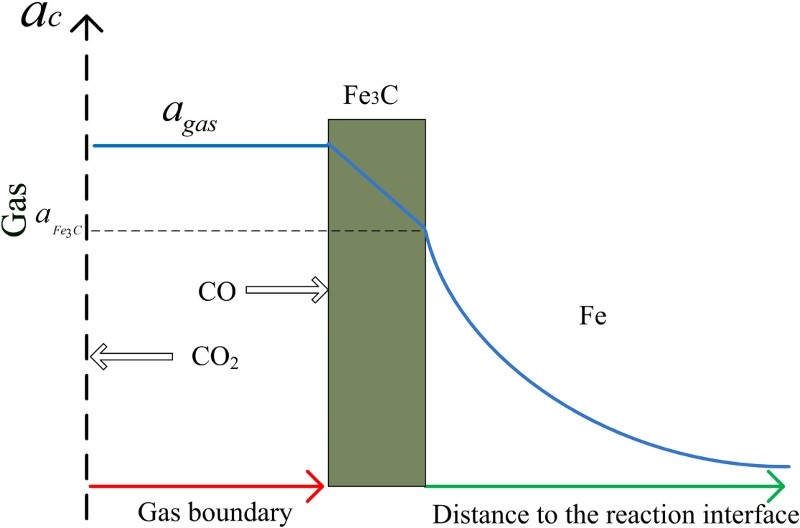
Thermodynamically, the driving force for diffusion is the difference in the chemical potentials of the different phases or different positions. In a metal matrix, the carbon potential decreases with an increase in the distance to the reaction interface, as shown in Fig. 8. Baker
19
measured the carbon deposition rates for different metals such as Ni, α-Fe, Co, V, Mo and Cr and suggested that the critical parameters involved in the carburisation process are the solubility and the diffusion rate of carbon in metals.

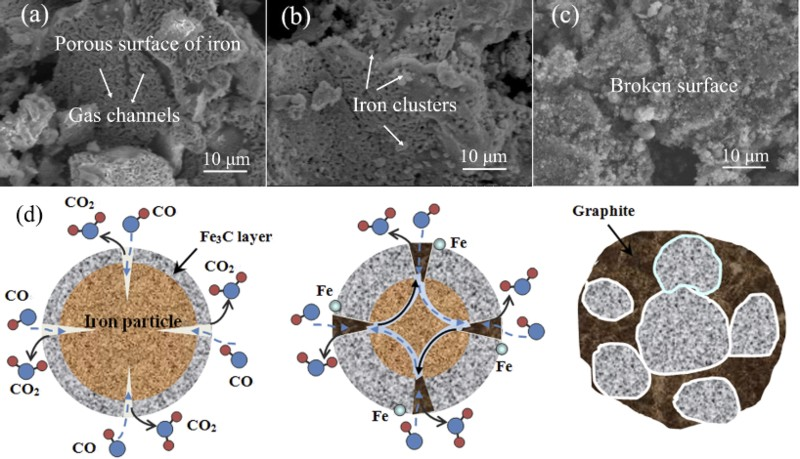
SEM images of a surface of porous iron reduced at 800°C in H2; b iron clusters on surface; c broken surface; d schematic showing breaking of iron particles during carbon deposition
Conclusions
Based on the carbon potential equilibrium phase diagram, the carbon deposition process can be predicted from the carbon potential of the gas mixture, the reaction temperature and the total pressure. The TG analysis demonstrates that carbon deposition occurs preferentially at a low temperature (T < T m) and a high carbon potential (αc>1). When temperature is higher than 791°C, carbon deposition cannot occur. Fe3C is formed as intermediate product during carbon deposition and accelerates the rate of carbon precipitation. The recycling reaction of Fe3C produces a large amount of graphite on the surfaces of the iron particles. The mechanism underlying the breaking of the iron particles during the carbon deposition process is proposed and discussed.
Footnotes
Acknowledgements
The authors thank the National Key Basic Research Program of China (973) (grant no. 2014CB643403) and the National Natural Science Foundation of China (grant nos. 51304132 and 51225401) for financial support.