
Abstract
The flow behaviour and processing map of a duplex stainless steel were studied via hot compressive tests in a temperature range of 1223–1473 K and a strain rate range of 0.01–30 s− 1. The effect of strain rate and temperature on the hot workability, strain partitioning and dominant flow behaviour of the alloy was systematically investigated. It is found that the softening mechanism of each constituent phase differs from each other. The ferrite is softened by dynamic recovery and continuous dynamic recrystallisation (CDRX), while the austenite is softened only by the limited discontinuous dynamic recrystallisation (DDRX). At lower strain rates (0.01 and 0.1 s− 1), the strain is mainly accommodated by ferrite due to its excellent softening capability, which causes the apparent activation energy Q p to decline continuously with the increase in true strain. In this case, plastic deformation of the austenite rarely occurs, and at this time, DDRX of austenite is not observed. When the strain rate increases, CDRX of ferrite is weakened at a relative low temperature, which prompts the strain transfer into austenite and induces the strain hardening due to its restricted softening. Accordingly, interactions between the strain hardening in austenite and weakened softening of ferrite leads to one or more platforms of Q formed at the medium stage of deformation (1–30 s− 1). The processing map shows that two flow instability regions appear at high strain rate due to the lack of sufficient response time for dynamic restoration at the early deformation stage. As the strain increases, dynamic softening mechanism is activated at a higher temperature, resulting in a gradually narrowed flow instability region. Differently, a decrease in temperature suppresses dynamic softening of the alloy with a high strain rate, which deteriorates the hot workability of the alloy and induces microcrack formation after straining of 0.8.
Introduction
Duplex stainless steels (DSSs) possess excellent combination of mechanical properties, stress corrosion resistance and good weldability, and have been considered as the alternatives to single austenitic and ferritic stainless steels in many industrial fields. 1–3 It is well known that the excellent property of DSSs relies on a duplex microstructure comprising approximately equal proportion of austenite and ferrite phases. Generally, the flow behaviour and microstructural evolution of austenite and ferrite during hot deformation differ greatly from each other. For ferrite, dynamic recovery (DRV) is easily activated because the high stacking fault energy can result in the relative ease for dislocation to climb or cross-slip. In contrast, austenite undergoes a limited DRV, and the dynamic recrystallisation (DRX) will not take place until the critical strain is reached. 4–8 When a duplex microstructure deforms jointly, the hot workability of the alloy is severely affected by the flow behaviour of each constituent phase. It is found that a strain partitioning is often caused due to the coexistence of austenite and ferrite during hot deformation. 3,4 In this regard, this incoherence containing thermal expansion coefficient and flow response mechanism between the two constituent phases easily reduces hot workability of the alloy and then leads to the formation of defects on the surface of products. 9
Nowadays, although the dynamic restoration mechanism of DSSs during hot deformation has been widely investigated by many researchers, there are still many controversies in this aspect. Some researchers proposed that each constituent phase in DSSs was softened by its own softening mechanism as in the corresponding single phase alloys, 5,6 e.g. ferrite DRV and austenite DRX. Differently, Liu et al. 10 pointed out that both of the ferrite and austenite softened by continuous dynamic recrystallisation (CDRX) in the economic DSS2101. Fan et al. 11 suggested that DRX occurred in ferrite during the hot deformation of cast DSS2205, whereas it disappeared in austenite due to the existence of the soft ferrite. In this regard, the effect of deformation parameters actually should be considered as one of the most critical influences on the flow behaviour and softening mechanism of the alloy. However, there are rare reports with the respect to this point so far.
Processing map is often employed to study the hot workability for metal materials in order to avoid the occurrence of flow instability and determine the safe regions for hot processing. Wang et al. 12 plotted processing maps of an X-750 nickel based superalloy and proposed that the optimum hot processing parameters were within a deformation temperature range of 1273–1323 K and a strain rate range of 0.1–1 s− 1. Liu et al. 13 investigated the effect of true strains on the processing maps of a Ni–20.0Cr–2.5Ti–1.5Nb–1.0Al Ni base superalloy and found that the hot deformation could be carried out first at 1253 K with a strain rate of 0.001 s− 1 when strain was 0.35 and then at 1293 K with strain rate of 1.0 s− 1 to get fine homogeneous microstructure. For DSSs, however, the optimal processing parameters and the effect of strain rate and temperature on the hot workability of the alloy are still unclear.
A systematic research on the hot workability and deformation reaction mechanism of an alloy will be conducive to the optimisation of the processing window in the actual production. For this purpose, a study focused on the microstructural evolution and relevant kinetic parameter of DSS2205 with varying hot deformation conditions has been conducted for addressing not only the softening mechanism of each constituent phase but also the internal relationship between the flow behaviour of DSSs and strain partitioning in two phases. Furthermore, the variation in hot workability of DSS2205 under varying hot deformation parameters has been investigated by the processing maps, which is related to the change of strain partitioning in the two constituent phases and also can be explained by the different flow response mechanisms of DSS2205 when the deformation condition alters.
Experimental
The steel used in this paper was DSS2205, which has a composition of Fe–0.019C–0.37Si–1.67Mn–0.024P–0.00069S–5.12Ni–23.61Cr–3.36Mo–0.19N (wt-%). The as received continuous casting blank of 300 mm in thickness was reheated to 1423 K for 2 h and then subsequently forged to a 40 mm thick slab followed by water quenching.
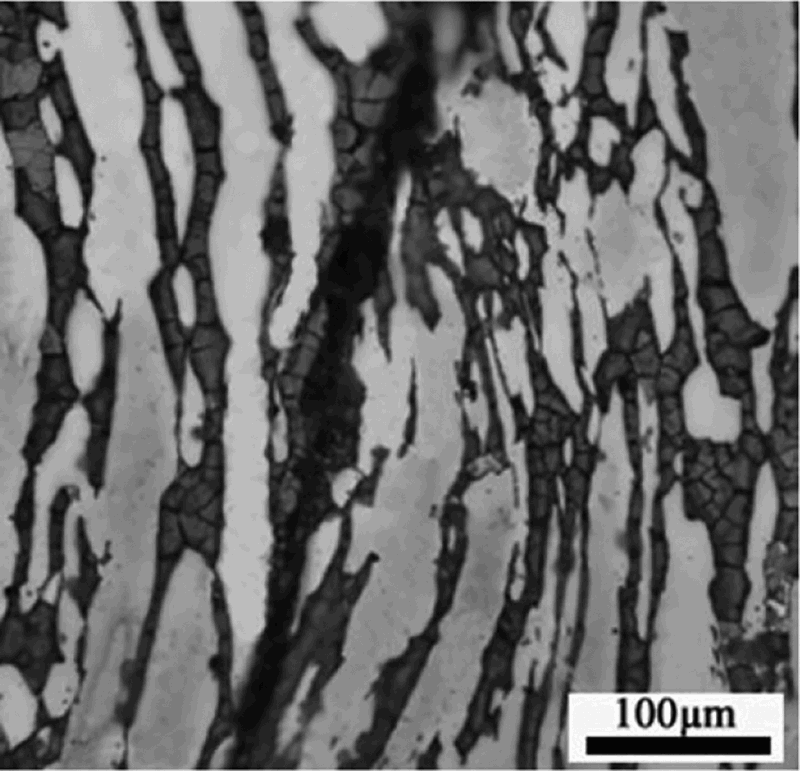
Cylindrical compression samples of 15 mm in height and 10 mm in diameter were prepared. Hot compressive tests were carried out on a Gleeble-1500 thermal mechanical simulator. The compression samples were preheated to 1523 K, held for 300 s followed by cooling to the preset temperature with a cooling rate of 5 K s− 1. The microstructure of the steel after preheating at 1523 K is exhibited in Fig. 1, in which the light and dark grey areas represent austenite and ferrite phases respectively. It can be seen that the approximately equiaxed austenite islands are embedded in the ferrite matrix. The volume fraction of ferrite matrix is measured to be ∼61%. Before the compressive tests, cylindrical specimens were held for 10 s at the preset compression temperature for avoiding radial gradient in the temperature and microstructure.
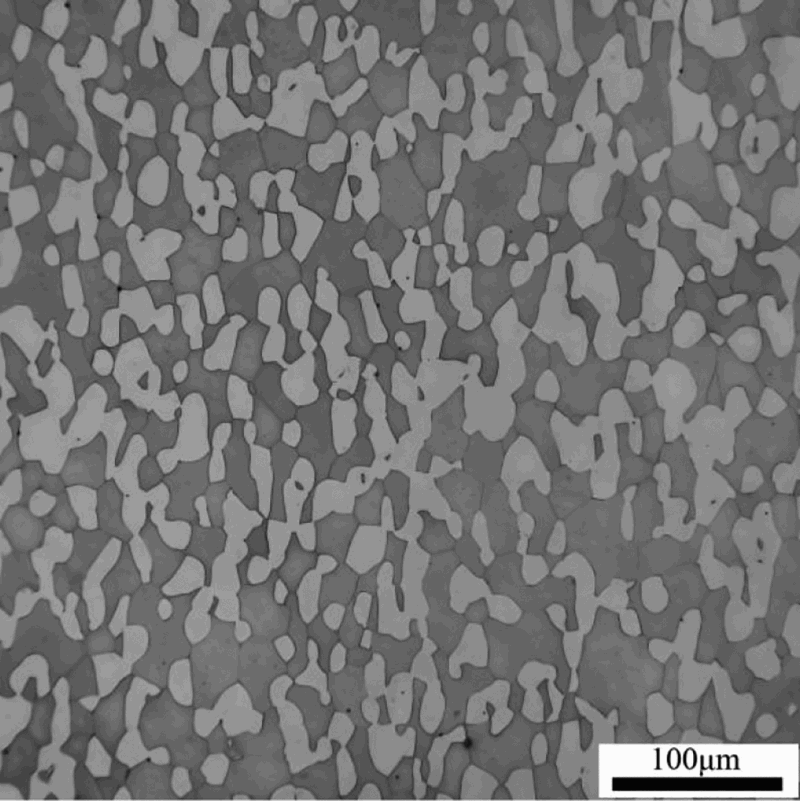
Optical microscopy image of specimens after preheated at 1523 K
Compressive tests were conducted at a strain rate range of 0.01–30 s− 1, temperature range of 1223–1473 K, followed by water quenching. The true strains used in this paper were 0.4 and 0.8 respectively. After deformation, compressed samples were sectioned parallel to the deformation axis and electropolished by a solution mixed with HClO, C2H5OH and H2O for electron backscattered diffraction analysis and then electrolytically polished by a 10%NaOH solution for optical microscope (OM) observation. Quantitative analysis of microstructure was conducted by the image processing software Image Pro-Plus, and at least 20 fields of view were selected randomly for the measurement of each specimen.
Results and discussion
Flow behaviour
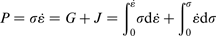
Figure 2 shows the flow curves obtained from the hot compressive tests. It can be seen that the flow stress increases with the increase in strain rate and decrease in temperature. In addition, the flow curves start to decline after a peak stress, exhibiting a softening characteristic during compressions. Meanwhile, this phenomenon is more obvious with the decrease in strain rate, as shown in Fig. 2b
. Accordingly, the effect of deformation temperature and strain rate on flow behaviour can be expressed as the Zener–Hollomon parameter Z
14,15
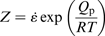


a

a


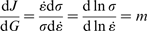
The different variation tendencies of Q in the experimental steel with varying strain rates can be explained by the strain partitioning between the two constituent phases. Generally, the value of Q in austenite differs from that in ferrite in hot deformation. The values of Q p in austenitic stainless steels with different chemical compositions are 400–600 kJ mol− 1 (1173–1473 K). In contrast, the values of Q in ferritic stainless steels only reach 320–360 kJ mol− 1, 17,18 indicating enhanced softening and hot processing ability. Moreover, the value of peak flow stress in 904L austenitic stainless steel is approximately 120–150 MPa (e.g.1323 K/0.1 s− 1),which is much higher than that of ferritic stainless steels under similar deformation conditions. 17,19 This indicates that the flow strength of austenite is much higher than ferrite during hot deformation. Thus, as proposed in the literature, 3,4 strain partitioning always occurs in a duplex microstructure when the strain is mostly accommodated by the ferrite phase at the early stage of deformation. Then, in the following deformation, the strain starts to transfer from ferrite into austenite, which results in the strain energy accumulation in the latter and makes the subsequent processing more difficult. 18 In this experiment, the sufficient response time promotes the interface migration and dynamic softening of the ferrite when a lower strain rate is applied, which makes the deformation resistance always stay low and delays the strain transfer between the two phases. In this case, the better softening and hot process ability in the ferrite successfully decrease the value of Q with the increase in strain. By contrast, at a relative high strain rate, deformation resistance of ferrite increases rapidly with the increase in strain due to the lack of sufficient time for dynamic softening, accelerating the strain transfer into the austenite, as discussed above, which has promoted the strain energy accumulation in the alloy. Thus, the platform of Q observed in Fig. 3 with a relative high strain rate should be the result of interactions between strain hardening occurring in the austenite and dynamic softening in the ferrite.
Microstructural evolution
Typical electron backscattered diffraction images of the specimens deformed at varying deformation parameters are shown in Fig. 4. In Fig. 4, the red and blue areas represent the austenite and ferrite phase respectively. The white lines reveal high angle grain boundaries (HAGBs, θ ≥ 15°), and the black lines indicate low angle grain boundaries (LAGBs, θ < 15°). As shown in Fig. 3a , after straining of 0.4 with a strain rate of 0.01 s− 1 at 1323 K, numerous LAGBs have formed in ferrite, indicating that DRV has occurred under this condition. As strain increases to 0.8, the ferrite are significantly refined, characterised by many of the LAGBs in ferrite having been replaced by HAGBs. During this process, the proportion of HAGBs increases from 40.18 to 61.57%. According to the softening mechanism occurring in the ferrite phase, 20–22 only less than one-third of glide dislocations caused by plastic deformation in ferrite are expected to be annihilated when they meet each other with the rest being stored in dislocation networks, a majority of which have uncompensated stress fields. Migration of low angle dislocation walls under the action of both the mutual attraction forces and the external stress field leads to their merging with a change in misorientation. Consequently, gradual build-up of misorientations takes place in different parts of the initial grains through a complex equilibrium network of low and higher angle boundaries. Then, as the strain continues to increase, large fractions of mobile dislocations are continuously absorbed in the low angle boundaries, which gradually increase the mean misorientation angle and widen the misorientation spectra with the increase of strain. 21,22 The subgrains are gradually converted to crystallites bounded partly by low and high angle boundary facets when straining continues to large strain levels. In some local regions, some fragments may be completely bounded by high angle boundary segments, representing new recrystallised grains. 23,24 These research findings can be used to predict the character of the arrangement of LAGBs and HAGBs observed in the present study. Meanwhile, similar phenomenon can also be found in the research in regard to the softening mechanism of ferrite in DSS2101, which is usually named as CDRX. 10,22,23 In this process, the flow stress decreases after the peak point at the lower strain rate, as shown in Fig. 2. Figure 4e shows the microstructure of the alloy deformed in the same temperature with the strain rate of 30 s− 1 after straining of 0.8. It can be seen that an increase in strain rate has made CDRX of ferrite weakened due to the insufficient response time, and the proportion of HAGBs in ferrite only reaches 28.23%. In addition, it is worth noting that, for all the specimens above, only very rare of DRX grains are observed in austenite islands, as seen in Fig. 4a, c and e , which is in consistence with the previous report suggesting that DRX of austenite has been often absent in duplex microstructure. 11

a, b


Figure 5 shows the OM microstructure of the specimens after staining of 0.4 at 1323 K with strain rates of 0.01 and 30 s− 1. As discussed above, a lower strain rate during hot deformation will contribute to the strain partition in the ferrite, causing most of the austenite islands (not austenite grains) to still present spherical at the lower strain rate after straining of 0.4. In contrast, when the compression is conducted at a higher strain rate, the austenite islands have been elongated, which presents a more significant plastic deformation characteristic (Fig. 5b ). Meanwhile, this similar phenomenon can also be found in TEM images. It can be seen that dislocation density in austenite still remains very low at the lower strain rate (Fig. 6a ). On the contrary, when the strain rate increases, the increase in true strain partitioning in austenite leads to a large number of tangled dislocations formed (Fig. 6b ).

a


a

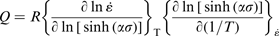
At a given strain rate (30 s− 1 in this paper), the flow behaviour of the two constituent phases also varies with different temperatures. For ferrite, when the temperature increases to 1423 K, the proportion of HAGBs reaches 57.58% after straining of 0.8 (Fig. 7b ), which is much higher than that at 1323 K with the same strain rate. On the contrary, if a lower temperature of 1223 K is applied, the proportion of HAGBs in ferrite has declined to only 27.76% (Fig. 7d ). Thus, it can be concluded that a decrease in temperature weakens the degree of CDRX in ferrite. For austenite, similar to previous works, 11,25 the phase proportion has increased from 35 to nearly 50% after measurement on OM images by Image Pro-Plus when the temperature decreases from 1473 to 1223 K. As a result, as shown in Fig. 7c , some DRX grains have nucleated at deformed grain boundaries due to the increase in phase proportion and strain partitioning, forming a necklace structure within austenite islands. Commonly, this type of DDRX often occurs in those materials with low stacking fault such as copper or γ-Fe. 26,27
a, b T = 1423; c, d T = 1223 K
Processing maps
During hot deformation of an alloy, deformation temperature and strain rate are two of the most major factors that influence microstructural evolution and hot workability of a material. A processing map is plotted based on the power dissipation map, which represents the response of a material to the applied deformation conditions. In the simplest way, the following power law equation can be used
28


Relation between power dissipation and ln Z
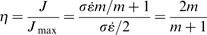
The relationship between the value of power dissipation and deformation parameters is shown in Fig. 8. In Fig. 8a
, it can be seen that the power dissipation almost increases with the increase in temperature and the decrease in strain rate for the higher migration of dislocations and grain boundaries in the alloy under such condition, which promotes the structural transformation and dynamic softening (e.g. CDRX in ferrite). On the contrary, when the temperature decreases and strain rate increases simultaneously, the weakened dynamic softening promotes the strain energy stored in the alloy, representing a decrease in proportion of the energy consumed in structural transformation. Figure 8b
exhibits the quantitative relationship between power dissipation and ln Z at the strain of 0.5. It can be seen that the power dissipation depends linearly on ln Z, which can be expressed as 
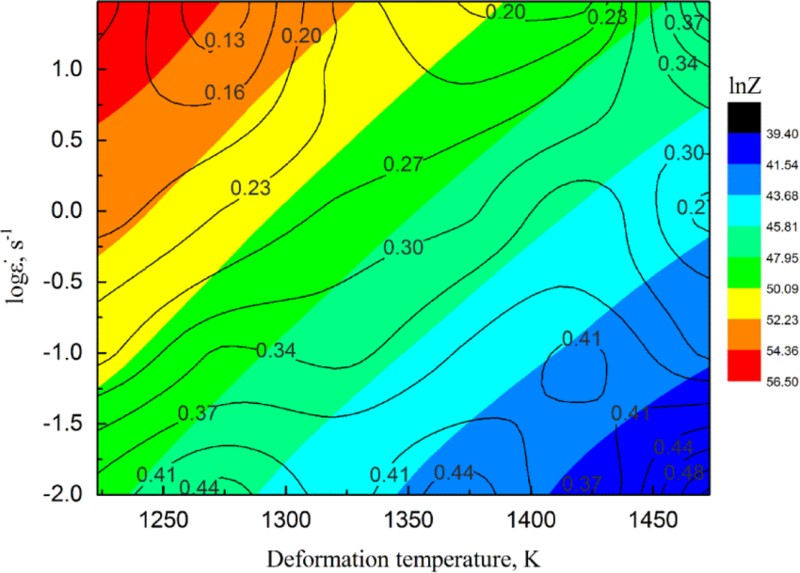
Power dissipation contour overlapped by ln Z with strain of 0.5
Values of α and β at strains of 0.3–0.6
Processing map characteristics
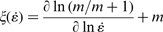
Figure 9a–d presents the processing maps of DSS2205 at typical strains of 0.2, 0.4, 0.5 and 0.8 respectively. Figure 9a shows that the flow instability regions appear at a relative high strain rate at the beginning of deformation. It corresponds to two regions: region 1 is located in the temperature range of 1260–1300 K, with logarithm of strain rate range of 0.75–1.47, and region 2 corresponds to the temperature range of 1360–1440 K, with logarithm of strain rate range of 0.45–1.47. However, as the strain increases, the regions with negative ξ values have undergone great changes, as shown in Fig. 9b–d . Region 2 has gradually narrows and nearly disappears after straining of 0.8. By contrary, the area of region 1 has increased with an increase in strain. In this context, when the compression is conducted at a relative high strain rate, the dislocation annihilation will be suppressed at the early stage of deformation due to the lack of sufficient response time, which results in a rapid strain energy accumulation and causes the flow instability regions in the processing map. At the following deformation, the flow stability of the alloy decreases with the decrease in temperature in the high strain rate, which is affected by the weakened dynamic softening in the ferrite. This causes the different variation tendencies of the two flow instability regions as the strain increases.
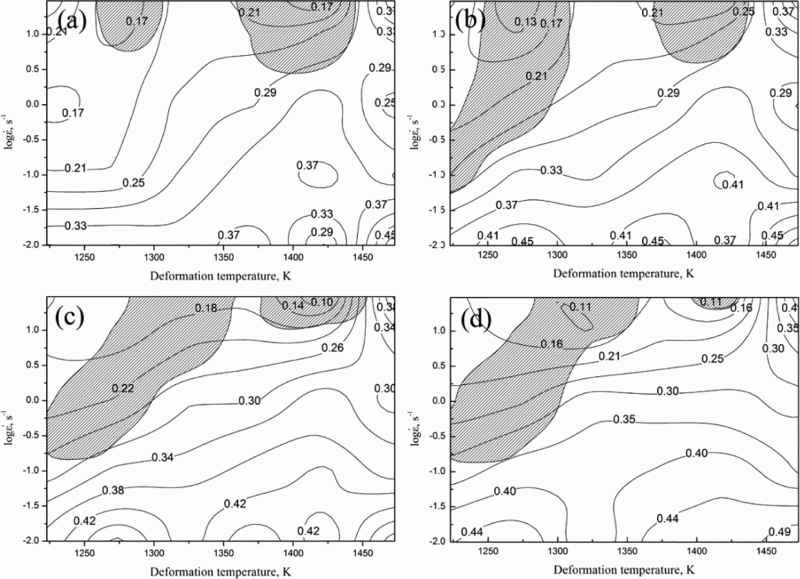
a ε = 0.2; b ε = 0.4; c ε = 0.5; d ε = 0.8
Figure 10 shows the characteristic of microcrack generated in flow instability region (T = 1323 K, 
Microcrack characteristic of specimen deformed at 1323 K with strain rate of 10 s− 1
Conclusions
Flow behaviour and hot workability of DSS2205 have been studied through investigating the microstructural evolution, flow curves, apparent activation energy and processing map during hot compression. Then, the following results have been obtained. The softening mechanism occurring in the constituent phases differs from each other in DSS2205 during compressive tests. Accordingly, the soft phase ferrite softens by DRV and CDRX, while the austenite only softens by limited DDRX. The effects of strain rate and temperature on the flow stress and dominant softening mechanism occurring in the two constituent phases are very significant. At low strain rates (0.01–0.1 s− 1), ferrite dominates the flow behaviour through activated dynamic softening, which leads to a continuous decline of Q with the increase in strain. On the contrary, the increase in strain rate weakens dynamic softening of ferrite and promotes strain transfer into austenite, causing an obvious characteristic of strain hardening in the latter. In this case, the decline of Q is interrupted in the medium deformation stage. The deformation parameters and flow behaviour significantly affect the hot workability of the alloy. The increase in power dissipation is almost linearly associated with decrease in ln Z. When the temperature decreases and strain rate increases, lacks of sufficient softening in ferrite together with strain hardening in austenite deteriorates the hot workability of the alloy and causes the microcrack formation at 1323 K and 10 s− 1. Overall, it can be seen that, in hot processing map, the optimum hot processing parameters for DSS2205 are in a strain rate range of 0.01–0.1 s− 1 with the temperature range of 1223–1473 K and strain rate of 0.1–10 s− 1 with the temperature of 1350–1473 K.
Footnotes
Acknowledgements
The present study was financially supported by the National Key Technology R&D Program (grant no. 2012BAE04B01).