
Abstract
Liquid steel samples were taken during ladle treatment and continuous casting of 37 heats of two duplex stainless steel grades. These samples were used to study inclusion characteristics and potential process control using the pulse distribution analysis with optical emission spectroscopy method (PDA/OES). In addition, a few samples were chosen for a scanning electron microscope examination. A simplified approach of presenting the inclusion composition in ternary diagrams using the PDA/OES method is discussed. More specifically, by defining an operating window, potential deviations can be identified early in the steelmaking process. The variation of the B factor for Al (B Al) with process time was presented showing similar tendencies for several heats. For that reason, the B factor is considered to be a reliable parameter to study any process changes with respect to inclusion characteristics. Parameters such as B Al and the number of inclusions per unit volume larger than 4 μm obtained using the PDA/OES method showed a moderate correlation with a slivers index. Statistically, more data have to be collected for further studies. Nevertheless, the PDA/OES method is judged to be a promising tool to determine a slivers risk factor at an early stage of the process.
Introduction
The interest of gaining online information about the non-metallic inclusion situation during secondary steelmaking has increased during the past two decades. The main motives have been the possibility of controlling the steelmaking process in order to optimise the properties of the cast product. Another motive has been the possibility to reclassify a steel product depending on its inclusion characteristics. The effect of non-metallic inclusions on the production processes as well as properties of the final cast product has been studied extensively. In addition, it has also been experienced that inclusions may directly affect and even interrupt the steel flow (e.g. nozzle clogging) during casting. To have a tool that provides information about inclusions in just a few minutes from the moment of sampling would be of great importance for the continuing optimisation of the steel processes. The method that has played a major part in the realisation of this and is currently used as routine method at several companies (voestalpine, Ascometal, Dillinger, SSAB EMEA 1–3 ) is the optical emission spectroscopy method with pulse distribution analysis (PDA/OES). To this point, the PDA/OES method has shown promising results with respect to the repeatability as well as a clear relative change in the inclusion characteristics as a function of process time. 4–8 In addition, the PDA/OES method has successfully been used to study the effect of different ferroalloys on process parameters such as the clogging index and steel cleanliness. 9–11 Moreover, it has been shown that PDA/OES can be a helpful tool for improving and optimising soft reduction parameters when investigating macrosegregation in slabs. 12,13 However, the main focus in most of the studies has been its application on low alloyed steels.
Within the development of the PDA/OES method in applications for stainless steels, Outokumpu Stainless AB in Avesta has performed extensive work focused on the calibration and verification of results using established assessment routines and commercial certified reference materials representing final rolled products. 14 One study included examination of two certified reference materials, JK27A and ECRM298-1, in a round robin test within the EU project RAMSCI. 15 The insoluble content or the so called B factor for Al was determined using the PDA/OES method, a wet chemistry method, and from cross-sectional studies using scanning electron microscopy–energy dispersive spectroscopy. The results showed a very good agreement with respect to the insoluble Al content between the different methods. Another study at Outokumpu has also successfully been performed on stainless steel samples taken at different process stages (ladle, tundish and final product). More specifically, a clear difference in the PDA/OES results was observed between ‘dirty’ and ‘clean’ samples. However, in order to use this method as a feedback tool for online process control, more inclusion related parameters that could change during the process or affect the final product have to be studied. More specifically, it would be of great significance in many aspects if the method is able to detect these changes or any possible deviations during an early stage of the secondary steelmaking.
The present study includes an examination of liquid steel samples taken during the production of duplex stainless steels with respect to different inclusion characteristics using mainly the PDA/OES method. Furthermore, the possibility of using this method online is discussed. Finally, a possible tendency between PDA/OES data on process samples and the slivers index of the final rolled product is discussed.
PDA/OES method
Optical emission spectroscopy
OES is the dominating spectrometric technique for a fast routine elemental determination of steel samples. The principle of the technique is illustrated in Fig. 1. 7,16,17 During a test, a high energetic discharge of electric sparks with a certain frequency ablates the material of the sample surface. This leads to excitation of atoms and ions in the plasma to elevated electronic energy levels. In this manner, light of different wavelengths specific for each element is being emitted. These wavelengths are separated by a diffraction grating, which is part of the spectrometer. Thereafter, the light intensity is measured for each wavelength using photomultipliers. In addition, a specific calibration function is used, C = f(I), to determine the total mass fraction, C, of each element in the ablated material, where f(I) is the light intensity function for each element. This calibration is mainly performed using certified reference materials. However, additional well characterised reference materials may also be used. 17,18
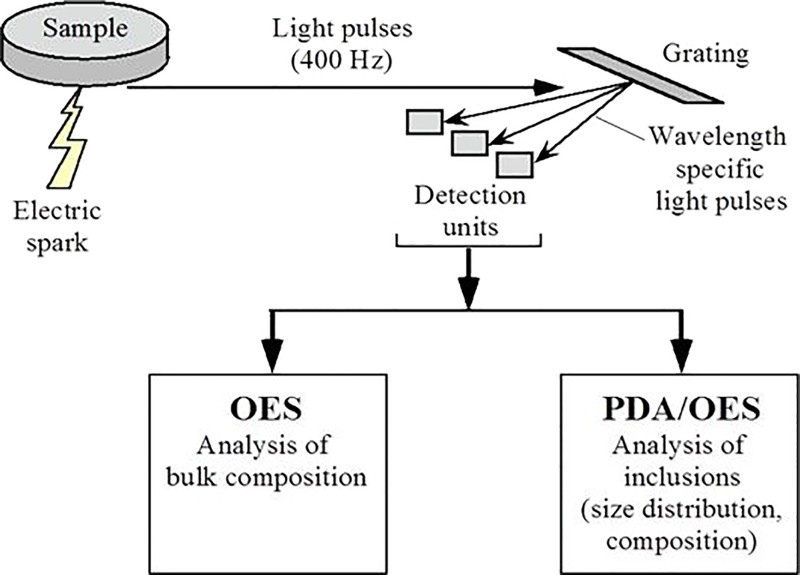
Schematic illustration of PDA/OES measurement
Pulse distribution analysis
The principle for PDA of non-metallic inclusions in steel samples is based on the same principles as the OES method used for the compositional analysis (Fig. 1). In addition, information related to inclusions is evaluated for single sparks. Figure 2 shows spark intensities (‘pulsograms’) for Al and Ca in a steel sample obtained from one PDA/OES measurement (4000 sparks). Some highlight intensity peaks (outliers) can be seen, which are related to the given elements present in the inclusions. These outliers are identified as intensities that exceed the median intensity of the metallic background. These are related to a specific number of standard deviations (σ). The σ value, in turn, is determined based on an iterative calculation that includes a removal of large outliers. In addition, the identification of inclusion types is based on coincidences of outliers detected in single sparks. If high intensity outliers such as Al and Ca are present in the same spark, a complex inclusion containing both elements has most likely been ablated. Finally, the information is quantified to provide the size, number and composition of inclusions in steel samples.
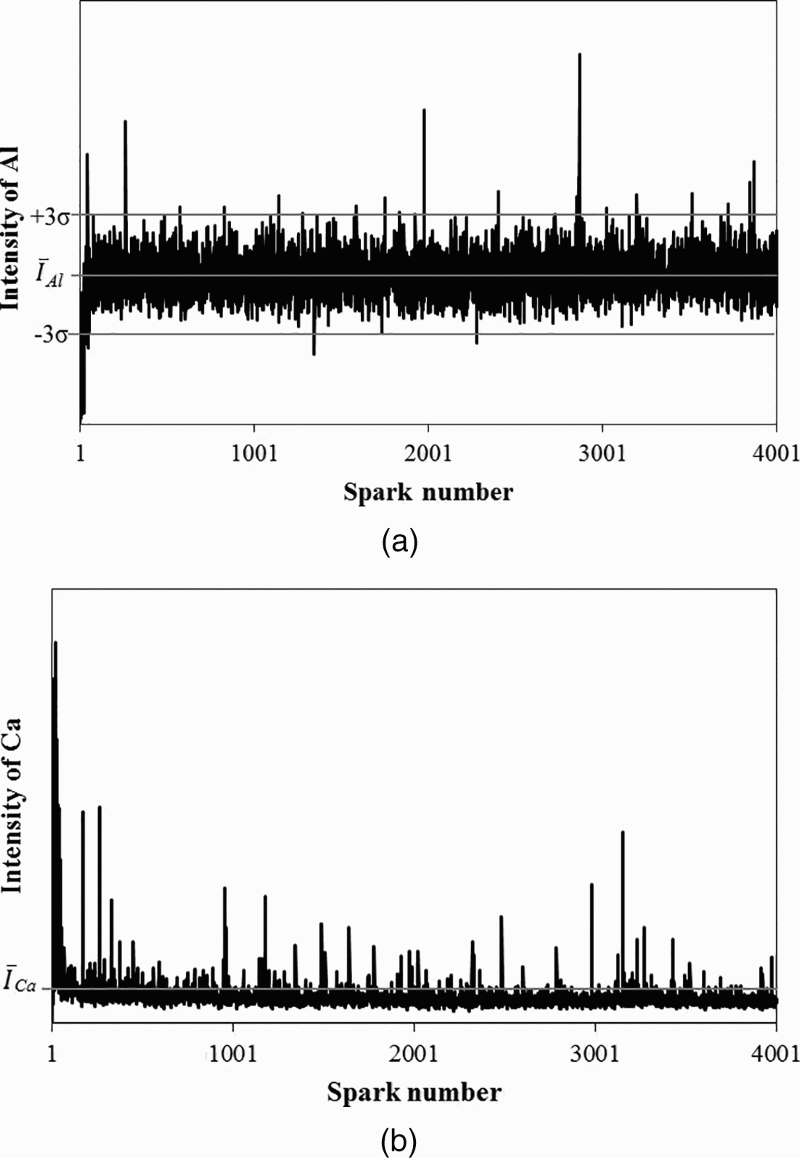
Typical intensity distributions obtained from PDA/OES measurements of a Al and b Ca contents in steel samples
Experimental
Description of melting process route
The raw material that is used at Outokumpu Stainless AB in Avesta for the production of stainless steel is mainly scrap based. When the scrap is melted in the electric arc furnace, the steel melt is transferred in a ladle. Thereafter, the steel is charged to the argon oxygen decarburisation (AOD) converter. In the converter, the decarburisation, reduction and sulphur refining steps are performed to refine the steel. During the process in the AOD converter, alloys, slag formers and reduction/desulphurisation agents are added. Thereafter, the steel melt is tapped from the converter into a ladle and transferred to the ladle furnace. In the ladle furnace, the steel composition and temperature are adjusted. The adjustment of the temperature is done with the use of electrodes for heating and with the addition of cooling scrap to decrease the temperature. The melt is stirred inductively as well as with the help of argon gas. When the desired steel parameters are reached, the ladle is transferred to the continuous casting station. Here, the steel melt is tapped from the ladle into the tundish and is cast through a mould into slabs. For the present study, the focus is primarily on samples taken during the ladle furnace treatment and the casting process.
Sampling campaign
In the present study, a sampling campaign was performed at Outokumpu Stainless, which included sampling from 37 heats (heats A1–A24 and B1–B13). Two Ca treated duplex stainless steel grades were chosen to be included in the examination. The standard EN denotations and typical compositions are presented in Table 1.
Examined steel grades including EN standard denotations and typical chemical compositions/wt-%
Sampling of liquid steel was done at different process steps, as illustrated in Fig. 3. Three liquid steel samples were gathered at the ladle furnace: after slag melting (LF1), after the compositional adjustment (LF2), and after the CaSi addition, i.e. just before transferring the ladle to the casting station (LF3). Finally, the last liquid steel sample was taken from the tundish during continuous casting ∼10 min after the casting start (CC1).
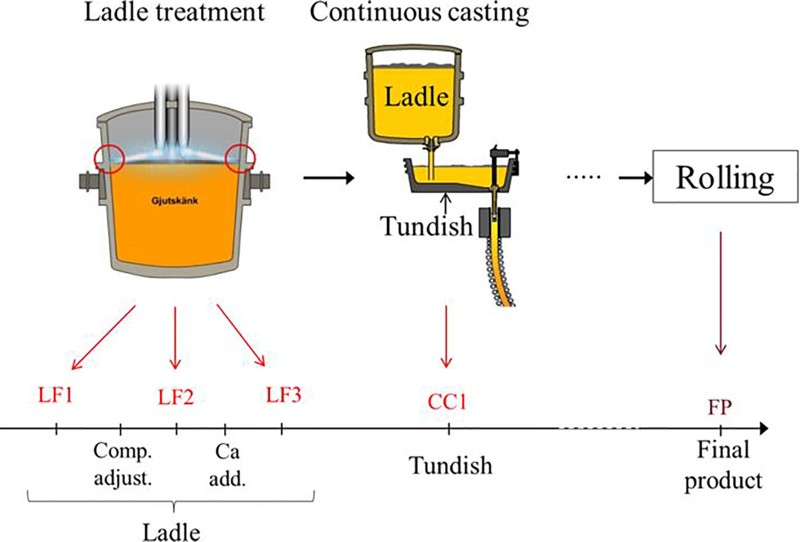
Schematic illustration of secondary steelmaking process and different sampling moments LF1, LF2, LF3 and CC1
The liquid steel samples were taken using automatic sampling equipment at the ladle station, while manual sampling equipment was used at the casting station. In addition, all liquid steel samples were taken using argon protected samplers. Furthermore, the samplers were dried at 70°C for at least 24 h before sampling.
The type of sampler used for the liquid steel sampling was a lollipop (LP) type (thickness = 12 mm, diameter = 30 mm), which is a standard at Outokumpu in Avesta for compositional analyses of process samples. Samples from all heats were used for the PDA/OES study, while samples from four heats were also chosen for the scanning electron microscopy (SEM) examinations in the present study.
Measurements and analysis
PDA/OES settings and software
All the PDA/OES measurements were performed on the Spectrolab M10 spectrometer at Outokumpu Stainless in Avesta. Each measurement is based on 4000 sparks. One measurement takes ∼40 s when using the available frequency of 100 Hz. With the current condition, ∼60 ng per spark of material is ablated, which corresponds to ∼0.24 mg of ablated material per measurement. Overall, 5 or 10 measurements were performed on each LP sample in this study.
After the measurements, the obtained raw intensities were processed with the available PDA software at Outokumpu Stainless. In the software, different settings are available. For example, different elemental groups can be combined depending on the types of inclusions that exist in the material. The PDA software at Outokumpu Stainless has been developed in cooperation with Sandberg Analytical Data AB. An algorithm developed during a European project 2002–2004 is used.
19
The main steps in the calculation procedure can be described as follows
20
: The first 500 sparks are excluded from the calculation in order to eliminate the effect of any contamination on the sample surface. The sparks that give a low Fe signal are excluded, i.e. if they are < 30% of the average value. A concentration of each element and spark is calculated from the intensity values based on calibration functions. In addition, negative values are removed. The concentration of each element is multiplied with the excited mass to transform it to a mass for the element. Thereafter, a certain number of iterations are performed for each element. For the present investigation, three iterations were chosen for the calculations. All values higher than a certain number of standard deviations (σ) are removed before performing iterations. Those so called outliers correspond to inclusions. The background level, which corresponds to the soluble content of each element, is subtracted from the mass for each outlier. The background level is based on an average of all sparks for an element. The next step is to classify the outliers into different elemental groups predefined for the chosen method in the software. The elemental groups can comprise one to four elements. The mass for elements that are not determined using the PDA/OES method (e.g. O and N) is added to the determined mass of elements according to stoichiometric ratios for inclusions. Thus, the total mass is calculated for each outlier. In this way, parameters such as the inclusion size can be calculated.
SEM–energy dispersive spectroscopic analysis with Inca Feature
For the SEM observations (hereafter referred to as the SEM method), the LP samples were ground and polished using water free solutions. The samples were scanned using the Inca Feature software to collect information such as inclusion composition and inclusion size distribution. An area of 100 mm2 was scanned on each sample using a magnification of × 250 for inclusions larger than 2 μm. In addition, a smaller area of 20 mm2 was scanned using a magnification of × 1000 for investigations of inclusions in the size range 0.7–2 μm. The number of investigated inclusions varied from 43 to 1889 in different samples.
Correlation study between PDA/OES data and slivers index
A determined slivers index on the final rolled product was chosen for a correlation study with data obtained using the PDA/OES method on the process samples LF1 and LF2 taken from the ladle during ladle treatment, and CC1 taken from the tundish during continuous casting. The study was based on information from 10 heats of the steel grade LDX2101. The following parameters were tested in the correlation study: (i) the B factor for Al (B
Al) and (ii) the number of inclusions per unit volume with a diameter larger than 4 μm [N
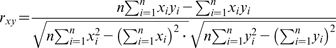
V (d>4 μm)]. The correlation coefficient, r
xy
, was calculated according to the following equation
21
:
Results and discussion
Ternary diagrams obtained with SEM and PDA/OES methods
An important inclusion characteristic to study is the chemical composition of inclusions, usually presented in ternary diagrams. In the present study, samples from four heats were chosen for the SEM examination. Typical compositions of inclusions present in the liquid steel samples taken from the tundish during continuous casting are presented in Fig. 4 for the steel grades LDX2101 and SAF2507. The corresponding results obtained using the PDA/OES method (circle marks) are included in the diagrams as well. As can be seen, the chemical compositions are presented using the oxides Al2O3, CaO and MgO. More specifically, the oxide SiO2, which is an expected component in the inclusions in these steel grades, is not included. It is known from previous studies 15,22 that the PDA/OES method has shown limitations with respect to the detection of Si in inclusions in stainless steels due to the high Si bulk content. Therefore, SiO2 was excluded in the presentation of the results for both the SEM and the PDA/OES methods. It is obvious in the diagrams that the results regarding the inclusion composition differ quite much between the two methods. The SEM results show that the majority of inclusions containing all three components are concentrated within a relatively narrow compositional area. However, the PDA/OES results show outliers separated in different groups. These are (i) a relatively small number of outliers consisting of all three components, (ii) outliers along the CaO–MgO axis, (iii) pure MgO outliers, and (iv) pure CaO outliers. In fact, this difference in the inclusion composition between the two methods is expected. The difference is mainly due to statistical limitations with the PDA/OES method. More specifically, many inclusions containing all of the chosen three elements are probably classified as outliers containing one or two elements. Therefore, the results obtained using the PDA/OES and SEM methods may possibly show different realities of the inclusion situation and should not be compared. Instead, they can be used for either different purposes or to complement each other.
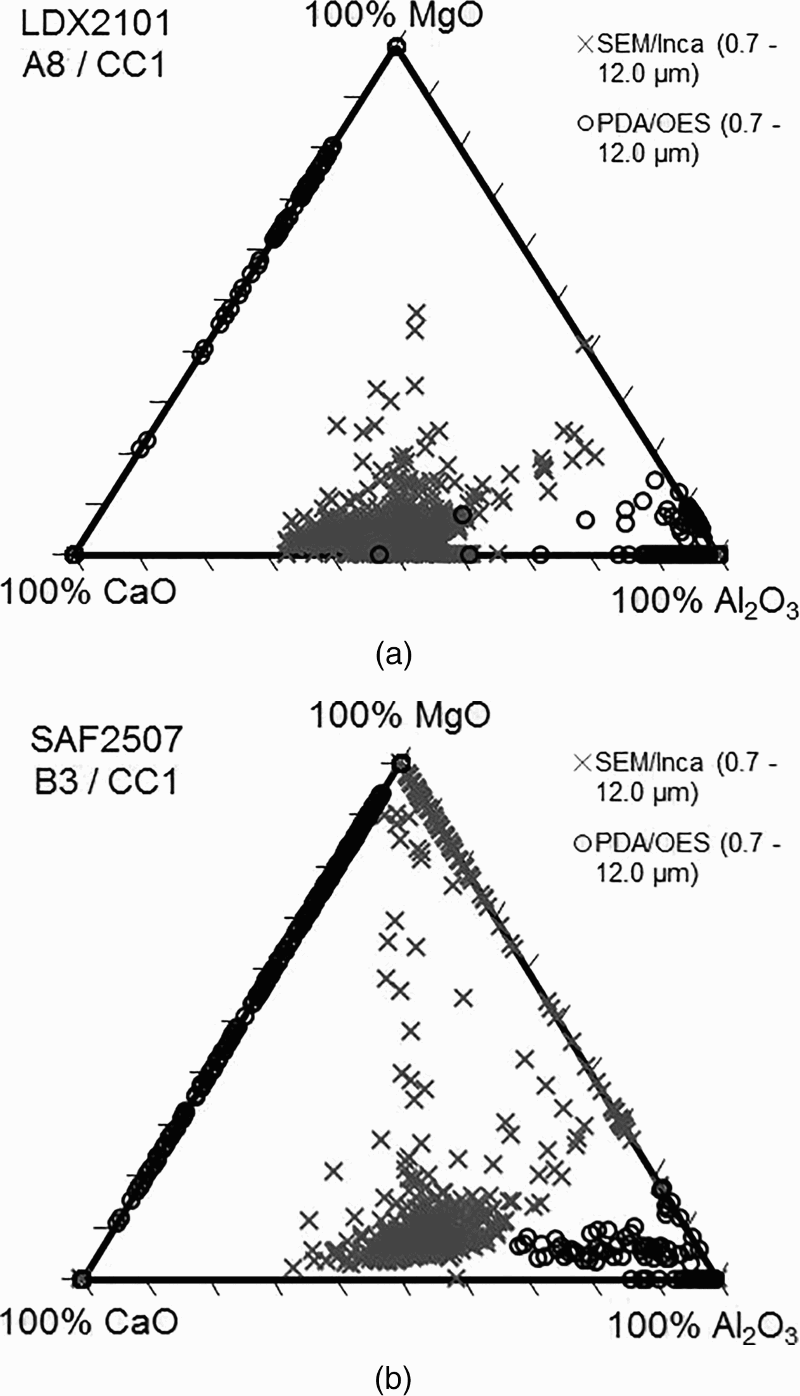
Typical chemical compositions of inclusions in steel samples taken from tundish of steel grades a LDX2101 and b SAF2507
Possible application of PDA/OES in steelmaking process
For an online use of the PDA/OES results during the steelmaking process, it was found necessary to simplify the presentation of the inclusion composition. Therefore, the percentage of the total ablated mass (m) of the oxides was calculated (see equation (2)):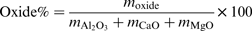
Inclusion composition obtained using PDA/OES in CC1 samples from steel grades a LDX2101 and b SAF2505
To this point, it is recommended to use this value mainly for a comparison of the inclusion composition in steel samples taken at the same process stage from different heats and preferably for the same steel grade. This is simply because this calculated value does not provide any information on the specific changes of the individual oxides between the different process steps. Moreover, if PDA/OES measurements are performed on a statistically high number of samples, a normal state of the inclusion composition could be defined, which depends on the location of these points in the ternary diagram for a specific steel grade and process stage. Consequently, an operating window is created and any deviations from the process regarding the inclusion composition can be detected online.
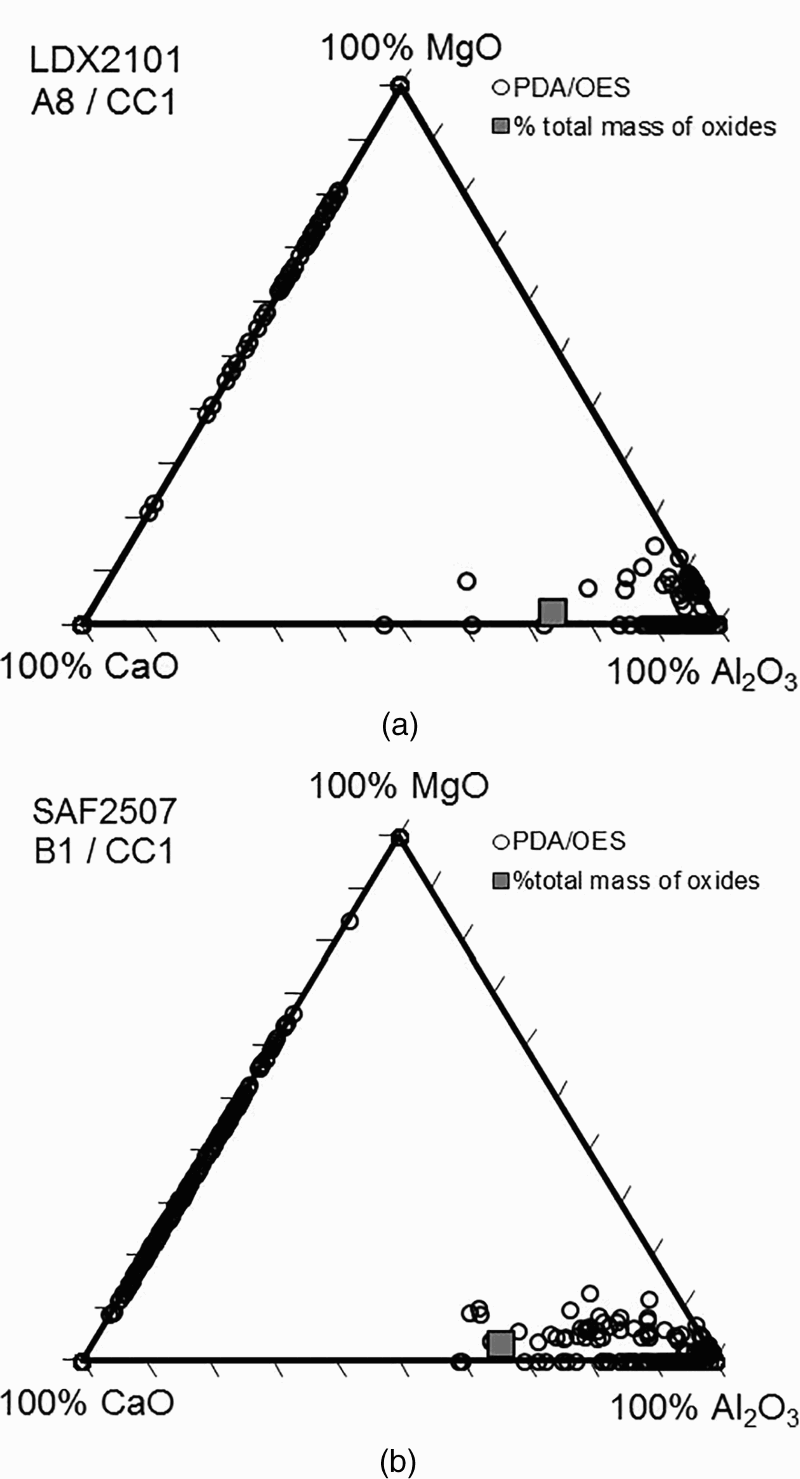
In order to illustrate how the operating window can be defined, values of the mass-% of oxides from investigated LF2 and CC1 samples for steel grades LDX2101 and SAF2507 are plotted in ternary diagrams in Fig. 6a and b respectively. The positions of the respective operating window are, to this point, just suggestions based on current data. However, after collecting results from a considerably higher number of heats, these positions can be optimised for a more reliable use of PDA/OES online. Once the deviating heats are identified, the next step would be to take proper measures for corrections or at least to make notifications of the deviation for future investigations. Thus, the idea presented above could be an alternative on how to use the PDA/OES method for process control with respect to the inclusion composition.
Calculated mass-% of oxides and suggestions of position of operating windows for samples LF2 and CC1 for steel grades a LDX2101 and b SAF2507
B factors obtained with PDA/OES method
In order to study the specific change in the inclusion composition with process time, the B factor has to be considered. The B factor can be obtained using the PDA/OES method, and it represents the total mass-% of a certain element present in inclusions (e.g. Al, Ca or Mg) also known as the insoluble content. However, the content obtained using the PDA/OES method only comprises inclusions within the detectable size range. A more detailed description and definition of the B factor can be found elsewhere. 15 In the present study, it was assumed based on the SEM examinations that the detected inclusions present in the liquid steel samples consisted of the oxide Al2O3 among others. For that reason, the B factor of Al, B Al, was chosen to be studied. The variation of the B Al values with process time is shown for three heats of the steel grade SAF2507 in Fig. 7. As can be observed from the figure, a similar tendency of the change of the B Al values is observed for all heats. First, there is an increase of B Al between the LF1 and LF2 samples. A simple explanation of this increase is due to the reaction between dissolved Al and O as a consequence of the addition of Al when the compositional adjustment of the steel is made. Thereafter, between the LF2 and LF3 samples, this content decreases. In this case, an explanation could be a separation of inclusions from the steel melt to the top slag and refractory. This is most likely due to collisions and separations of inclusions caused by the stirring. Finally, B Al increases again between the LF3 and CC1 samples. This increase could be explained by several factors influencing the oxide content. One of the most important parameter is the time between the sampling moments of these last samples. Some of the process steps that are performed during this time are (i) transport of the ladle from the ladle furnace station to the casting station, (ii) opening of the ladle, (iii) filling of the tundish before casting and (iv) casting for ∼10 min before the CC1 sample is taken. In addition, for some heats, the ladle is kept at the ladle furnace for a certain time since it is the first heat in a sequence. During this time, new inclusions can be formed through, for example, reoxidation and dissolution of the refractory material in the ladle and tundish, resulting in an increased content of Al in inclusions. In addition, the temperature of the steel melt is lower in the tundish, which decreases the solubility of oxygen in the steel melt, resulting in the formation of new inclusions.
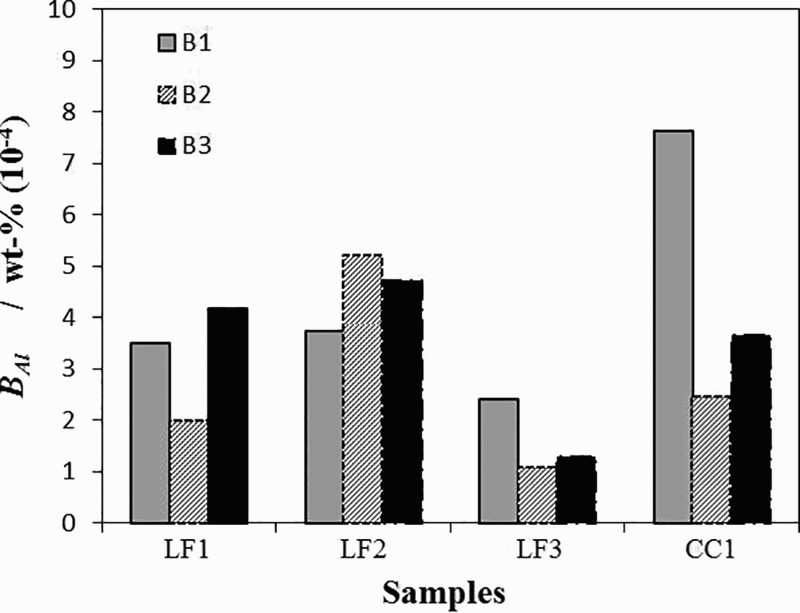
Variation of B factor for Al, B Al, with process time for three heats of steel grade SAF2507
It has to be pointed out again that the PDA/OES method does not determine the real total Al content in inclusions (insoluble content). When taking a closer look, the calculated size of the determined outliers does not often exceed ∼7 μm. This could perhaps be seen as a maximum size of inclusions that is possible to detect with the PDA/OES method for the studied cases. In addition, there is a lower size limit as well that depends on the dissolved Al content. 5 It has been shown from previous comparative studies 15 on reference samples (JK27) that the calculated B Al value is reliable. Thus, provided that the conditions are carefully defined, the B Al value is considered to be a reliable parameter that can be used to study the process change during the ladle furnace treatment as well as during continuous casting.
Correlation between PDA/OES results and slivers
In previous studies, 10,23–29 it has been suggested that entrapment of mould powder and gas bubbles could be causes for slivers in the final rolled product. In addition, inclusions such as alumina clusters have also been observed in the surface defects. 25,26,28 The origin of these alumina clusters has not always been clear. However, Rocabois et al. 27 proved using lanthanum tracing that some of the observed alumina inclusions present in slivers are deoxidation products, which were present in the ladle and the tundish. In Fig. 8, a light optical microscopy (LOM) and an SEM image are shown for typical slivers observed in Outokumpu's final rolled product at Avesta Works.
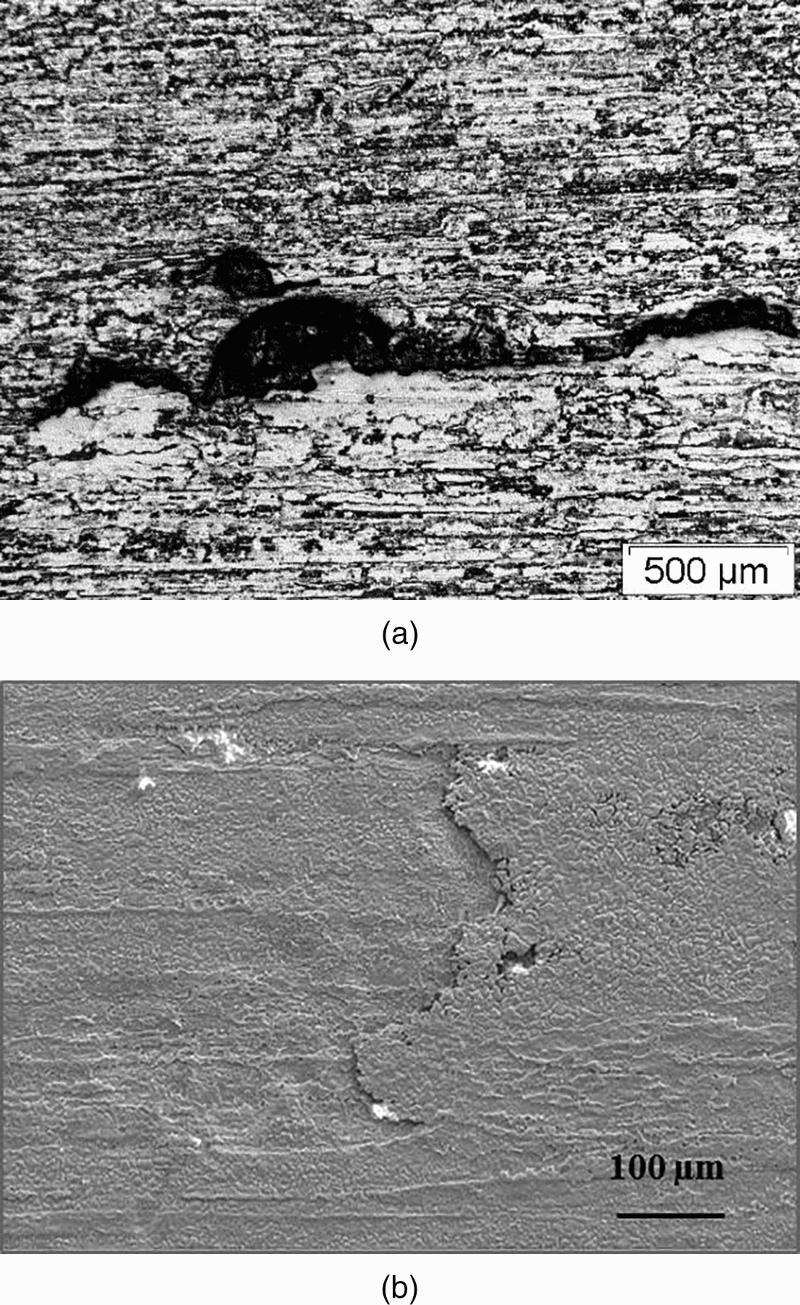
Typical a LOM and b SEM images of slivers observed in Outokumpu's final rolled product at Avesta Works
Nevertheless, a determined slivers index on the final rolled product was chosen for a correlation study with data obtained using the PDA/OES method on process samples steel taken from the ladle during ladle treatment and from the tundish during continuous casting. Based on data from 10 heats of the steel grade LDX2101, it was found that there was a moderate correlation (r xy ∼0.4–0.6) between the B Al values and the number of inclusions with a diameter larger than 4 μm, N V (d>4 μm), for samples LF2 and CC1, which are taken at the ladle furnace after the compositional adjustment and from the tundish respectively. The correlation between the slivers index and chosen PDA/OES parameters is more unclear in the LF1 samples (r xy ∼ ± 0.3). This indicates that the changes made after this sample was taken (after slag melting in the ladle at the ladle furnace) could be involved in the presence of slivers in the final rolled product.
The PDA/OES data on samples LF2 and CC1 as a function of slivers indices are presented in Fig. 9, where an average value of the slivers index in specific intervals of the different PDA/OES parameters is also calculated (circle marks). For all the presented cases, the results indicate an increased risk of having slivers when the values for B Al or the number of inclusions with a diameter larger than 4 μm are high. Statistically, more data are needed to confirm a correlation between these parameters, since no slivers were observed in six of the studied heats. However, these results are still considered to be very promising for the continuing work to determine the risk factor of having slivers in the final rolled product at an early stage during the steelmaking. More specifically, when certain PDA/OES parameters have values higher than a specific limit in samples taken after the compositional adjustment at the ladle furnace, measures can be taken before casting the liquid steel.
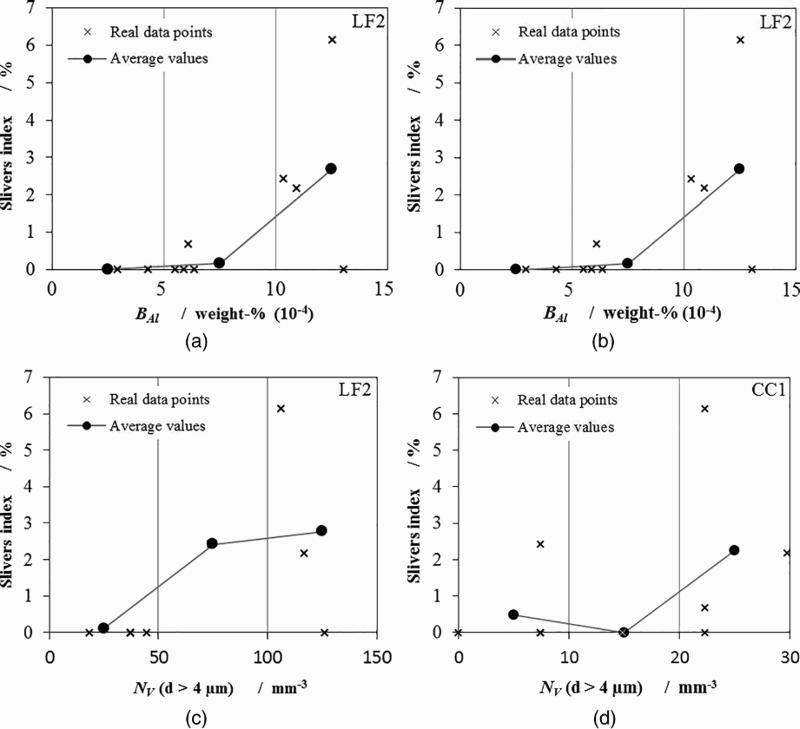
B factor for Al, B Al, and number of inclusions larger than 4 μm, N V (d>4 μm), as function of slivers index in samples a, c LF2 and b, d CC1 of steel grade LDX2101
Conclusions
The focus of this study was the possibility to use the PDA/OES to determine the inclusion characteristics in stainless steels as well as the potential to use this information for process control. A sampling campaign was performed at Outokumpu Stainless, which included sampling from 37 heats of two duplex stainless steel grades. The inclusion composition was studied on selected heats using the PDA/OES method. In addition, a correlation study was performed between PDA/OES data and slivers index. The obtained results can be summarised as follows: In order to facilitate a comparison of the inclusion composition in ternary diagrams obtained with the PDA/OES method, the percentage of the total mass of oxides was calculated and represented as a single value in the diagrams. By using this value, the inclusion composition can be compared in a simplified way between samples taken at the same process step and for the same steel grade. In addition, by collecting more data over time, an operating window can be defined, which could be used for process control. By using the B
Al value obtained by the PDA/OES method, the change of the inclusion situation with process time can be evaluated. The studied heats showed the same tendency of the change in B
Al, confirming the reliability of using this value for a metallurgical evaluation. It was found that B
Al and the number of inclusions larger than 4 μm obtained using the PDA/OES method have a moderate correlation with the slivers index. Moreover, the obtained results indicate that the risk of having slivers increases with an increased value of these parameters.
Footnotes
Acknowledgements
The Swedish Governmental Agency for Innovation Systems (VINNOVA), Jernkontoret–The Swedish Steel Producers’ Association, technical area TO45 and the Hugo Carlsson foundation for scientific research are acknowledged for the financial support. Outokumpu Stainless AB in Avesta is acknowledged for all the contributions and help during the industrial trials and sample evaluation. Finally, Associate Professor Andrey Karasev of KTH is acknowledged for the helpful discussions when carrying out the research.