
Abstract
This paper investigates the non-destructive, experimental determination of mechanical properties, at any location within large steel forgings, through the use of controlled heat treatment. Industrial time–temperature data from heat treatment furnaces have been used as the surface temperature boundary condition in finite element models. The models have been used to determine the thermal history at specific locations of interest within a 95 tonne forging. Application of the predicted thermal history to a laboratory sized sample of material, using controlled heat treatment, results in macroscale material that has an identical thermal history to the points of interest within the forging. This sample material has been mechanically tested and compared to mechanical test results from the forging itself.
Introduction
As a general material classification, steels undergo phase transformations from austenite, at temperatures above the Ac3, to a variety of cooling rate dependent transformation products. During the manufacture of large steel components, large thermal gradients can arise in manufacturing—the most significant arises as a result of water quenching from above the Ac3. Steel components used for the fabrication of pressure vessels are typically thick sectioned and can have a ruling section in excess of 1 m at the quality heat treatment stage. Thus, significant care must be taken (i) to ensure that the centre of the component reaches and is adequately soaked above the Ac3 and (ii) to extract heat from the component as rapidly as possible during quenching, to promote the formation of favourable, non-equilibrium phases such as bainite and martensite. Any thermal gradients that exist can, depending on steel hardenability, result in a through thickness microstructure and mechanical property variation. 1–4 The microstructure variation can manifest itself as a change in the phase distribution and/or a change in scale (coarseness) of a particular phase.
For some safety critical applications, new suppliers and/or first of a kind components necessitate costly, full scale prototypes that are destructively tested. Significant financial and time burdens are associated with prototypes that, once tested, are unfit for use. Thus, it is of great interest to be able to accurately predict mechanical properties at any location within a component without the need to destroy it. There are several potential methods available to undertake such a task, 5,6 and recently, Romero 5 has demonstrated the use of a neural network to predict tensile and impact properties for the low carbon steel, SA-508 Grade 3. Inputs to the neural network are austenite grain size, cooling rate from austenitisation and Larson–Miller tempering parameter. 7 While the effectiveness of the neural network has been validated and the data used to create the network come from rigorous experimentation, it is the opinion of the authors that designers and end users of safety critical components favour physical tests. Training and testing of a neural network requires a significant amount of experimental data with well known provenance, and the network is limited by the bounds of this experimentation.
With that in mind, this study presents the use of thermal finite element (FE) modelling, coupled with controlled heat treatment experiments, to produce material that can be used for mechanical testing. The intention of the experimentation described below is to produce material with a thermal history identical to that of a location of interest, e.g. mid-wall, in a real component. This material can then be mechanically tested to give tensile, impact and fracture toughness measurements.
Experimental
Industrial heat treatment
In this work, a 95 tonne, SA-508 Grade 3, disc shaped forging was subject to an austenitisation, water quenching and tempering cycle, known collectively as a quality heat treatment cycle. All processing was carried out at Sheffield Forgemasters International Ltd, Sheffield, UK. The forging was ∼1 m thick and 4 m in diameter. During heat treatment, four surface thermocouples and four embedded thermocouples (75 mm subsurface) were used to monitor the temperature of the forging.
Surface thermocouples were positioned such that there was a thermocouple at the 0°, 90°, 180° and 270° clock positions, at the periphery of the disc shaped forging. The 0° and 90° thermocouples were on the uppermost face of the forging, while 180° and 270° thermocouples were on the bottom face of the forging, nearest to the furnace hearth. Two of the subsurface thermocouples were positioned beneath the bottom and top surfaces, along the axis of the disc, and labelled TC2 and TC3 respectively. The remaining two subsurface thermocouples were positioned beneath the top surface of the forging, on the periphery of the disc at 0° and 180° clock positions. These thermocouples were labelled TC5 and TC6 respectively. A schematic of the thermocouple locations is given in Fig. 1. Thermal history was recorded by the aforementioned thermocouples during austenitisation, water quenching and tempering.
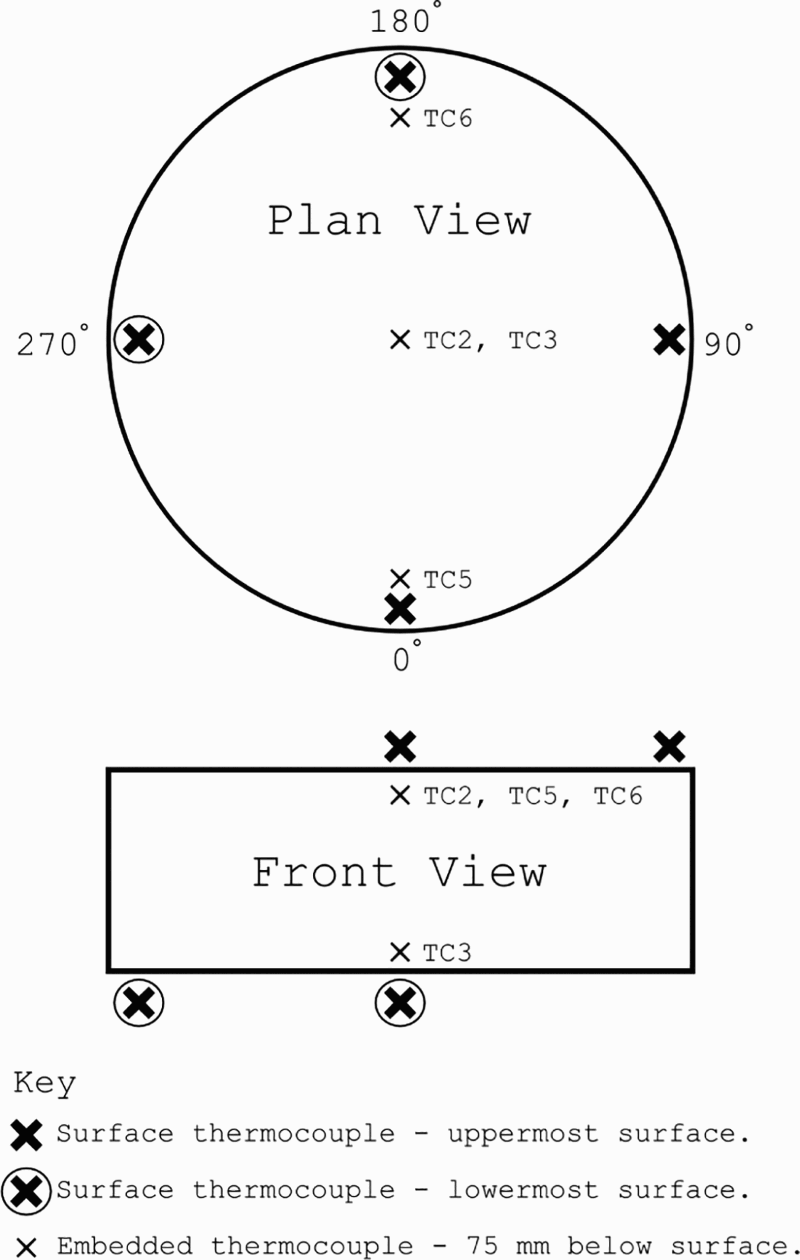
Schematic showing approximate locations of thermocouples (surface and 75 mm subsurface) during quality heat treatment stage of manufacture; peripheral subsurface thermocouples have been offset inboard for clarity
FE models
Without experimental data, FE models can be used to predict temperature evolution within objects through the use of a heat transfer coefficient (HTC) between the object(s) of interest and the environment. This methodology involves making an estimate of the HTC, which can vary as a function of temperature and with location. When experimental data are available, the use of a HTC is negated and the recorded surface temperature data can be used as the surface thermal boundary condition in the FE model. Thus, given the appropriate material property data for the object of interest, an accurate prediction of the thermal history at any location within the object should be possible.
Here, the recorded surface thermocouple data were used as the surface boundary condition of two thermal FE models. Owing to symmetry in the component geometry, two-dimensional axisymmetric models were sufficient. The first model simulated the austenitisation and water quenching, while the second model simulated the tempering. Using the chemistry given in Table 1, JMatPro 8 was used to produce a material file containing the thermophysical properties of SA-508 Grade 3; these properties were used in the FE model. The surface thermal boundary condition applied to the FE models was the average of all four surface thermocouples shown in Fig. 1.
Composition of SA-508 Grade 3 9
Heat treatment and mechanical testing
The accuracy of the two FE models produced was checked by comparing predicted and measured subsurface (75 mm) temperatures. Good agreement would allow thermal history at any location within the forging to be interrogated with confidence. The measured subsurface thermocouple data from TC2, TC3, TC5 and TC6 were compared with those predicted by the FE models (see the ‘Results and discussion’ section).
From the austenitisation and tempering models, time–temperature history was extracted along the axis of the forging at the mid-wall and quarter thickness locations. The data were used as inputs for a series of heat treatment experiments carried out at Sheffield Forgemasters Ltd. A combination of a programmable induction coil (for austenitisation and quenching) and a programmable laboratory chamber furnace (for tempering) was used to replicate the thermal history extracted from the FE models. These heat treatments were applied to material removed from the forging during machining from the as forged geometry to the heat treatment profile (see Fig. 2). A ring of material was removed from the forging, from which samples were harvested. The ring was ∼50 mm thick with internal and external diameters of ∼1200 and 1320 mm respectively. Two circumferential samples were subject to heat treatment; the first was treated as per the thermal history predicted at the axial, mid-wall location, while the second was treated as per thermal history predicted at the axial, quarter thickness position.
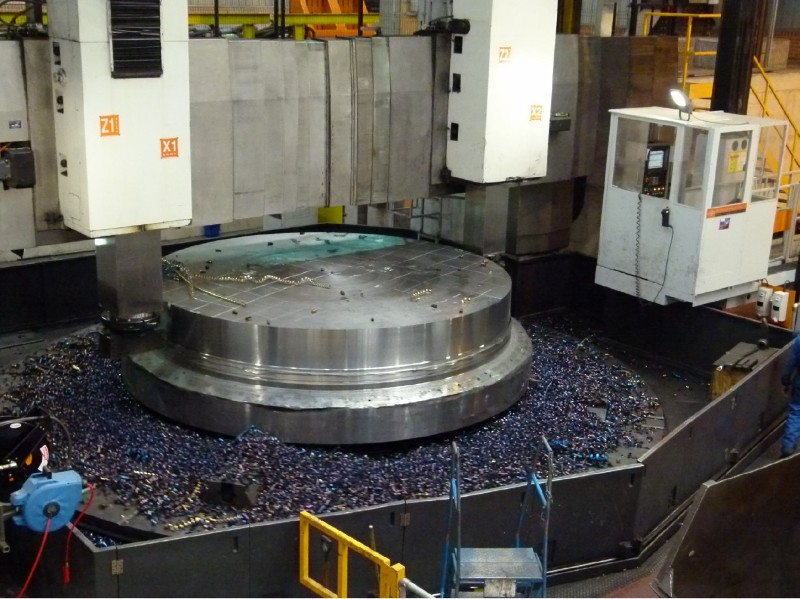
Machining of forging from forged size to quality heat treatment profile at Sheffield Forgemasters Ltd. Material used in controlled heat treatment experiments was removed at this stage
Controlled induction heating was used to replicate, with an accuracy better than ± 10°C, the predicted temperatures during austenitisation and water quenching. Tempering was carried out in a chamber furnace with an accuracy of ± 5°C. Where it was deemed possible, i.e. when doing so was not believed to influence resulting mechanical properties, the thermal cycles were simplified to save time. The two heat treated samples produced were considered to be identical to the specific locations in the forging itself, from both a chemical (ignoring heterogeneities such as macrosegregation) and thermal perspective. Thus, the fully heat treated samples were subject to mechanical testing to determine tensile properties and Charpy impact toughness. Results were compared with those from the forging itself, obtained via destructive testing.
Results and discussion
FE validation
Figure 3 shows the recorded temperature of all four subsurface thermocouples (black lines) during water quenching of the forging from the austenitisation temperature; dashed lines in the figure show the predicted temperatures from the FE model. In all cases, there is a good agreement between the measured and predicted thermal history. At temperatures ∼100°C, it is thought that the artefacts in thermocouple data for TC3, TC5 and TC6 are related to the gas to liquid phase change of the quenching medium (water). While a proven explanation is unavailable, the authors speculate that the artefacts may be related to the release of latent heat. This phenomenon has been observed to occur, at ∼100°C, for many steel components water quenched at Sheffield Forgemasters Ltd. Other phenomena, deemed to be thermocouple reading errors, can also be seen in the figure; TC2 shown in Fig. 3a drops to 200°C and recovers at the beginning of the quench, while TC3 (Fig. 3b ) gives what are believed to be false readings between ∼300 and 100°C. A potential explanation for the apparent speed at which the recorded TC3 temperature dropped to 100°C is water ingress into the glanded thermocouple. This could have occurred just below 300°C and given anomalous temperature readings until boiling stopped below 100°C. While this argument seems reasonable, other causes, such as a poor connection, could just as easily have resulted in the anomalous results.
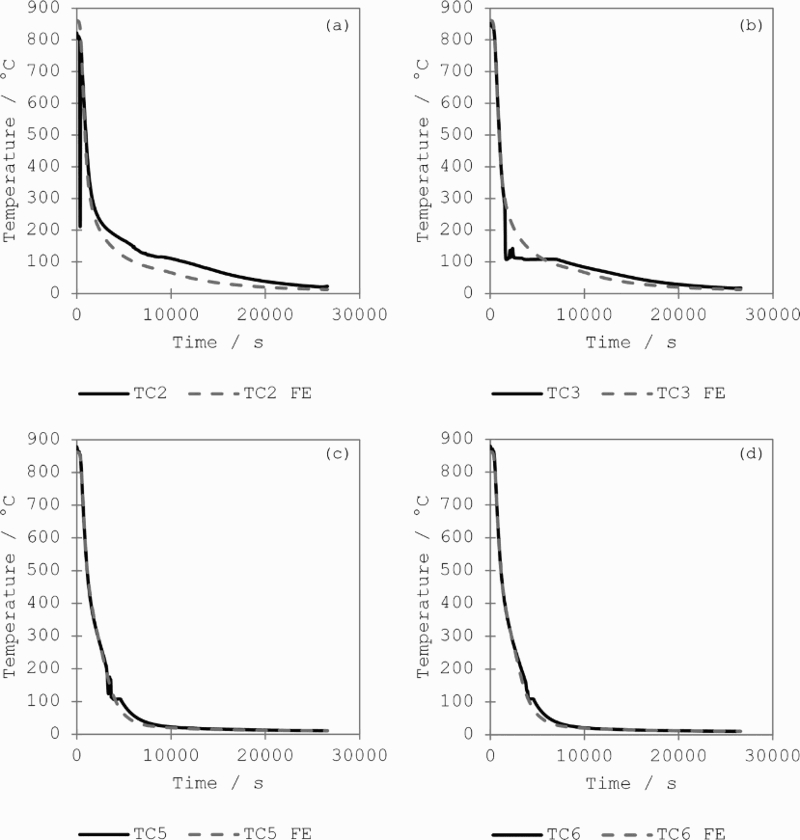
Recorded versus simulated thermal history, 75 mm below surface, during water quenching of 95 tonne disc shaped forging; solid lines give experimental results, and dashed lines give results from FE simulation; a, b thermocouples positioned on axis of forging at bottom and top positions respectively; c, d thermocouples positioned at periphery of top surface of forging at 0 and 180° positions respectively
The largest discrepancy between the FE model and recorded thermal history was observed at the TC2 position, below 300°C. The measured temperatures indicate that the forging cooled down slower than predicted by the FE model. It is apparent that in the vicinity of the TC2 thermocouple, cooling rates below 300°C are slower than predicted; this may be a result of variation in local agitation conditions. Although the deviation is present, its overall influence is believed to be slight. This is because all diffusion driven phase transformations have already taken place above 400°C—the Ms temperature of SA-508 Grade 3. 1 Significant discrepancies between the measured and predicted temperatures in this location were only observed below ∼250°C.
Predicted thermal profiles
Of greatest importance to the development of the microstructure and mechanical properties within the forging was the cooling rate during water quenching. The base microstructure produced during quenching was tempered to give final properties. While the full details of the austenitisation process given to the forging in this work are commercially sensitive, a comparison of cooling rates during water quenching gives insight into the process and highlights the significant differences.
From the austenitisation temperature, the 90° surface thermocouple had a t 85 cooling rate of ∼150 K min− 1. The FE model of the water quench was used to determine the axial mid-wall and quarter thickness cooling rates. The slower cooling rates in these regions meant that at temperatures < 600°C, phase transformation and the associated thermal arrest caused the cooling curves to deviate significantly from linear. Thus, for comparison, the t 86 cooling rates were determined. These are shown in Fig. 4 and were calculated as 3.5 and 5.8 K min− 1 for the mid-wall and quarter thickness positions respectively.
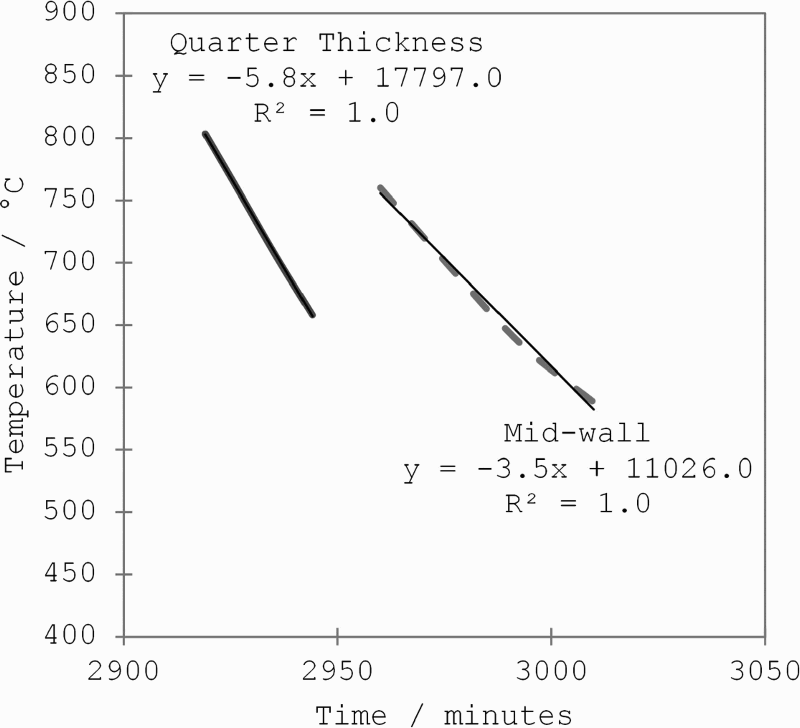
Predicted t 86 cooling rates on axis of forging at quarter thickness and mid-wall positions; equations and R 2 values for linear trend lines adjacent to each cooling curve
These results highlight the two orders of magnitude difference in cooling rates experienced by the forging during the water quenching process. Indeed, the surface t 86 cooling rate (measured) is ∼43 times faster than at the axial, mid-wall location (from FE modelling) between 800 and 600°C. The non-linear thermal profiles predicted at the mid-wall and quarter thickness axial locations were applied to two samples extracted from the forging during machining. Two samples were thus produced using controlled induction heating, one with a t 86 of 3.5 K min− 1 and one with a t 86 of 5.8 K min− 1.
Figure 5 shows the FE predicted thermal history of the axial, mid-wall and quarter thickness locations during the tempering cycle; it can be seen that, for this particular process, the thermal history of both locations is very similar. As a result, a simplified cycle was applied to both of the above samples simultaneously in a laboratory chamber furnace. During heating, time at temperature below 550°C (the lower plateau in Fig. 5) was not considered to be critical and neither was the cooling rate below 300°C. Hence, the temper cycle applied to the two samples was simplified, heating to 550°C was more rapid than shown in the figure, and, below 300°C on cooling, the samples were allowed to furnace cool. This simplification was done to expedite the experiment without affecting the metallurgy of the samples.
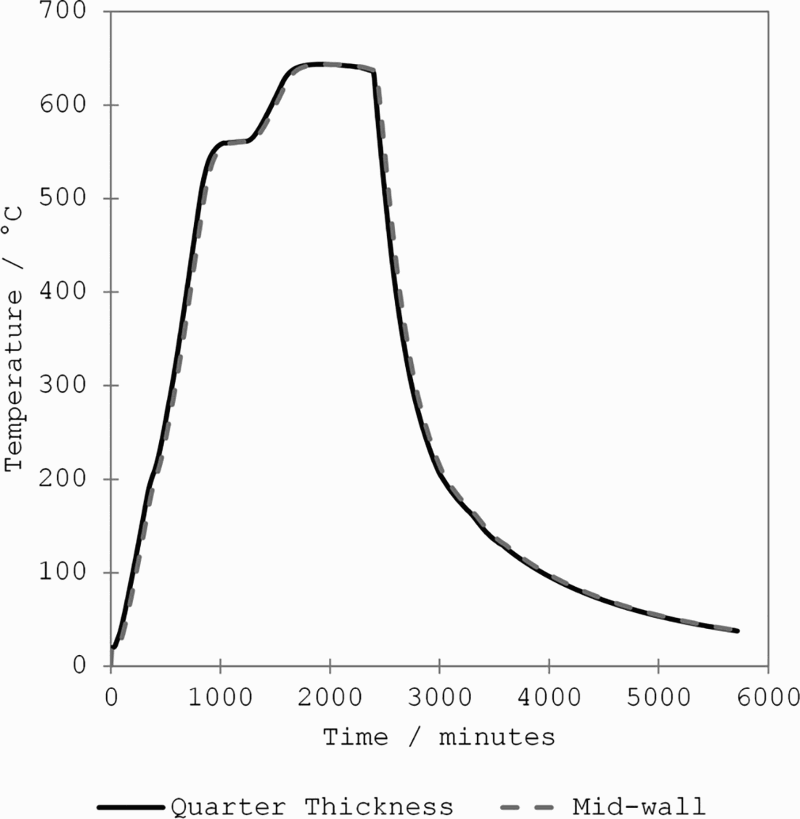
FE predicted thermal history of mid-wall and quarter thickness locations during tempering
Microstructure and mechanical properties
The microstructure at mid-wall and quarter thickness, on the axis of the 95 tonne forging, is shown in Fig. 6a and b . The material from these regions was obtained by sectioning a trepanned core (200 mm diameter), taken through the thickness of the forging (∼1000 mm). Microstructures obtained from the controlled heat treatment experiments are shown in Fig. 6c and d ; the microstructures are in good agreement with those observed in the forging. In all cases, microstructure at both the mid-wall and quarter thickness locations is similar, consisting of a mixture of ferrite and spherodised pearlite—this is unsurprising given the similarities in predicted thermal profiles of these regions during heat treatment.
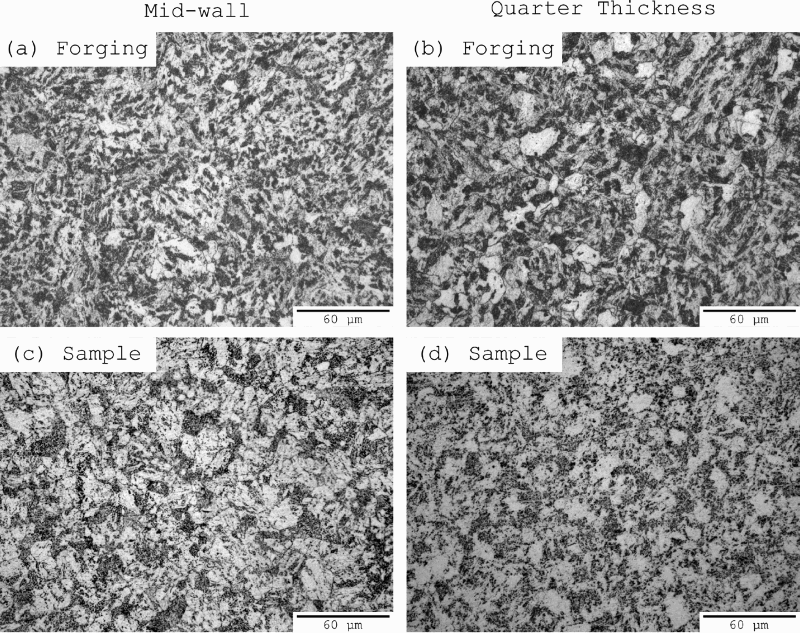
Optical micrographs of quarter thickness and mid-wall microstructures for 95 tonne forging and controlled heat treatment samples
While microstructures are indeed similar, the major interest of this work is the comparison of mechanical properties—these can be influenced by features in a microstructure that are not apparent without the use of advanced metallographic techniques and significant magnification. Thus, a comparison of mechanical test results is shown in Fig. 7. All mechanical testing was carried out at Sheffield Forgemasters RDTesting Ltd, a UKAS accredited test facility. Figure 7a shows the comparison of the average 0°C circumferential Charpy impact tests between the forging and the test material. At the axial mid-wall and quarter thickness positions, three impact specimens were taken from the forging and six from the thermally controlled test material. Error bars indicate the expanded uncertainty of measurement (95% confidence) calculated in accordance with BS EN ISO148-1. 10
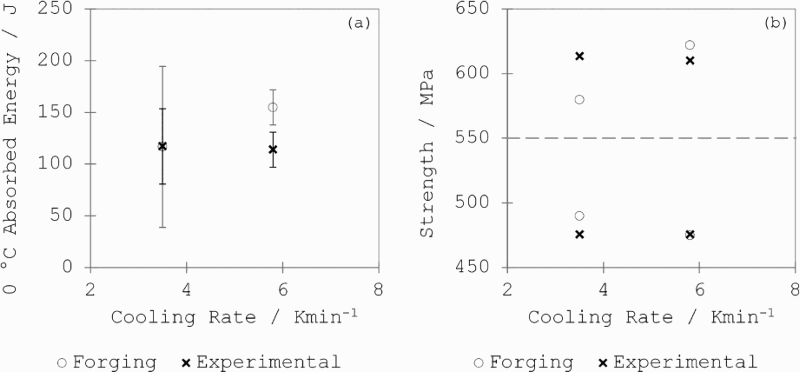
Comparison of mechanical test results at mid-wall and quarter thickness locations for test material taken from finished forging (open circles) and material subject to QHT cycles predicted by FE (crosses): a 0°C test temperature and circumferential Charpy impact; b yield strength (below dashed line) and tensile strength (above dashed line) comparisons
At the mid-wall position (3.5 K min− 1), there is excellent agreement between the forging and test material, although the error bars indicate a larger scatter in results from the forging, compared to those from the more consistent test material. At the quarter thickness position (5.8 K min− 1), a marked reduction in scatter is observed in the results from both the forging and the test material; the expanded uncertainty in both cases is ± 17 J. This corresponds to an uncertainty of ± 11% for the forging results and ± 15% for the experimental results. The average absorbed energy was larger in the forging compared to that of the test material even when uncertainty was considered, i.e. there is no overlap in the data. However, the gap between the two datasets (including uncertainty error bars) is 7 J, and this difference could be comfortably bridged if further Charpy tests showed modest variation from the ones reported here and thus increased the measurement uncertainty.
Figure 7b shows the comparison between yield and tensile strength at the two cooling rates. For each cooling rate, a single tensile test was performed. Agreement between the two datasets is excellent, with a maximum difference between the forging and the test material of 5.8%. It is well known that tensile test results are considerably less variable than Charpy impact results and this is why international testing specifications typically call for only one tensile specimen in each location compared to three or more Charpy test samples. 11,12 Upon review of the mechanical test data generated and the similarities between the microstructures presented in Fig. 6, the test material produced on a laboratory scale has been shown to be representative of the material from the forging itself.
Conclusions
It has been demonstrated that controlled heat treatment of laboratory sized samples, using thermal history derived from validated FE models, can be used to produce material with microstructures and mechanical properties that compare well with those found in a 95 tonne forging. The laboratory samples were taken from the forging itself, during machining, and were thus deemed to have equivalent chemistry and thermomechanical processing. Excellent agreement has been observed between test samples and quarter thickness/mid-wall positions in the forging; the methodology employed here could be easily used to predict mechanical properties and microstructure at any region of interest within the forging. The production of an accurate FE model is key to the success of the laboratory experiments, as is adequate thermal control of the samples; in this work, thermal control was achieved through a combination of controlled induction heating and programmable chamber furnaces. While it is acknowledged that significant further testing and comparisons will need to be made between full scale components and their laboratory sized analogues, a combination of validated thermal FE models and controlled heat treatment experiments has been shown to be a plausible means of predicting mechanical properties in large components, without the need for destructive testing.
Footnotes
Acknowledgements
The authors would like to thank Innovate UK, the Department of Energy & Climate Change (DECC), the Nuclear Decommissioning Authority (NDA) and the Engineering and Physical Sciences Research Council (EPSRC) for their financial assistance with this work as part of Technology Strategy Board project TSB101426.