
Abstract
For over a century, rolling contact fatigue in bearings has been recognised as a key feature limiting bearing life. The phenomenon is manifested through dark etching regions, 30 and 80° white etching bands as well as white etching areas, the latter often forming intricate defects commonly referred to as butterflies. Their presence depends on testing conditions, such as contact pressure, temperature, number of revolutions and steel cleanliness. Microstructural inspection demonstrates that precipitate shearing, dissolution, cell and nanocrystal formation as well as matrix/inclusion debonding may take place throughout bearing life. Such microstructural features have a negative effect on bearing hardness, strength, ductility and toughness, usually preceding failure. The present review shows how such phenomena are interconnected, highlighting the need for integral characterisation and modelling across the scales. This will aid in the conception of new heat treatments, steel grades and microstructures for enhanced rolling contact fatigue, leading to increased bearing life.
Keywords
Rolling contact fatigue and bearing steel properties
Over 130 years ago, Hertz recognised some of the key parameters controlling rolling contact fatigue: contact pressure and geometry as well as the mechanical properties of the material. 1 The last century has seen an exponential increase in the use of bearings for a variety of applications. It is now known that contact pressure,2–5 temperature,6–8 number of revolutions3,4 and steel cleanliness 9 play a key role in rolling contact fatigue. The present paper focuses on subsurface damage microstructural changes; surface initiated damage is not considered.
The seminal work of Jones shows that when tempered martensite becomes heavily deformed during rolling contact loading, bearing hardness decreases, and failure takes place. 10 Further work by Bush and collaborators showed that hardness prominently decreases in the microstructure altered zone under the surface, which is composed by both a damaged area and a non-altered microstructure well below the subsurface. 2 Lund demonstrated that the degree of softening depends on the extent to which the dark etching region (DER) has formed (Fig. 1a). 11 Conversely, Swahn et al. reported an increase in hardening before softening. 3 Sugino et al. claimed that the increase stemmed from the transformation of retained austenite into martensite. 9 Zwirlein and Schlicht reported that a minimum in hardness is present at a certain distance from the surface, and that such distance decreases with the number of revolutions. 4
As a result of rolling contact, residual stress appears under the surface. This displays a compressive component reaching a maximum at a certain depth, whose value depends on the contact pressure and running time. If the contact stress becomes smaller, then the peak stress appears at a shallower depth and with decreased magnitude. An interesting fact is that the residual stress is observed beyond a threshold stress under which no microstructural changes are seen. As the contact stress increases, the residual stress develops quickly, and under very high contact stress (∼6 GPa), full residual stress develops after a few cycles without structural alteration. 2 Voskamp showed that the state of the residual stress mainly spans in two dimensions: tangential and normal to the surface; the latter suggested to be the driving force for crack growth. 6
According to the work of Voskamp, a preferred microstructure orientation develops under the surface before white etching band (WEB) formation. 6 He showed that texture is caused not by accumulated subsurface forward flow but by reversed plastic flow in each load cycle or by dynamic recrystallisation instead. The developed texture depends on the rolling contact loading condition. {100}〈110〉 and {111}〈112〉 textures were found in structurally altered (dark etching) regions, and WEBs form in areas with significant {111}〈112〉 texture (the plane {hkl} is parallel to the contact surface, and the direction 〈uvw〉 corresponds to the over-rolling direction). Crack development is believed be related to subsurface texture. Spalling restricted to pits is found with no microstructural change. When there is significant {100}〈110〉 texture, a flat spall bottom appears, which implies that the cleavage planes are oriented parallel to the rolling direction. On the other hand, irregular crack formation is observed in the spalling with {111}〈112〉 texture.7,8
Phenomenology
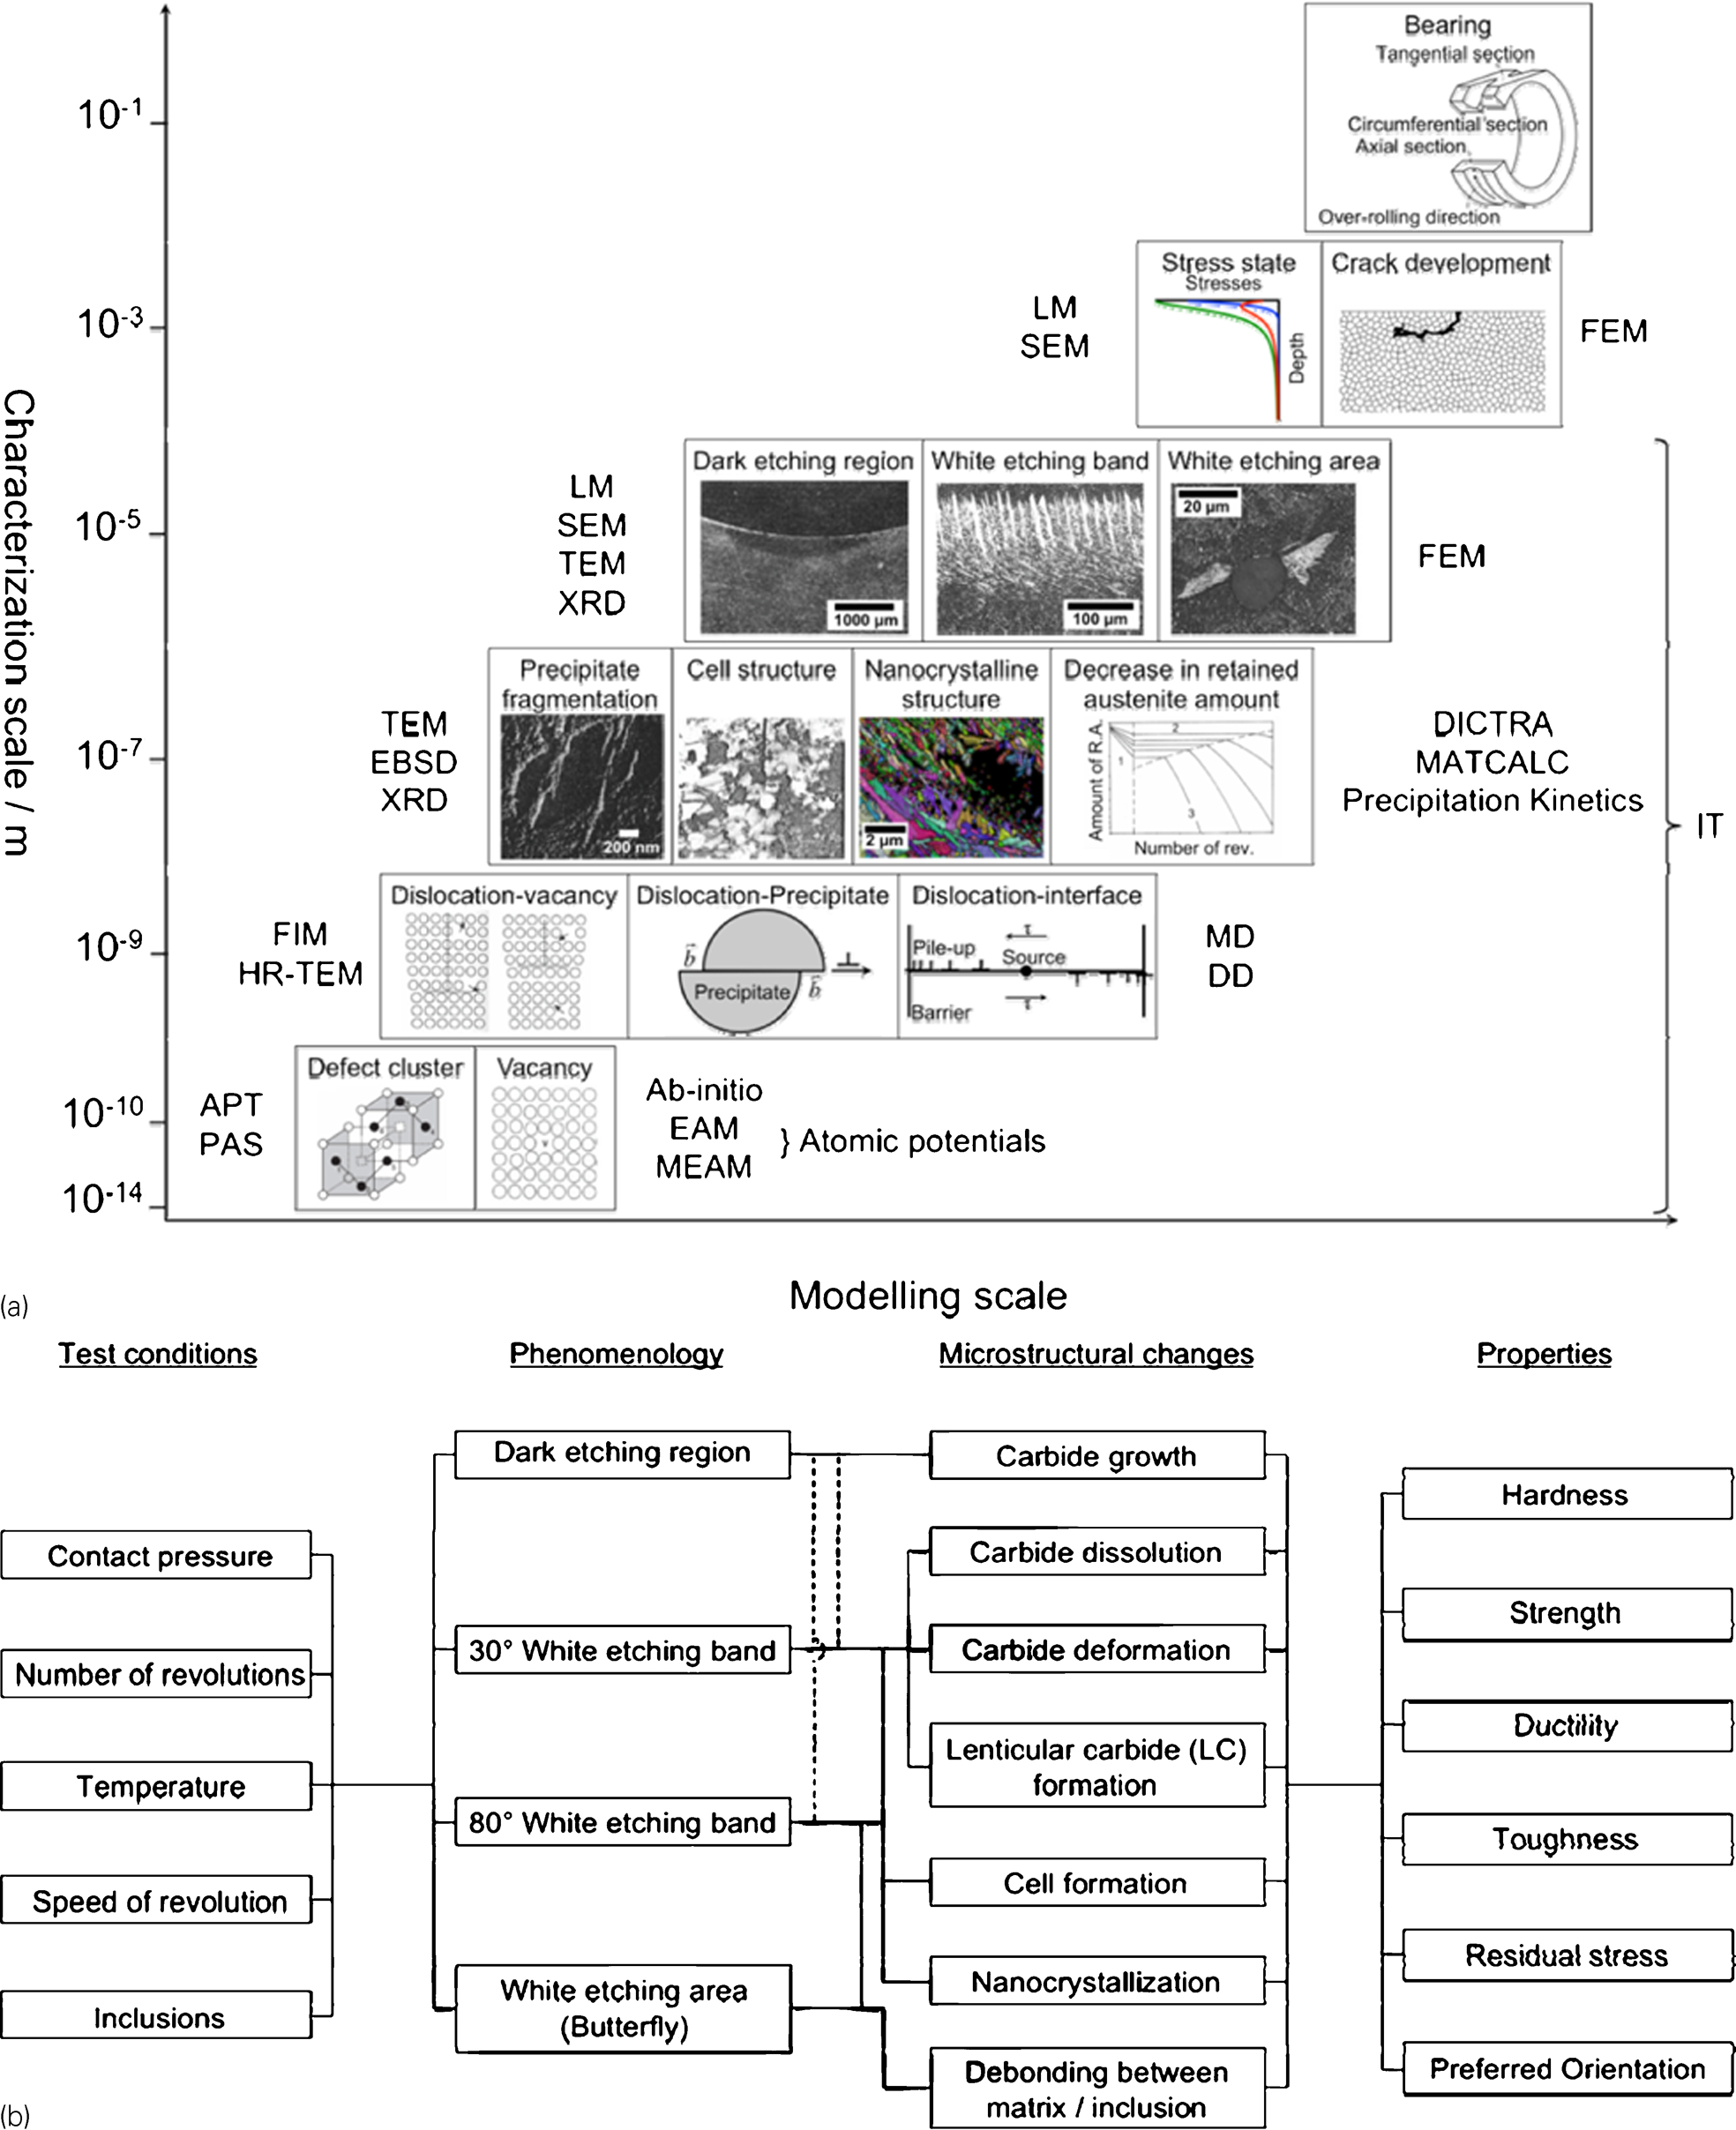
Most of the observed properties and their changes are attributed to variations in the microstructure of run bearing steels. When seen under the optical microscope, which has resolution on the order of a micrometre, DERs, 30 and 80° WEBs and white etching areas (WEAs) can be seen. All the microstructural features across the scales are summarised and exemplified in Fig. 1a.
Dark etching region
First observed by Jones, a DER is identified by a dark contrast area under the optical microscope when etched with nital and picral. 10 It is followed by WEBs and remains throughout the running cycle. 3 It is seen at a depth of tens to several hundreds of micrometres under the surface.3,9,10 It has been attempted to relate the presence of a DER with that of the highest stress under the surface, but it has not become clear which stress components are responsible for it.2–4 Its depth is ∼2 mm and increases with cycling time and contact pressure.2,3,10 The region is not uniformly distributed but scatters over a certain area that increases with cycling time and contact pressure.9,10 The DER grows by transformation of new volumes, in which development increases with load; 2 they consist of elongated patches that become more frequent with the number of cycles. 3 Sugino et al. believed that the newly transformed patches were oriented in the direction of undamaged martensite platelets, while Voskamp found them to have various orientations.7,9 Swahn et al. and Österlund and Vingsbo reported such transformed regions to be fresh ferrite sized 0·1×1 μm in the circumferential section3,18 (Fig. 1a). Since the DER is made of two components, i.e. fresh ferrite patches and the martensite matrix, it was speculated that preferential etching of closely spaced phase boundaries or a different etching rate between the two phases yields the dark contrast. 3 On the other hand, Schlicht et al. observed slip marks in the DER; they were orthogonal to each other and at an angle of 45° from the surface. It was believed that a darker contrast was formed with an increased number density of such marks. 5 The mechanism of DER formation has been reported to stem from steel tempering due to repeated heating on cycling. 10 However, it is more likely to result from yielding or plastic flow;2,19 this is supported by the existence of a threshold stress under which no structural alteration is found.4,6,11 Voskamp claimed that the DER formation is related to the migration of carbon from the martensite matrix to the heavily dislocated region. 6 Another view is that it forms by additional stress due to forced sliding. 4
30° white etching bands
The WEBs have been observed with and without being preceded by a DER.3,10–12 Lund speculated that 30° WEBs form after matrix softening, and the formation of a DER is not necessary in the case of a soft matrix. 11 The band is characterised by a smooth grey or light contrast region under optical microscope and scanning electron microscope (SEM).2,3,10,12,18,19 The bands are believed to have a disc morphology, which are shown as horizontal plates in the axial section and as inclined plates in the circumferential section.2,3,6,10–12 The bands are inclined towards the bearing rolling direction, and they can be classified into two types, depending on the angle between them and the surface: 30° WEBs (usually 20–35° from the surface) and 80° WEBs (65–85° from the surface). Both bands show no carbides but a cell structure within them instead.3,6,12 Based on the contrast under optical microscope, the phase within them is presumably ferrite. 3 Moreover, both bands have the same carbon content (0·06 wt-%) lower than the matrix (0·55–0·6 wt-%), 20 which is unexpected due to the fact that the bands are reported to have higher hardness.11,19
According to Martin et al., 30° WEBs appear 200–760 μm from the surface and display maximum density 230–400 μm from it. The density increases with cycling time and does not seem to be related to the life of the bearing. A threshold pressure exists as in the case of DER appearance. 12 Swahn et al. reported that the approximate dimensions of each band are 5–30 μm in length by 0·1–0·5 μm in thickness and that their spacing is 0·5–10 μm, but Voskamp reported a thickness of 2 μm.3,6 The 30° WEB is often observed along with lenticular carbides (LCs), which are parallel to or surround the band.2,3,12,20 If tempered, 30° WEB cannot be distinguished from tempered martensite, implying that 30° WEB is a carbon supersaturated region that forms carbides during tempering. 3 The 30° WEBs are sometimes seen to extend across the primary carbide/matrix boundaries. 3 When the 80° WEBs are formed, numerous 30° WEBs are observed along with them, often merging each other. 3
80° white etching bands
Once the highest density of 30° WEB is achieved, the 80° WEB form closer to the surface. 4 Each 80° WEB occupies a larger area than the individual 30° WEB. Swahn et al. investigated ∼10×100 μm sized bands with 5–50 μm spacing, and Voskamp observed the band to be of ∼10 μm length.3,6,11,20 When formed, 80° bands may penetrate through the 30° WEBs. Among the cell structures within the bands, the cells at the edge were elongated in the 80° direction. 3
White etching areas
The WEAs form around non-metallic inclusions and cracks. 9 Their extension around inclusions resembles the wings of a butterfly, the body of which corresponds to the inclusion itself. The frequency of butterflies depends on the composition, shape and inclusion size, and the size and number of WEAs increase with running time. 9 Typical WEA sizes range between 5 and 15 μm, 21 and the region where they form is in between the surface and 1·5 mm below it; such depth increases with the number of cycles. 9 Butterflies are inclined by ∼45° from the surface towards the rolling direction.9,13,21 While DER and 30 and 80° WEB formations succeed each other, WEAs can form before DERs do. 9 When formed along with a DER, it has been reported that the WEAs are absent at the depth where the highest DER contrast is appreciated. Therefore, it has been suggested that the formation of DERs prevent that of a WEA. 9 The boundary between a WEA and the matrix is sharp, and the structural alteration is limited within WEAs. 22 When butterflies are present, two types of boundaries are found; one contains a microcrack across which the sudden microstructure change occurs, and the other shows a gradual alteration without a crack.9,13,21 The microcrack is believed to form at the matrix/inclusion interface and propagates around the so called wings. 21 Sugino et al. claimed that the microcrack may be a prerequisite for WEA formation. 9 The LCs surround the WEA, but no temper carbide has been observed within it.13,22 The area consists of very fine microcavities, ferrite grains and elongated primary carbides. These grains vary in size and are found to get smaller from the region near the inclusion to that near the wing tip.13,21 While Schlicht claimed that the formation is caused by local heating, Grabulov et al. demonstrated that the local misorientation in WEAs was smaller than that of the matrix and suggested the formation through low temperature recrystallisation assisted by plastic deformation.5,13 In addition, Grabulov et al. observed high local misorientation sites along the wing and speculated that they may act as crack nucleation sites. 13
Microstructural changes
Changes in carbide morphology and population are among the most obvious transitions during rolling contact fatigue. Martin et al. reported an increase in size and number density of carbides in the deformed region with the number of revolutions; he argued that this was due to the additional 100°C tempering in service. 12 However, dissolution, deformation and reprecipitation of carbides are the most commonly accepted transitions. Dissolution of primary carbides has been repeatedly observed; some authors have reported their number density reduction or even absence in WEBs and WEAs.9,12,19,21–24 Carbide distortion has also been reported.2,9,19,24 Sugino et al. suggested that mobile dislocations alter the carbide/matrix coherency and that they shear carbides, while Bush et al. believed that the intrusion in carbides and extrusion beside them are attributed to the alternating fine slip within the coarse slip bands.2,9 In study of Swahn et al., the 30° WEBs are reported to penetrate carbides. 24 In addition to carbide dissolution, thin elongated stringers or LCs can be seen, mostly sandwiching WEBs or surrounding WEAs.2,3,9,12,18–20,22 The depth of the highest density of LCs (300–350 μm) agrees with that of WEBs; such density gradually grows with the number of revolutions. 23 The LCs occupy ∼21% of the matrix beside the WEBs, and their carbon content is 1·55–1·65 wt-%. 20 While Grabulov et al. postulated that the LCs originated from the deformation of primary carbides, Martin et al. suggested that they were newly formed because of their large size; hence, reprecipitation was suggested to take place.12,21 Different mechanisms of carbide dissolution and formation have been introduced by several authors, but not all of them have been confirmed; such mechanisms involve carbon supersaturation and migration, which are fostered by high dislocation or vacancy densities stemming from the severely deformed structure.9,23,24
Dislocation cell structures are observed in DERs, 9 WEBs12,18 and WEAs. 22 The cells are polygonal and elongated, 9 and their size is 50–100 nm.12,18,22 Moreover, they are surrounded by tangled dislocation walls, and their internal dislocation density varies. 12 While Sugino et al. inferred from the contrast of electron micrographs the presence of large angle tilt boundaries between the cells in DERs, Martin et al. observed a ferrite ring diffraction pattern in the cell regions and demonstrated misorientation of ∼2° by analysing diffraction patterns.9,12 Concurrent with a variation in ferrite cell size, the possibility of nanocrystallisation (recrystallisation around room temperature) was introduced by Grabulov et al. As the crack tip was approached, the grain size was 10–50 nm, and it becomes 500–1000 nm far away from it. Sometimes, an amorphous-like region was reported. All the regions showed ring diffraction patterns. The authors claimed low temperature recrystallisation assisted by large dislocation density and large point defect concentration due to severe plastic deformation.13,21 This view is supported by Kvam and Först et al., who sustain the possibility of low temperature recrystallisation under the extreme supersaturation of vacancies.14,25
Grabulov et al. investigated debonding between matrix and inclusions and concluded that it plays an important role in deformation before WEA formation. Furthermore, they suggested that the onset of microcracks seems to follow matrix/inclusion decohesion.13,21
The microstructural changes described in this section are related to the phenomenology introduced in the section on ‘Phenomenology’. There is a direct correlation between phenomena and microstructural changes; these are indicated by the solid lines joining them in Fig. 1b. The dotted lines highlight phenomena occasionally but not generally occurring together. For example, 30° WEBs appear along with carbide dissolution, deformation and LC formation, but the 30° and 80° WEBs are not always accompanied by a DER. The test conditions are all related to the phenomena; similarly, all the microstructural changes are related to all the properties. Their weighted contribution can only be determined by dedicated experiments focusing at various scales, and these must be combined with modelling across the scales.
Multiscale analysis
Experimental techniques
Millimetre scale
The phenomena described in the section on ‘Phenomenology’ can be inspected with the aid of light microscopy. Usually, nital and picral etchants are employed. The DERs and WEBs are identified by their contrast.3,9–11,18,19 The directionality and distribution of WEBs can be appreciated via light microscopy. In the case of WEAs, Sugino et al. used saturated picral with several drops of nital. 9
Micrometre scale
Using SEM, the details on each region can be highlighted. Slip bands and cementite fragmentation are seen.2,5 Carbide dissolution and formation have been tracked by the replica method. 19 Sugino et al. have employed electron probe microanalysis to figure out inclusion composition, while Grabulov et al. used focused ion beam to reconstruct the three-dimensional (3D) morphology of a WEA.9,21 Electron backscatter diffraction is another powerful technique to observe grain morphologies and local misorientation. 13
Nanometre scale
Transmission electron microscopy can be used to investigate the structures within WEBs, WEAs and LCs; cell structures or nanosized grains can be resolved.3,9,12,18,21,22,24 Since fatigue damage is localised at a certain depth under the surface, sample preparation plays a significant role. Martin et al. and Sugino et al. ground the surface to the depth of interest and then ground the opposite side to desirable thickness followed by electropolishing.9,12 O'Brien and King found a WEA first and then ground the opposite side to observe it. 22 The replica method has also been used for carbide characterisation, 24 and selected sections on samples can be prepared by focused ion beam. 21
X-ray diffractometry (XRD) is one of the indirect techniques to understand the material properties. The determination of austenite and ferrite fractions can be performed, and material softening can be determined from peak broadening. Preferred orientations can be obtained from the relative intensity ratio or by adopting grazing incident beam X-ray diffractometry. Peak shift analysis enables residual stress measurement, and together with an appropriate material removal technique, stress gradient information is obtained.6,7 Lattice strain and domain size determination may be performed with the Williamson–Hall method 26 and by deconvolution of peaks into microcrystalline and nanocrystalline contributions. 27
Atomic scale
Atom probe tomography and field ion microscopy enable atomic scale analysis. For example, Cottrell atmospheres can be imaged by 3D atom probe tomography, and dislocations can be visualised as helices by field ion microscopy. 28 A possibility for carbide analysis lies in adopting Mössbauer spectroscopy since the spectra are controlled by the neighbourhood of Fe atoms in solid solutions or compounds, and it is useful in determining cementite fraction and carbon atom positions in ferrite.29,30 Some experimental studies have suggested that many of the phenomena occurring at larger scales are triggered by vacancy supersaturation due to particle/matrix rubbing.13,21 Such particles include primary precipitates and inclusions. Positron annihilation spectroscopy may be employed to quantify the supersaturation of vacancies and to identify the nature of vacancy solute clusters.
Hori and Oshima studied the development of vacancy clusters in austenitic stainless steel after fatigue exposures of different durations. They found a correlation between the development of vacancy clusters (studied by measuring positron lifetimes using positron annihilation spectroscopy) and fatigue life. They concluded that the generation of fatigue microcracks and crack embryos may occur as a result of the formation of 3D vacancy clusters. 31 Egger et al. also studied the development of vacancy clusters beside fatigue cracks in technically pure, cold worked, copper. The experimental technique they used (scanning positron annihilation microscopy) allows the determination of vacancy cluster concentrations with a high spatial resolution (∼5 μm). There is a noticeable increase in the concentration of vacancy clusters in the plastic zone that stems from the propagation of fatigue cracks. 32 Egger et al. confirm the long held assumption that a large quantity of point defects form during the fatigue process and that they play a central role in the failure process. These techniques can readily be employed to study the onset of rolling contact fatigue at the very atomic scale.
Modelling approaches
The complex phenomenology described here has not yet been addressed via modelling at various scales. Below, we present a range of techniques that can be employed for this purpose, with some specific examples of their use in various systems.
Atomic scale
The lowest scale controlling rolling contact fatigue starts at the electron and atomic levels. As discussed above, the interaction of dislocations with vacancies, interstitial and substitutional atoms and aggregates of these influences fatigue. Dislocations glide and vacancies migrate; all these phenomena may now be quantitatively studied. The kinetic energy barriers to the diffusion of point defect cluster concentrations in bcc iron supersaturated with carbon have been analysed by Kabir et al. Employing ab intio calculations, they showed that only mono vacancies, divacancies and clusters of point defects containing one vacancy play a role; they indicated that a reduced self-diffusivity in bcc iron stems from increasing carbon in solid solution. This observations diverge from observations in fcc iron, providing an explanation for the carbon dependence of (dislocation) creep rate in ferritic steels.33,34 Additionally, atomistic calculations employing the embedded atom method or the modified embedded atom method may aid in economising such computations. 35
Nanometre scale
Molecular dynamics (MD) and dislocation dynamics may be employed to study the interaction of dislocations with each other, with nanoprecipitate particles and with the crack tip. For example Chang and Fang analysed the tensile and fatigue behaviours of nanoscale copper at various temperatures using MD simulation. 36 Nishimura and Miyazaki performed the MD simulation of α-Fe to examine the mechanical behaviours around a crack tip for a system containing both a crack and two tilt grain boundaries under cyclic loading. 37
Micrometre scale
The phenomena occurring at this scale have been the traditional focus of microstructural modelling in metallurgy. The most visible microstructural changes occurring during bearing fatigue, such as precipitate fragmentation, dissolution and recrystallisation, can be addressed by employing multicomponent kinetics methods and commercial software (e.g. ThermoCalc, DICTRA 38 and MATCALC 39 ). These can be combined with multicomponent and multiphase kinetics strategies to quantify the overall transformation kinetics.40–42
Unified multiscale approach
All scales ranging from atomic to the millimetre level can be bridged with the aid of a single framework employing irreversible thermodynamics.43,44 Dislocation gliding, annihilation and generation, combined with the migration of grain boundaries (e.g. precipitate/matrix dissolution or recrystallised grain/matrix kinetics) and crack growth, are all dissipative processes that can be formulated by employing an irreversible thermodynamics approach linking various scales. These can be fed into finite element methods to capture the 3D complexity of fatigue in bearings.15,45,46
Summary
Rolling contact fatigue in bearings is a long recognised issue with a deep impact in technology. The problem is complex as it displays phenomena at various scales. Spalling and pitting are manifestations of microstructural changes occurring under the rolling surface. White etching bands, areas and DERs are usually associated to precipitate fractioning, dissolution, reprecipitation, dislocation recovery and recrystallisation. Many of these changes take place only at the scale of a few nanometres but cause cracks growing up to several millimetres. The pace of the phenomena is dictated by contact pressure, temperature, number of cycles and the nature of the initial microstructure. Thermodynamic based models are now able to link all these phenomena. By extracting fundamental activation energies determined at the electron level, estimating interfacial mobilities at the nanometre scale and determining overall microstructure kinetics, the phenomenology of rolling contact fatigue can be quantitatively described. A range of experimental techniques may aid in calibrating the models. The ultimate aim being increasing bearing life is now an attainable ambition by harmoniously combining modelling and experiments at various scales.
Footnotes
Acknowledgements
The authors are grateful to Professor L. Greer for the provision of laboratory facilities and to SKF for the financial support. P. E. J. Rivera-Díaz-del-Castillo is grateful to J. Beswick for access to his scientific paper archive and for stimulating discussions.