
Abstract
Forming and fracture limits of an AA 3104-H19 aluminium alloy sheet were studied by hydraulic bulging and Marciniak type deep drawing and tensile tests. The alloy appeared to be highly anisotropic, exhibiting distinctly different fracture patterns in the rolling and transverse directions. The preferred fracture direction was transverse to the rolling direction. In the tensile test, samples loaded in the rolling direction failed transverse to the rolling direction, but in the transverse direction, the fracture was inclined at ∼55° to the tensile axis. In some cases, two such competing fractures in the characteristic directions could be observed. Scanning electron microscopy studies revealed a typical ductile fracture pattern. The fracture occurred by shearing in the through thickness direction, and typical alternating shear lips in a direction inclined at ∼45° to the through thickness direction could be observed. Forming limit diagrams for both rolling and transverse directions were determined from the experiments. The measured limit strains in uniaxial tension were predicted well by the modified Rice–Tracey theory, but in equibiaxial tension, the theory overestimated the fracture limit strains.
Introduction
The forming limit diagram (FLD) concept is often associated with the thesis of Keeler in 1961 and subsequent publications by Keeler and Backofen.1 They even claimed that a single forming limit curve applies to all soft metals. The left hand side was complemented by Goodwin2 in 1968. However, the concept appears to be much older. Very detailed information on necking limits for low carbon steel was published as early as in 1946 by Gensamer3 in his Campbell memorial lecture. Gensamer even showed that decreasing grid size gave increasing limit strains and that ‘zero grid size’ gave a downwardly sloping fracture curve, which has subsequently been confirmed independently by many authors. Somehow, however, this information was overlooked for ∼15 years until a great revival of interest took place at the end of 1960s, after Keeler and Goodwin published their results. Since then, a huge number of papers have been published on the topic. Some of the early work was summarised by Painter and Pearce.4 Lankford et al.5 studied aluminium in his thesis and published schematic FLDs, which look very modern. Wu et al.6 reported experimental results on FLD for an AA 3104 aluminium alloy and got a fairly good agreement with their theoretical predictions. More recently, Aretz7 reported results for several aluminium alloys. He also used the experimental data of Wu et al. to compare his theoretical predictions for AA 3104 alloy. However, since Wu et al. did not give any details on how their FLD measurements were made and since the results are known to depend strongly on the method of measurement, it was decided to carry out some further experiments in this work.
Prediction of forming and necking limits
In a series of papers, Hill 8 8,9 developed criteria for the uniqueness and stability of plastic flow in rigid plastic solids. Under all around dead loading, Hill's criterion seems to coincide with the earlier criterion of Swift, which required a simultaneous load maximum in both principal stress directions.10 For localised necking, Hill 11 11,12 had earlier derived another criterion. Since the governing equations in the stretch forming region become elliptic, Hill's criterion cannot predict the localised necks on the right hand side of the FLD.13
Hill's criteria for both diffuse and localised necking can be written in the form of a simple equation, which is an extension of the well known Considère's construction for the three-dimensional stress space

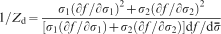


 after substituting them into equation (1)


Material and methods
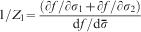
A thin, 0·275 mm thick, AA 3104-H19 type aluminium sheet was studied in this work. The measured chemical composition and mechanical properties are shown in Tables 1 and 2.
Chemical composition of AA 3104-H19, mass-

Mechanical properties of AA 3104-H19
The experiments consisted of tensile test, hydraulic bulge test and Marciniak type deep drawing test. In the hydraulic bulge experiments, three sets of dies were used.
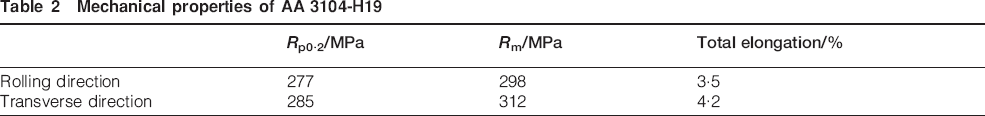
The circular die had a die opening diameter of 100 mm. The two elliptical dies had major and minor axes of 100/70 and 100/45 mm respectively. The major axes were chosen to be in the rolling and transverse directions of the sheet. The Marciniak tests were carried out using the deep drawing tools shown in Fig. 1. The punch diameter was 100 mm. The punch had a shallow recess on top to prevent any contact with the sheet, thus eliminating friction. The tools were made of AISI D2 tool steel. Underneath the AA 3104 aluminium sheet, two 0·2 mm thick AISI 304 stainless steel strips were used as carrier blanks. Since the aluminium sheet appeared to fracture easily and prematurely near the die corner, two such AISI 304 strips were added on top of the aluminium sheet to provide additional support near the die corner. To measure the forming limit strains, laser marked square grids were used. The sizes of the squares were 1×1 mm. After forming, measurements were made with a measuring microscope from the nearest square to failure. Photographs of the samples were also taken with a macrolens and strain measurements were repeated from digital images on a computer screen. Thickness measurements of fractured, hydraulically bulged cups and tensile tests samples were made using a scanning electron microscope (SEM). Fracture surfaces were studied using SEM and energy dispersive X-ray spectrometry.
Marciniak tools and experimental arrangement used in tests
Results
The typical failure pattern in the bulge tests was fracture. The preferred fracture direction was transverse to the rolling direction as illustrated in Fig. 2a in a bulge test with a circular die. The fracture occurred typically by shearing inclined at ∼45° to the through thickness direction and typical shear lips were observed as shown in the lower part of Fig. 2a. Similar failures were observed with elliptic dies, when the major axis was set transverse to the rolling direction as illustrated in Fig. 2b. Since the failure always occurred transverse to the rolling direction, when the circular die was used, tests in the transverse direction were carried out with the two elliptical dies. As can be seen from Fig. 3a and b, the fracture then took place along the major axis in the rolling direction, but tended to turn towards the transverse direction, which was observed to be the preferred direction in the tests with the circular die. It was found to be more difficult to obtain a fracture at the cup dome when the major axis was set in the rolling direction. In several cases, a premature failure near the die rounding was observed. However, basically similar type ductile shearing fractures were observed in all cases (Figs. 2 and 3).
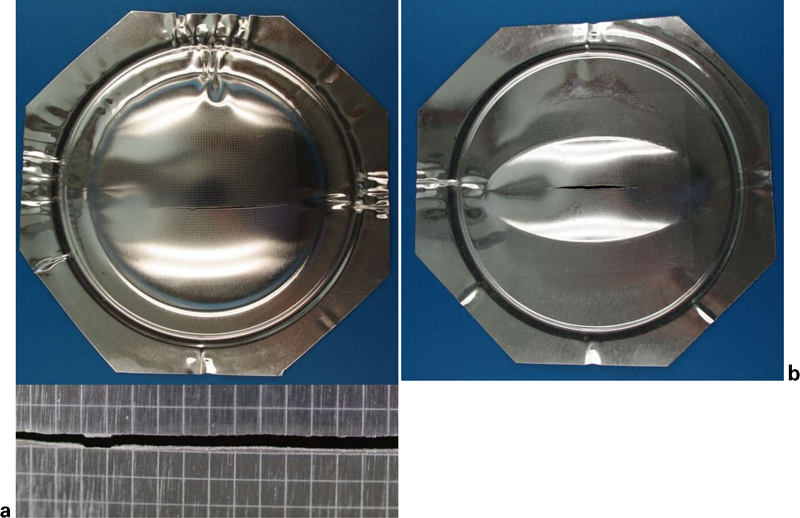
a hydraulically bulged cup using circular 100 mm diameter die: fracture transverse to rolling direction and detail of fracture showing shear lip. b hydraulically bulged cup using 100/45 mm elliptic die: fracture transverse to rolling direction and vertical direction is rolling direction
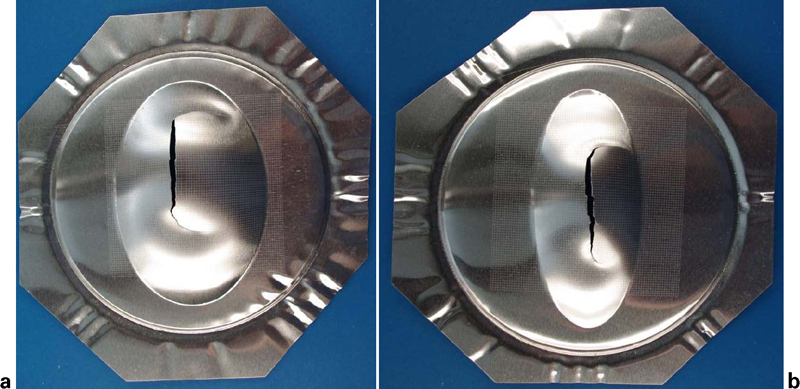
Hydraulically bulged cup using a 100/70 mm die and b 100/45 mm die: major axis is in rolling direction
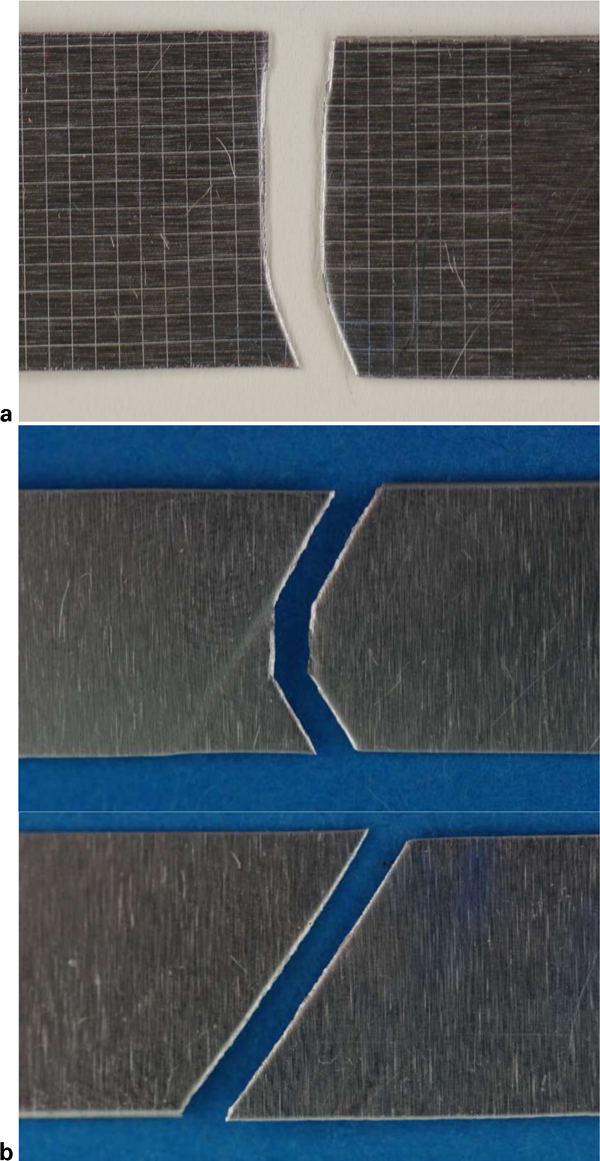
Figure 4a and b illustrates the results of the Marciniak tests in the rolling direction. In Fig. 4a, two families of crossing localised necks can be seen. However, when narrower strips were tested, a typical failure transverse to the rolling direction could be observed as shown in Fig. 4b, where a narrow and a wide samples are compared. In the narrower sample, only near the outermost left edge did the fracture direction deviate somewhat from the transverse direction. This may be affected by the fact that the narrower test sample was not loaded exactly centrally as can be seen in Fig. 4b. In Fig. 5a and b, the Marciniak test samples loaded transverse to the rolling direction are being compared. Again in the wide sample, two families of crossing slip lines can be seen. However, the specimen failed near the die edge and not at the centre of the punch bottom. When a narrower strip was loaded in the transverse direction, it failed as shown in Fig. 5b. The fracture direction was, in principle, comparable with the directions of the localised necks in Fig. 5a, although no clear localised necks could be observed in the narrower sample in Fig. 5b.
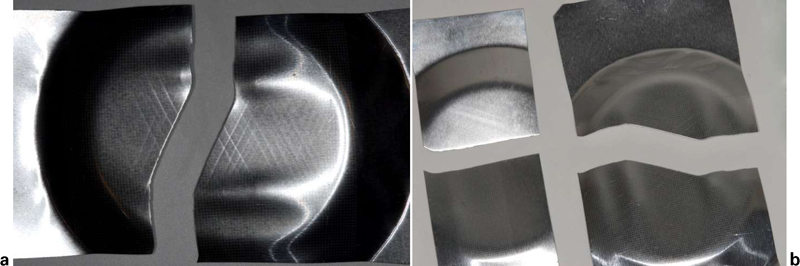
a example of wide Marciniak test sample in rolling direction (horizontal) and b comparison of narrow and wide Marciniak test samples loaded in rolling direction
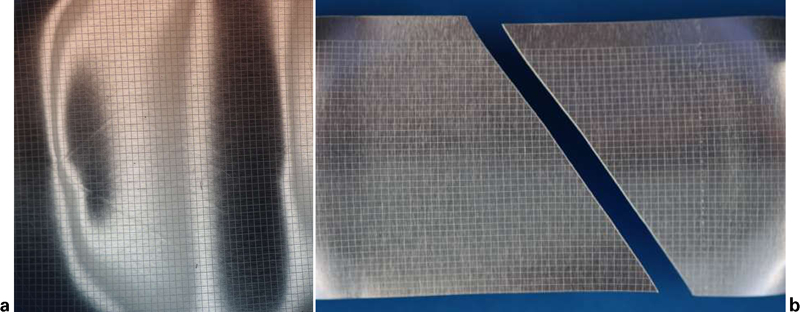
a example of wide Marciniak test sample loaded in transverse direction (vertical) and b example of narrower Marciniak test sample loaded in transverse direction (horizontal)
The tensile test specimens loaded in the rolling and transverse directions failed in a distinctly different manner as shown in Fig. 6a and b. The specimens loaded in the rolling direction failed in the transverse direction without showing any visible necking. In Fig. 6a, the fracture seems to change direction slightly when it proceeds towards the lower edge. The failures in the tensile test specimens loaded in the transverse direction (Fig. 6b) showed two different fracture patterns. There was either an oblique fracture in a typical necking direction inclined at ∼55° to the tensile axis, as shown in the upper part of Fig. 6b, or a central crack formed first, after which two competing localised necking bands appeared, one of them finally leading to the fracture as illustrated in the lower part of Fig. 6b.
a example of failed tensile test specimen in rolling direction and b examples of failed tensile test specimen in transverse direction
Scanning electron microscopy studies of the tensile test specimens and hydraulically bulged samples revealed a typical ductile fracture pattern. Thickness measurements were also carried out by using SEM. Figures 7 and 8 show examples of tensile and bulge test specimens respectively. Surface strains were calculated from the thickness strains to determine the fracture limit curve.
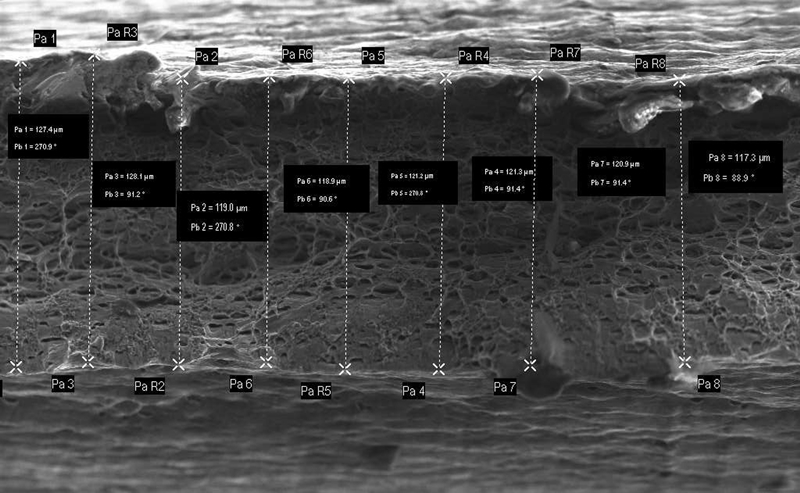
Example of thickness measurements of tensile test specimen in SEM
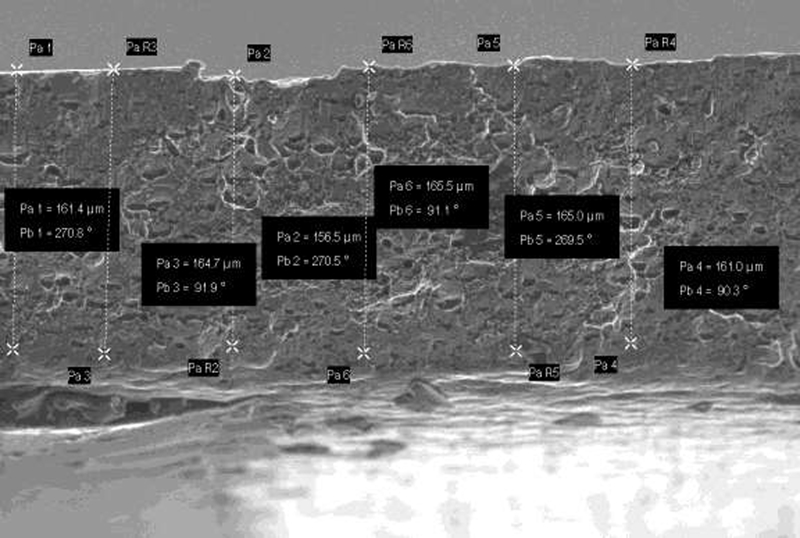
Example of thickness measurements of bulge test sample in SEM
Figure 9 shows the measured forming limit strains in the rolling and transverse directions. The strains were measured from the square nearest to the fracture. The measurements were made from enlarged digital close-up photographs. Figure 9 shows the schematic diffuse and local necking limit curves. These were obtained by assuming isotropic von Mises type of yielding and isotropic Hollomon type of hardening. Figure 10 shows the measured and calculated fracture limit strains. The experimental values were obtained from the thickness measurements made with an SEM. By neglecting anisotropy and assuming isotropy and constancy of volume, the corresponding surface limit strains could be obtained. Ritchie and Thompson17 presented a ductile fracture model based on the work of Rice and Tracey.18 In a previous work,19 we introduced a correction coefficient of 0·8 to their equation based on our SEM studies of defect distance and size. This resulted in an equation

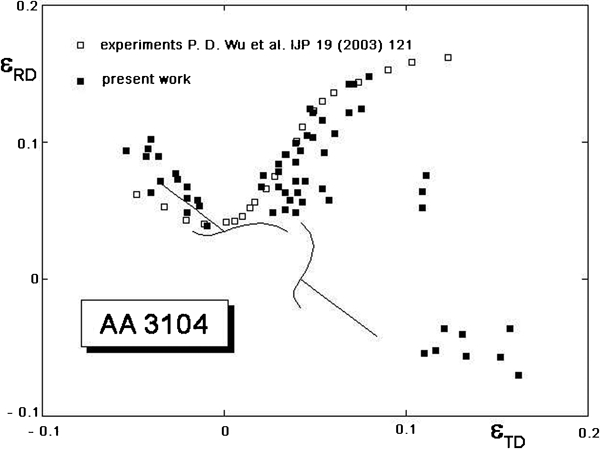
Forming limit strains in rolling and transverse directions compared with results of Wu et al.: experimental points corresponding to samples loaded in transverse direction are located below ϵRD–ϵTD line
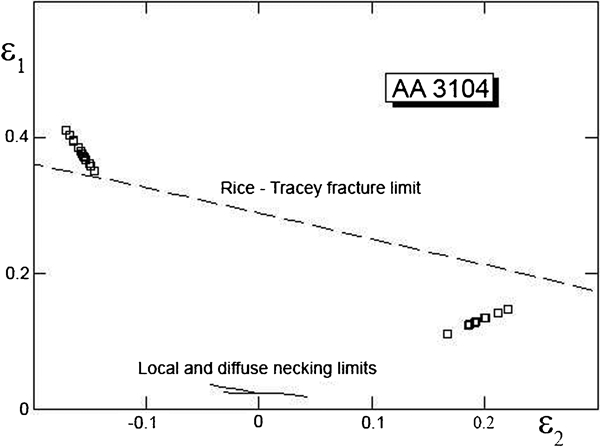
Comparison of measured and calculated fracture limit strains in rolling direction
Discussion
The failure in stretch forming was caused by sudden fracture and not by necking, as is clearly evident from Figs. 2 and 3, which show examples of the bulge test samples. The preferred failure direction was transverse to the rolling direction. Thus, it is expected that the two branches of the forming limit curve may not coincide near equibiaxial tension, since the fracture direction suddenly changes there, although direct proof of this could not be obtained in Fig. 9. It was rather difficult to break the samples in the rolling direction in the bulge test. The fracture tended to continue in the transverse direction when elliptical dies were used, as shown in Fig. 3a and b. It may be noted that a number of different fracture types including those resembling the ones observed in this work were already reported by Lankford et al.5 However, no necking was observed in the bulge tests carried out in this work.
Multiple localised necking was observed in Figs. 4a and 5a when the wide Marciniak specimens were tested. There was a rather uniform area of straining in the centre of the punch face. It was limited by two ridges, which were caused by the edges of the recess at the punch bottom. Between them, there was no contact between the punch and the deforming sheet, which could bend downwards. In the central area, the fracture followed the localised necks. The narrow Marciniak specimens drawn in the rolling direction fractured transverse to the rolling direction. The failure in Fig. 4b was similar to the one observed in the tensile test shown in Fig. 6a. Even similar curving of the fracture direction near the free edge could be observed in both cases. The curving may not be due to the edge effects but rather by the propagation of the fracture itself. The failure in the narrow Marciniak specimens tested transverse to the rolling direction was distinctly different from the samples tested in the rolling direction. They fractured at an angle to the transverse direction, as shown in Fig. 5b. Similar failures were observed in Fig. 6b in the tensile test specimens loaded in the transverse direction. In addition, in the tensile test specimens, centre cracking and the subsequent formation of two competing localised necks could also be seen. The observed localised necks were similar to those studied theoretically by Hill.12 Numerical predictions of such shear bands for another closely associated aluminium alloy under plane strain and stress conditions have been made by Inal et al. 20 20,21
The SEM images revealed a typical ductile fracture pattern consisting of a number of voids of various sizes. Typical shear lips could be distinguished even with the naked eye, as shown in Fig. 2a. The thickness measurements by SEM resulted in fairly large thickness strains. In accordance with our previous work,19 we used equation (8) to predict the fracture limit strains. Although reasonable agreement was observed in uniaxial tension, the modified Rice–Tracey criterion clearly overestimated the fracture limit in equibiaxial tension. It is rather difficult to affect the slope of the Rice–Tracey fracture limit. In addition, the Rice–Tracey criterion18 is based on a number of simplifying assumptions. The original version assumes that the defect distance divided by the defect diameter is 2. However, the defects are not usually spherical. Also the size of the voids varied greatly in SEM images. The assumption that the fracture limit is a downward sloping straight line has been confirmed by many researchers including Gensamer3 and Painter and Pearce.4 More recently, Takuda et al.22 studied a mild steel and two high strength steels and confirmed the linearity of the fracture limit curve in their experiments. As far as the authors know, Takuda et al. used a micrometre for the thickness measurements. Scanning electron microscopy measurements may give smaller thickness values, since it is well known that the strain values tend to increase towards the fracture site.23
The forming limit strains shown in Fig. 9 show considerable scatter. As mentioned above, the strains usually increase towards the fracture site. Two different methods of eliminating the strain peak near the fracture site have been proposed in the recent standard ISO 12004-2 (2008)24 in order to reduce the effect of the grid size on the results. The results reported previously by Wu et al.6 show no scatter. However, the authors give no details on the method used to determine the experimental forming limit curve. It may be that the points in their work do not represent the actual measurements, but the curve is some kind of best fit to the experimental results. In addition, it seems that they chose the Hollomon exponent of 0·07 to compensate their erroneous assumption of a preexisting trough in the sheet. According to Fig. 9, the correct value would be ∼0·04.
Laser marked square grids were used to measure the surface strains in this work. The measurements were made from digital close-up photographs. However, since the exact fracture site was not known, several measurements at various locations were made. Also, the accuracy of the original grid affects the results, as discussed previously by Korhonen et al.23 The calculated limit strains in Fig. 9 correspond to diffuse and local necking limits. The yielding model was the isotropic von Mises model, and isotropic Hollomon type of hardening was assumed. In addition, the n value was simply assumed to be the true strain corresponding to the total elongation. However, it is expected that this did not cause significant error, since the elongation values were small. Of course the assumption of isotropy is incorrect since the material showed considerably anisotropic behaviour, the preferred fracture direction being transverse to the rolling direction. Especially the limit strains in the transverse direction were difficult to measure for this reason. The wide Marciniak specimens tended to fail near the die radius and experimental points could not be obtained. The measured limit strains were larger than expected. More data are needed to determine the limit strains in the transverse direction. For the theoretical prediction of the limit strains, a better anisotropic yield model is needed. Such a model for aluminium has recently been discussed by Yoon et al.25
Conclusions
The limit strains for an AA 3104-H19 were measured from the nearest square to the fracture. As far as the authors know, this is the first time when detailed experimental work and raw data on the forming limits for an AA 3104-H19 are reported. The following conclusions were drawn.
The limit strains agreed reasonably well with those reported earlier by Wu et al.6 However, our results show considerable experimental scatter, while the results determined by Wu et al.6 show no scatter.
The reason for the absence for the scatter in the results by Wu et al.6 is expected to be that a smoothing procedure was used to eliminate the scatter in their results.
The localised necking limit in the most critical rolling direction could be predicted reasonably well by Hill's theory of localised necking and by assuming isotropy.
It seems that in the earlier work by Wu et al.,6 the work hardening exponent in the Hollomon equation was increased from 0·04 to 0·07 to compensate the decrease in the calculated limit strains due to their erroneous assumption of a preexisting trough in the sheet.
The alloy showed considerable planar anisotropy. It was very difficult to break it in the transverse direction. The measured limit strains in the transverse direction were also higher.
Failure patterns in the rolling and transverse directions were distinctly different. When loaded in the rolling direction, the samples failed preferentially transverse to the tensile axis without any signs of local necking. However, clear local necking was observed in tensile test specimens loaded in the transverse direction.
The wide Marciniak specimens loaded in the rolling and transverse directions both showed multiple local necking.
The observed fracture pattern in all cases was a typical ductile fracture and no local necking in stretch forming could be observed. Dimples of varying size were observed in SEM images.
The modified Rice–Tracey equation seemed to overestimate the fracture limit strains for AA 3104 aluminium in equibiaxial tension.
Footnotes
Acknowledgements
The authors would like to thank Dr J. W. Yoon and Alcoa Technical Center for providing the material for the experiments.