
Abstract
Free machining steels are specially designed to offer good results in machining operations by reducing the coefficient of friction with the tool. In general, these steels must meet tight specifications for other characteristics, such as mechanical strength, fatigue strength and wear resistance, among others. Therefore, the main alloying elements of which they are composed are destined to improve their machinability. These materials are usually low carbon steels with strong additions of S, Mn, Pb, P, etc. Because they are usually manufactured with recyclable materials, their compositions always contain elements such as Cr, Ni, Cu and Mo, which are considered residual elements. The present paper reports on an investigation of the influence of slight variations in Cu, Ni and Cr content on the machinability of leaded low carbon free machining steels based on the methodology described by the Volvo STD 1018-712 standard. The method is based on tool life tests of high speed steel single cutting tools applied in special conditions to the face milling process. The statistical analysis of the data was performed by analysis of variance and hypothesis testing. The results of the experiments demonstrated that residual chemical elements influence the machinability of SAE 12L14 steel.
Introduction
Today's world with its fierce global competition has led the industry to engage in an incessant drive to reduce production costs. Based on this philosophy, the auto parts and metal and mechanical industry must achieve international indices of productivity, quality and manufacturing cost. The majority of industrialised products undergo some machining process in one of their production stages.1
The machining cost of pieces made of engineering steels represents ∼50 of the final production cost.2 This significant cost has prompted a large scale growth of research in steel mills, aimed at devising special steels that involve lower costs in the manufacture of a machined component. These special steels include free machining steels, which are designed to obtain maximum performance in machining operations. Sulphur, manganese (to form manganese sulphides) and lead, among other elements, are usually added to these steels. 3 3,4 These elements and/or compounds are considered free machining additives that improve the machinability of these steels. Low carbon free machining steels are especially important because they account for the highest volume consumed in this group of steels. It is very common for users of this material to complain about the wide variability in machinability from one batch to another, even though it meets standard specifications.5 These authors believe that variations in the chemical composition are the main factors responsible for these machinability variations. To reduce their costs, some companies use steel scrap without an efficient control of its chemical elements, which may alter the content of residual elements (chromium, nickel, copper and molybdenum). These elements, albeit present in small quantities, are therefore not added intentionally to steels and are difficult to remove during the fabrication process. In free machining steels, residual elements are harmful since they harden the steel matrix and hasten tool wear. Echevarría and Corcuera6 state that to obtain good results in machining, the sum of the chemical elements of nickel, chromium and copper should not exceed 0·5.
The present work is part of a larger project aimed at studying the influence of residual chemical elements (Cr, Ni and Cu) on the machinability of SAE 12L14 steel. The variables of force, temperature, surface roughness and magnitude of the chip were studied by Evangelista Luiz,7and tool life in the turning process using high speed steel (HSS) and cemented carbide were investigated by Almeida8and Almeida et al.9The present work focuses on an investigation of machinability by means of tool life testing in milling developed and standardised by Volvo.10 This research was possible only because the manufacturer, through a concentrated effort, made available nine runs of this steel, selected from its production line and containing different levels of these residual elements, within the tolerance limits established by the standard. The results were analysed using statistical tools to ensure their reliability. The statistical tools used here were analysis of variance (ANOVA), to ascertain whether there really was a difference in the results obtained with the various materials under study, and Student t test for paired comparisons of the materials.11
Materials and methods
Materials
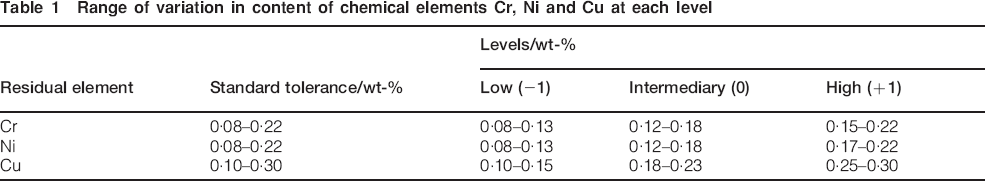
Nine batches of materials were produced with predefined chemical compositions (within the limits of capacity of the fabrication process) of SAE 12L14 steel. The tests were designed to meet a two-level factorial design of experiments with a central point (intermediary level). This design involves a two-level variation in the following factors: nickel content, chromium content and copper content, all measured in percentage of mass. In this design, the coded levels were −1 (low level), +1 (high level) and 0 (intermediary level). Because the steel fabrication process in steelworks does not allow for pointwise control of the steel's chemical composition, the level of elements had to be established in ranges within the capacity of the process, as indicated in Table 1.
Range of variation in content of chemical elements Cr, Ni and Cu at each level
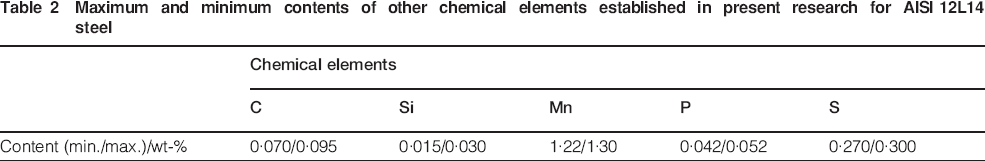
The other chemical elements of the steel were also established in ranges, as indicated in Table 2.
Maximum and minimum contents of other chemical elements established in present research for AISI 12L14 steel
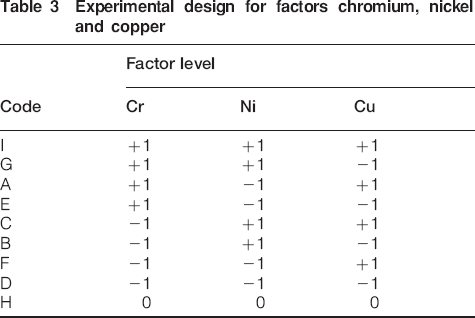
From Table 1, it can be seen that the variation in the three residual elements (Cr, Ni and Cu) allows one to compose, simply with raw material variables, a 22factorial design with a central point represented by the material H (Table 3), whose elements are all at the ‘zero’ level. Table 3 shows the relationship between the levels of the factors for each element in a material, encoded by letters ‘A’ to ‘I’ for identification.
Experimental design for factors chromium, nickel and copper
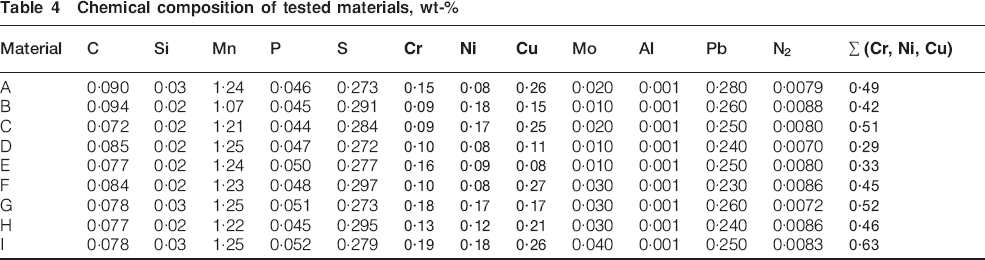
The chemical compositions of the nine tested materials are listed in Table 4, highlighting (bold) the residual elements Cr, Ni and Cu and their sum. As can be seen, Table 4 complies with the specified ranges given in Tables 1 and 2. The lower manganese content of material ‘B’ that did not comply with the specification was neglected here because another run in the foundry to obtain other material would be costly and they did not show significant influence on the main properties, such as hardness and percentage of soft inclusions.
Chemical composition of tested materials, wt-
All the materials were supplied in hot rolled bars with a diameter of 52·39 mm, produced by Gerdau S.A., in the same production run and under the same manufacturing parameters. They were all peeled by turning to a diameter of 50 mm. The microstructures of the nine tested materials were very similar, composed predominantly of ferrite with minor amounts of pearlite and inclusions of lead and manganese sulphides. The light optical micrographs depicted in Fig. 1 are representative microstructures of these materials and of the distribution of the inclusions.
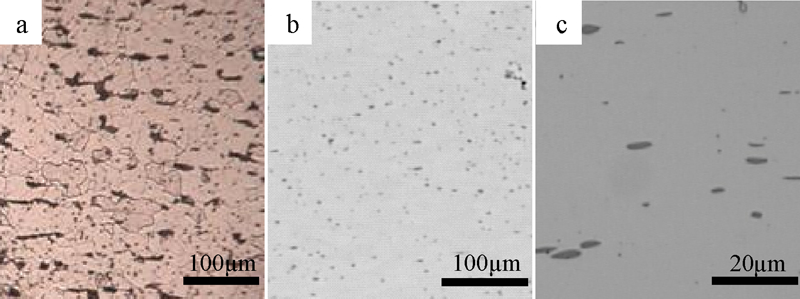
Typical microstructures presented by nine tested materials: distribution of inclusions lead and manganese sulphides (unetched longitudinal section)
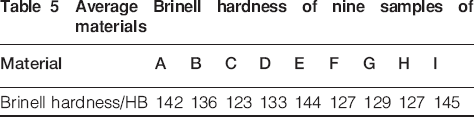
Four small samples of each material were taken from different positions of the bars, and the Brinell hardness was measured at four distinct locations in the cross-sections of each sample, resulting in 16 indentation hardness measures for each material. The average hardness of each material is given in Table 5. The coefficient of variation was always <3.
Average Brinell hardness of nine samples of materials
Volvo test
The machinability indices of the nine work materials were obtained using the Volvo standard,10 developed by the company, which bears its name and is recommended for steel, nickel, cobalt and titanium materials. In its third edition (2003), this standard serves to quantify the machinability of a material by means of an index called the ‘B’ index, which indicates the per cent ratio of the machinability of a free cutting steel whose machinability has been given the index 100. The test consists of face milling the transversal section of cylindrical bars in passes under constant cutting conditions until a predetermined degree of cutting tool wear is reached. The volume of the removed material is calculated, and together with the applied cutting speed, the B index is determined from a given diagram. The standard recommends the use of an HSS lathe tool attached to a milling cutter, whose dimensions and other details it also specifies.
The advantage of using the Volvo test lies in its economy in terms of materials and time, which may reach a ratio of 1∶70 in relation to traditional tests.12
The cutting conditions used in the tests are recommended by the Volvo standard,10 as follows: depth of cut of 1·0 mm, feedrate of 0·01 mm rev−1 and initial cutting speed to be stipulated for each material. An initial cutting speed of 125 m min−1 (rotation of 500 rev min−1) was used for the free machining steel under analysis. The tool material was AISI M3 HSS, and its geometry was determined by the Volvo standard STD 1018-712 (square tool bit of 16×16×80 mm, side rake angle of −15°, side relief angle of 8° and approach angle of 45°). An emulsion of mineral based oil Lion, manufactured by Lubri-Motor Industry Co. Import and Export Ltd, at 4 concentration was used in the tests. The cutting fluid was applied at a flowrate of 10 L min−1.
To perform the tests, the tool was attached vertically to the axletree, cutting the workpiece horizontally, with each pass removing a constant volume of 1·96 cm3 of material, as illustrated in Fig. 2. After the passes, when the workpiece had reached a minimum dimension of 50 mm (used for its fixation), it was substituted for a new one. Figure 3shows a photograph of the set-up of the system in a test.
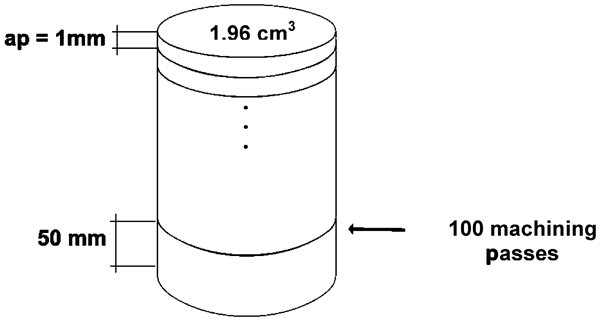
Dimensions of testpiece, indicating passes removed horizontally10
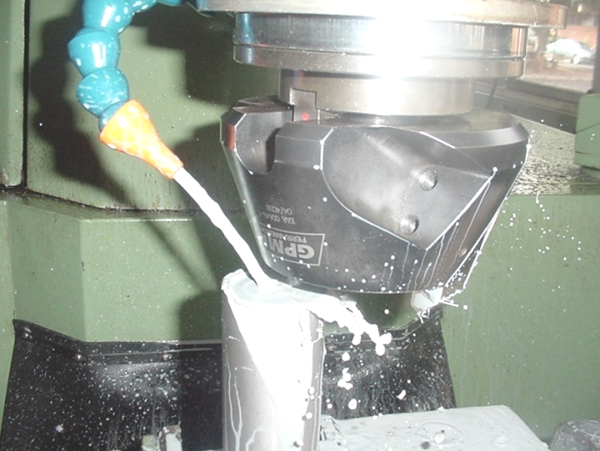
Photograph of set-up of system in test
The workpiece was machined until the HSS tool reached the wear rate of VBBmax = 0·7 mm. Figure 4 shows a scheme of the measurement of flank wear on a tool. When this end of tool life criterion was reached, the volume of the removed material was calculated by multiplying the number of passes by the volume of each pass (1·96 cm3). A new tool was used in each test.
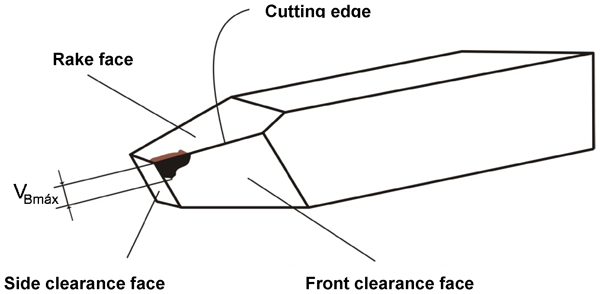
Scheme of measurement of maximum flank wear used as end of tool life criterion10
Determination of index of machinability ‘B’
According to the Volvo standard,10the ‘B’ index is determined on a cutting speed diagram as a function of the volume of removed material on logarithmic scales. Several straight lines are drawn for different testing times (1, 2, 4 h, etc.), and one of these straight lines is chosen (in the case of this investigation, 2 h), whose B index will be graded. On this scale, the SAE 1112 free machining steel has a ‘B’ index of 100. To determine the machinability of the material being tested, one must find a line that will cross the standard straight line whose ‘B’ index is graded, as shown in Fig. 5. Tests performed at an initial cutting speed of Vc1 followed by Vc2 allow the B index be determined after calculating the volume of material removed until the tools have reached the end of their life. The standard specifies the cutting speeds to be applied for each type of work material. Figure 5 serves simply as an example, but the logarithmic diagram that was actually used here is a more complete one, whose straight lines are all graded, which is included in the Volvo standard.
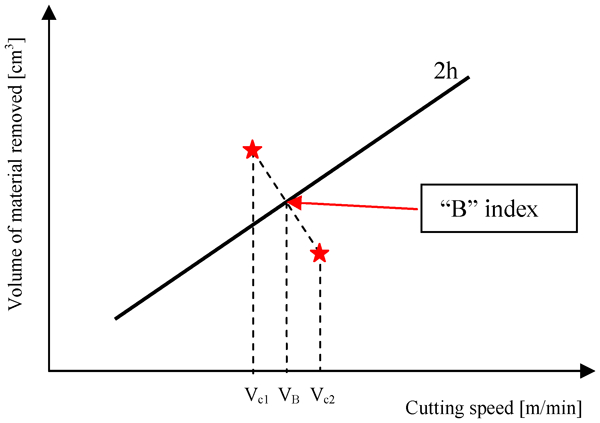
Determination of ‘B’ index number for material under test10
For greater accuracy, at least three and at most six tests must be performed in the same conditions for each cutting speed employed, depending on the dispersion between the minimum and maximum volumes of material in each test.10
Results and discussion of indices of machinability ‘B’
Table 6 lists the results obtained for each index of machinability ‘B’, as well as the mean values of the 27 tests, i.e. one test and two repetitions of each of the nine materials. Note that the higher the B index, the better the material's machinability.
Values of indices of machinability ‘B’ found for nine tested materials
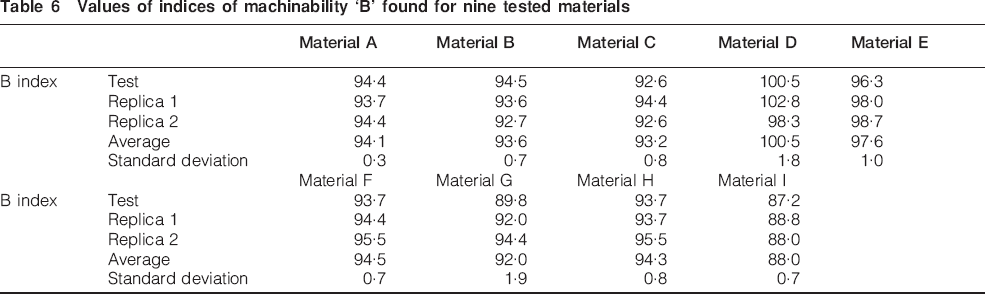
These results show that the materials can be ranked in a reasonable range, with the ‘B’ index varying from 88·0 (material ‘I’) with the poorest machinability to 100·5 (material ‘D’) with the best machinability. This material, therefore, has higher machinability than the standard SAE 1112 steel that has gained the index 100 by this method. The range achieved here is higher than the one encountered by Björkeborn et al.13 when studying the effect of the microstructure on the machinability of a case hardening steel (20MnCrS5), where the material with a large nodular pearlite obtained the lowest ‘B’ index (74·0) and the material with spherical pearlite the highest (80·2). This is a range of only 6·2, which is half of the one encountered in the present investigation (12·5).
An examination of the results in Table 6 and a comparison of the sum of the percentages of the residual elements (Cr, Ni and Cu) in Table 4indicate that the decreasing order of machinability of the materials, which is given by the ‘B’ index (D, E, F, H, A, B, C, G and I), follows the same sequence of growth of the sum of the residual elements, except for the position of material B. The increasing order of the sum of the residual elements is (Table 4) D, E, B, F, H, A, C, G and I. Hence, material B would be expected to occupy the third position, but in fact appears in the sixth position of machinability. The most probable reason for this alteration is the higher content of carbon in this material (0·094), which, although it did not show the greatest hardness among the tested materials (see Table 5), offers a greater possibility of forming hard abrasive particles (cementite or other carbides), thus affecting its machinability.
Figure 6 illustrates this graphically, showing that there is a good linear correlation between the sum of the residual chemical elements Cr, Ni and Cu and the machinability index ‘B’.
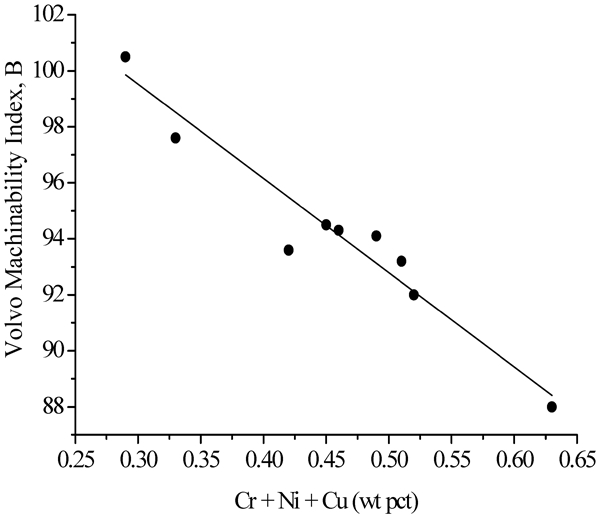
Correlation between sum of residual chemical elements (Cr, Ni and Cu) and ‘B’ index
The results shown in Fig. 6 indicate that the materials whose sum of chromium, nickel and copper contents exceeded 0·5 were the ones that presented the poorest machinability indices (materials C, G and I with total contents of Cr, Ni and Cu of 0·51, 0·52 and 0·63 respectively). This reinforces the advice of Echevarría and Corcuera,6 who recommend that the sum of the contents of these elements be <0·5.
Material D, which has the lowest levels of residual chromium, nickel and copper (0·29), presented a 13 higher machinability index than material I, which shows the highest levels of residual elements.
A statistical analysis is necessary to ensure greater accuracy in the responses found through the Volvo test. Therefore, ANOVA was performed initially for a global comparison of the nine materials, which is presented in Table 7.
Analysis of variance global analysis chart
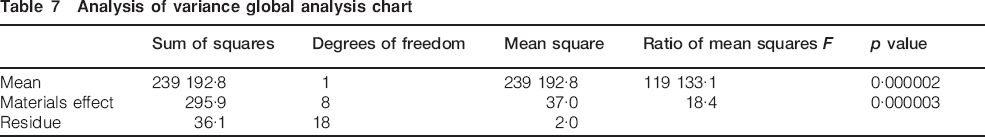
From the results in Table 7, it can be seen that the value of p was much lower than the usual levels of significance of 5 or 1, indicating that the materials differ significantly.
Table 8 presents the effects of each residual element (Cr, Ni and Cu) calculated from the response (B index) of the experimental design, considering the dimensionless levels (−1, 0, 1) of the independent variables. This table lists the significant parameters (p<0·05).
Calculated effects, standard errors, t and p values for factorial design
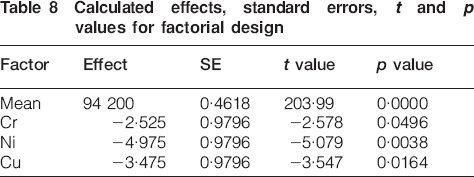
The results listed in Table 8 indicate that all the residual elements affect the machinability of the material. The residual element that affected the B index most strongly was Ni, followed by Cu and Cr. Table 8 also shows that raising the residual level of nickel, copper and chromium causes a decrease in machinability (negative parameters).
Because of these significant differences among the materials, which were confirmed through the global variance analysis and the calculated effect of the 2K experimental design, the next step was to make comparisons between pairs of materials using Student t test. Table 9 shows the results of this analysis, considering a 95 confidence index and a 5 level of significance. This table presents only the pairs of materials that differ significantly (p<0·05).
Results of statistical test of paired comparison between materials
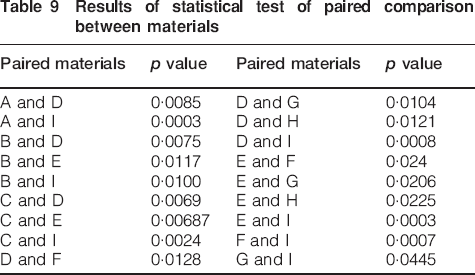
The results in Table 9allow for a comparative analysis between the paired materials, varying the content of a residual level and leaving the other two constant, in order to verify which of the residual chemical elements exerts the greatest influence on the machinability of the material under study.
Using this methodology, the first to be compared was material D, which shows the best machinability index B (see Table 6) and low residual levels (see Tables 3 and 4), and material E, which has a high residual level of chromium and low nickel and copper. The results indicated that these two materials do not differ statistically (not shown in the table); hence, when the chromium level is raised from low to high, their machinability is not affected. However, this same material D differs statistically from material B (see Table 9), which has high residual levels of nickel and low chromium and copper. This leads to the conclusion that raising the residual level of nickel from low to high while maintaining the other residual levels low causes a decrease in machinability. Material D also differs statistically from material F (see Table 9), which has high residual levels of copper and low chromium and nickel. Therefore, increasing the residual level of chromium from low to high also reduces machinability. Based on these comparisons, it was found that the steel's machinability decreases when the residual levels of the elements nickel and copper are changed individually from low to high while the other two elements are kept constant.
Now, comparing material E, which shows the second best machinability index (see Table 6) and a high residual level of chromium and low nickel and copper (see Tables 3 and 4), and material G, which has high residual levels of chromium and nickel and low copper, one can see from Table 9that they differ statistically. Therefore, changing the level of nickel from low to high while keeping the level of chromium high and that of copper low causes a decrease in machinability. This same material E does not differ statistically from material A (not shown in Table 9), which has low residual levels of nickel and high levels of chromium and copper. This means that changing the level of copper from low to high and keeping the level of chromium high and that of nickel low does not affect the machinability.
Finally, the comparison of material I against material C, which has a low residual level of chromium and high nickel and copper, or against material A, which has low nickel levels and high copper and chromium levels, or even against material G, whose residual levels of copper are low and nickel and chromium high, showed that they differ statistically. It was therefore concluded that changing the level of any residual element from high to low while keeping the other two elements high leads to an improvement in machinability.
The ANOVA and Student t test indicated that material D, which has low levels of residual elements, and material E, which has a high residual level of chromium and low residual levels of nickel and copper, were the ones that presented the best machinability and that material I, with its high levels of residual elements, presented the worst machinability.
It is known that residual chemical elements appear through the use of recycled material, and particularly in the case of the three elements under study, i.e. chromium, nickel and copper, these appear as solid solutions, which usually give steel greater mechanical strength and hardness. Table 5 indicates that material I, which contains high levels of these three elements, presents the highest hardness (145 HB) and that material D, with the lowest level of residual elements, has an intermediary hardness (133 HB). The lower hardnesses presented by the other materials (C, F and H) may be due to their contents of other elements, e.g. carbon. Thus, it was reasonable to expect that material I would present the worst machinability, since higher mechanical strength and hardness imply greater restrictions to chip formation and, normally, higher cutting tool wear. 1 1,14 This possibility cannot be discarded, despite the fact that the ANOVA did not show a direct correlation between hardness and the machinability index ‘B’. The scattered points in Fig. 7 give evidences of this lack of correlation.
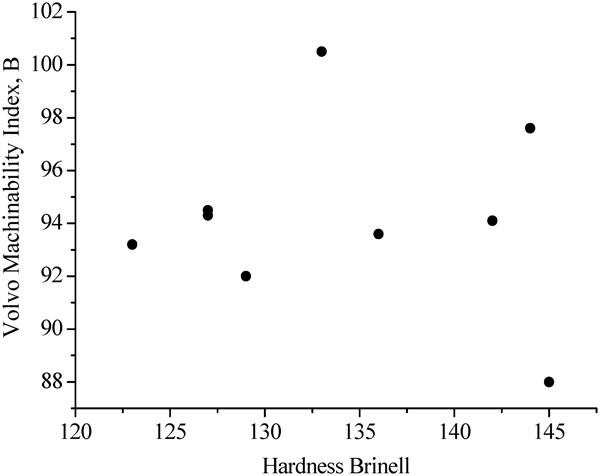
Correlation of machinability index ‘B’ and hardness of materials tested
In terms of lead and manganese sulphide inclusions, the literature 1 1,4has shown that the machinability of the free machining steels is greatly influenced by the quantity and morphology of them.
The morphology of the inclusions of the materials tested, measured by the average of the length/diameter ratio, is shown in Table 10.
Length/diameter ratio of soft inclusions of nine materials tested

Theoretically, the higher the form factor of the inclusions, the poorer is the machinability of the material.15However, the numbers of Table 10 show little difference among the sample materials (minimum of 1·84 for material B and maximum of 2·98 for material C), which means that the morphology of the inclusions can be considered here with no significant influence on their machinability. In addition, there is no correlation with the length/diameter ratio of the inclusions and the machinability of the nine materials tested, as illustrated in Fig. 8. This is another indication that the morphology of the inclusions is not a variable affecting the machinability here.
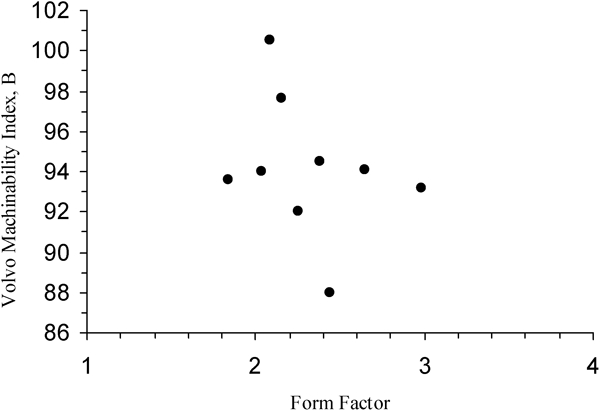
Machinability index ‘B’ against form factor of soft inclusions given by length/diameter ratio
Table 11 presents the percentage of lead and manganese sulphide inclusions of the nine materials tested taken as averages of 70 samples analysed for each material.
Percentage of soft inclusions in materials tested

Although the amount of soft inclusions varies considerably among the nine tested materials (from a minimum of 1·04 for material C to a maximum of 3·19 for material G), this is not translated to the machinability results. Figure 9 plots the percentages of soft inclusions against the ‘B’ machinability index. Similar to hardness and length/diameter ratio, the results are very scattered, and hence, no correlation is seen.
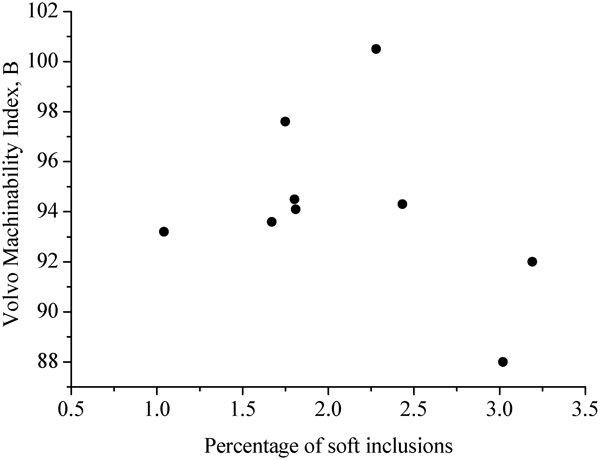
Correlation of machinability index ‘B’ and percentage of soft inclusions in materials
It should be pointed out that in the case of free machining steels, the machining process, the tools employed and the cutting conditions are important and may alter the results. In another study of these materials (except for run B) in turning using cemented carbide tools at high cutting speeds (400, 450 and 500 m min−1),8it was found that run A (which had high levels of Cr and Cu and low Ni) showed the best machinability, while run D, whose levels of residual elements were the lowest, showed the worst machinability. In these tests, the higher percentage of copper was found to be the determining factor for the higher machinability, since high temperatures are developed, and copper acts as an element that causes hot embrittlement, facilitating chip formation.
Conclusions
Based on the machinability results obtained using the Volvo standard10 to verify the influence of the residual chemical elements chromium, nickel and copper on SAE 12L14 steel, the following can be concluded.
All the residual elements decrease the machinability of the material. The residual element that exerted the strongest effect on the B index was Ni, followed by Cu and Cr.
These residual chemical elements do, in fact, affect the machinability of this steel, and the lowest residual levels, corresponding to material D, and the high level of chromium and the low nickel and copper levels, which correspond to material E, were the ones that presented the best machinabilities.
Material I, with the highest sum of residual chemical elements, presented the worst machinability.
The difference in the indices of machinability ‘B’ between the best and the worst materials was ∼13.
The materials with the highest total percentage of residual chemical elements presented the poorest machinability indices.
Footnotes
Acknowledgements
The authors are indebted to the Brazilian steel maker GERDAU S.A. for supplying the materials in the nine configurations of chemical compositions required for the present work and to Dr I. F. Machado of Polytechnic School, University of São Paulo (USP), Brazil, for her technical assistance on the analysis of the soft inclusions of the materials. CNPq, CAPES and FAPEMIG (Brazil) are also gratefully acknowledged for their financial support.