
Abstract
Duplex and superduplex stainless steels have high strength and high corrosion resistance with a crescent demand in chemical and petrochemical industries. The best mechanical properties of this family of steels are obtained with approximately equal parts of ferrite and austenite. Grain refinement increases the toughness and resistance to environmentally assisted cracking. The precipitation of tertiary phases, such as σ, χ and secondary austenite, decreases the mechanical and corrosion resistance properties. The σ phase is the most dangerous of these deleterious phases and the one that precipitates in higher amounts. The majority of research works on deleterious phases in duplex and superduplex steels evaluate the kinetics of precipitation in specimens isothermally treated. In the present work, the precipitation of deleterious phases during continuous cooling from 1100°C was evaluated by optical and scanning electron microcopies, hardness measurements and electrochemical corrosion tests. Two superduplex stainless steel steels UNS S32750 with similar composition but quite different grain sizes were analysed in order to evaluate the influence of this microstructural feature.
Introduction
The optimum mechanical properties and corrosion resistance of duplex and superduplex stainless steels (DSS and SDSS) are obtained with a microstructure containing nearly equal amounts of austenite and ferrite.1 The precipitations of intermetallic phases, such as σ and χ, chromium carbide and secondary austenite γ2 have been extensively studied, and the deleterious effects of these phases on toughness and corrosion resistance properties were reported.2–6 However, a great part of research works on σ and χ phase precipitation in duplex and superduplex steels used specimens isothermally treated in the 650–1000°C range.
Reactions of decomposition of the ferrite phase δ into σ, χ, γ2 and M23C6 have been proposed. Among these, σ is considered the most dangerous to the mechanical properties and corrosion resistance. The mechanisms of δ decomposition in the 600–1000°C range in DSS and SDSS are briefly described in the following.
Although direct δ→σ precipitation is possible, the eutectoid reaction δ→σ+γ2 is more common. Secondary austenite may precipitate by this way, but can also form independently from ferrite. Direct reaction δ→γ2 in the δ/δ boundaries is very rapid and is often observed in the heat affected zones of welding joints.2 The nucleation and growth of independent γ2 is usually in the Cr2N particles and is intensified at high temperatures (900°C or higher). The precipitation of χ phase is prone to happen in Mo alloyed steels in the 700–900°C range.2 The use of electrolytic etch in 10–15 KOH solution darkens χ, σ and fine eutectoid γ2 with the same tonality. It is possible to quantify these three phases by quantitative metallography in the optical microscope (OM), but it is very difficult to separate them.7 A good separation of these three phases can be obtained in the scanning electron microscope (SEM) with specimens prepared by polishing with diamond or alumina paste and observed without etching. 8 8,9 The differences between the chemical compositions of σ, χ, γ and δ are sufficient to produce a good contrast in the backscattered electron (BSE) images. Studies by Chen et al.3 have shown that χ is metastable and replaced by σ with prolonged aging. Finally, according to Lee et al.,10 carbide precipitation can also precipitate in association with γ2 in the initial stages of aging.
All these reactions may take place during the slow cooling (SC) of DSS and SDSS steels from temperatures higher than 1000°C. The risk of undesirable precipitation is eminent in welding and annealing treatments. Annealing, or solution treatment, must be followed by water cooling. A failure analysis work signed by Hitchcock et al.11 showed that a large cylinder of SDSS may undergo σ phase precipitation in some points located in its centre part, even when it is water cooled from high temperature.
The majority of works on the precipitation of deleterious phases in DSS and SDSS analysed the kinetics and the effects of precipitates formed by isothermal cooling. In the present work, the precipitation of deleterious phases during continuous cooling from 1100°C was investigated in specimens from two SDSS UNS S32750 with similar composition, but quite different austenitic and ferritic grain sizes. Characterisation by OM and SEM, hardness measurements and electrochemical corrosion tests were used to detect and quantify the phases formed. The effects of cooling rate on hardness and corrosion resistance were also determined.
Experimental
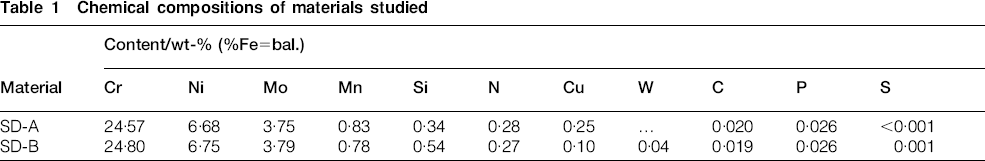
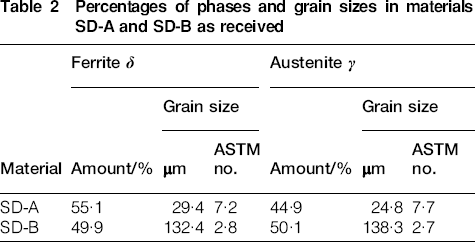
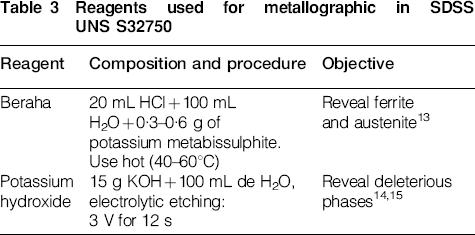
The compositions of the two materials studied are shown in Table 1. SD-A and SD-B are the fine and coarse grained steels respectively. The austenitic and ferritic volumetric fractions and grain sizes of each material are shown in Table 2. The volumetric fractions of phases were determined with specimens prepared with Beraha's reagent (Table 3), which reveals austenite as light and ferrite as dark, but do not reveal grain boundaries. The grain sizes were determined by electron backscattered scanning diffraction in a previous work.12 SD-A and SD-B have different grain sizes because they were processed in different ways. The SD-A material was from a cold rolled and solution treated plate of 9·5 mm thickness. The SD-B samples were from a hot rolled and solution treated bar with 203 mm diameter. This last procedure results in a coarse grain size of ferrite and austenite.
Chemical compositions of materials studied
Percentages of phases and grain sizes in materials SD-A and SD-B as received
Reagents used for metallographic in SDSS UNS S32750
Specimens with dimensions of 15×10×5 mm were cut from the as received (AR) materials. The specimens were treated at 1100°C for 40 min and continuously cooled with three different rates: fast cooling (FC), moderate cooling (MC) and slow cooling (SC). Figure 1 shows the three cooling curves measured with a thermocouple. The specimens were water cooled from 580°C to avoid α′ precipitation.
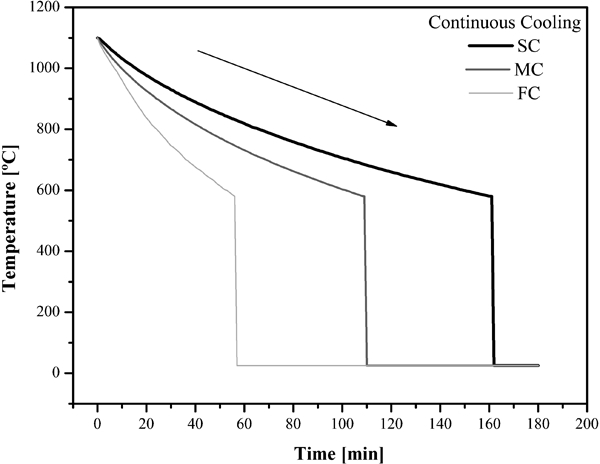
Continuous cooling curves for SD-A and SD-B: fast cooling (FC), moderate cooling (MC) and slow cooling (SC)
The microstructure of the specimens treated (SD-A FC, SD-A MC, SD-A SC, SD-B FC, SD-B MC and SD-B SC) were investigated by OM and SEM. For the quantification of deleterious phases, the specimens were electrolytically etched with KOH solution, as described in Table 3. In the SEM, the specimens were observed with and without etching to distinguish and characterise the deleterious phases using secondary electrons (SE) and BSE images.
The quantitative metallography was performed by image analysis using Image Tools software,16 analysing 20 fields per sample, with magnifications of ×240, ×475 and ×950.
Vickers hardness test was measured with 30 kgf load.
The corrosion resistance of each sample was evaluated by double loop electrochemical polarisation reactivation (DL-EPR) and critical pitting temperature tests (CPT).
The DL-EPR was performed to evaluate the degree of sensitisation (DOS) due to the deleterious phase precipitation. These tests were conducted in 2M H2SO4+0·01M KSCN+0·5M NaCl solution at 40°C. This electrolyte has been used in the study of the effects of σ phase precipitation in DSS.4 The tests were conducted in a three-electrode cell with working electrode, saturated calomel electrode (SCE) as reference and Pt foil as counter electrode. The working electrodes were constructed with each SDSS sample embedded in epoxy resin with cooper wire as electrical contact. The working electrodes were ground with 100, 220 and 400 emery papers, degreased with alcohol and cleaned in water. After this, the edges of the samples were painted to avoid crevice. The test was initiated after the stabilisation of the open circuit potential EOC. The potential was varied in the anodic direction with sweep rate of 1 mV s−1 until 0·3 V(SCE). Then, the scan was reversed to the cathodic direction, maintaining the same sweep rate until reaching the EOC. The DOS was evaluated from the ratio Ir/Ia, where Ia is the activation peak current of the anodic scan, and Ir is the reactivation peak current observed in the reversed scan. As an example, Fig. 2 shows the DL-EPR curve of specimen SD-A FC with peak currents Ir and Ia indicated.
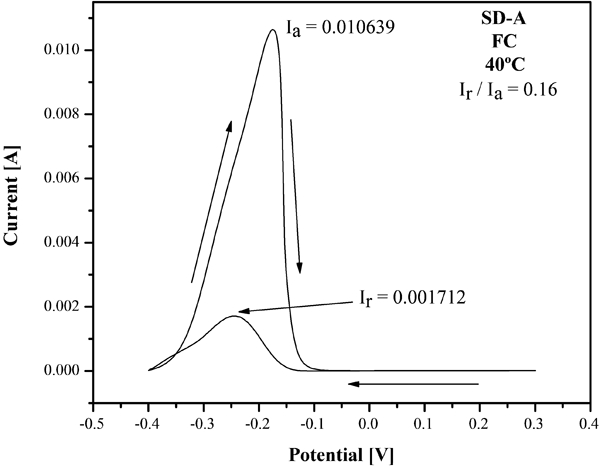
Curves (DL-EPR) of specimen SD-A FC
The CPT tests were measured by the electrochemical method described in the ASTM G-150 standard.17 The conventional three-electrode cell employed is similar to that used in the DL-EPR test, but the electrolyte was 1M NaCl solution. The cell was immersed in a water bath heated by electrical resistance. The test consists of measuring the current density, while the working electrode is polarised with 700 mV(SCE), and the temperature of the cell is increased with a constant rate. The CPT is defined as the temperature at which the current density becomes higher than 100 μA cm−2. After the tests, the specimens were observed in the OM to assure that crevice corrosion has not occurred and also to observe the pits sizes and morphology. The CPT tests are frequently used to evaluate the influence of the microstructural features on the pitting corrosion resistance of DSS and SDSS.18
Results
Figure 3 shows the microstructures of SD-A and SD-B steels before the heat treatments, i.e. in the AR condition. The images show the coarser microstructure of SD-B.
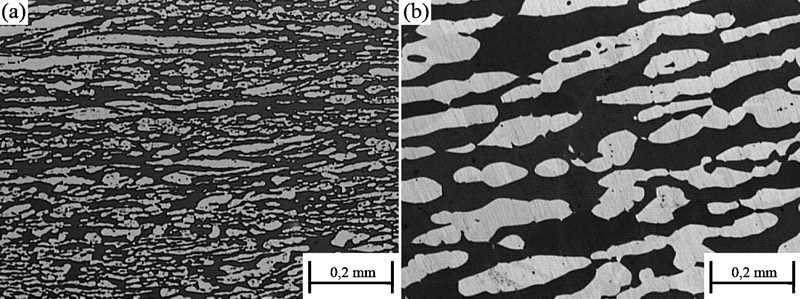
Microstructure of as received materials etched with Beraha reagent: OM
Figure 4 shows the microstructures with different magnifications revealed by KOH electrolytic etching of SD-A after FC, MC and SC respectively. Figure 5 shows the microstructures of SD-B in the same conditions. The volumetric fractions of deleterious phases shown in Table 4 are greater in SD-A than in SD-B for all cooling conditions. Similar results were obtained in specimens of SDSS isothermally treated, i.e. the reduction in ferrite grain size increases the initial kinetics of deleterious phase precipitation.12
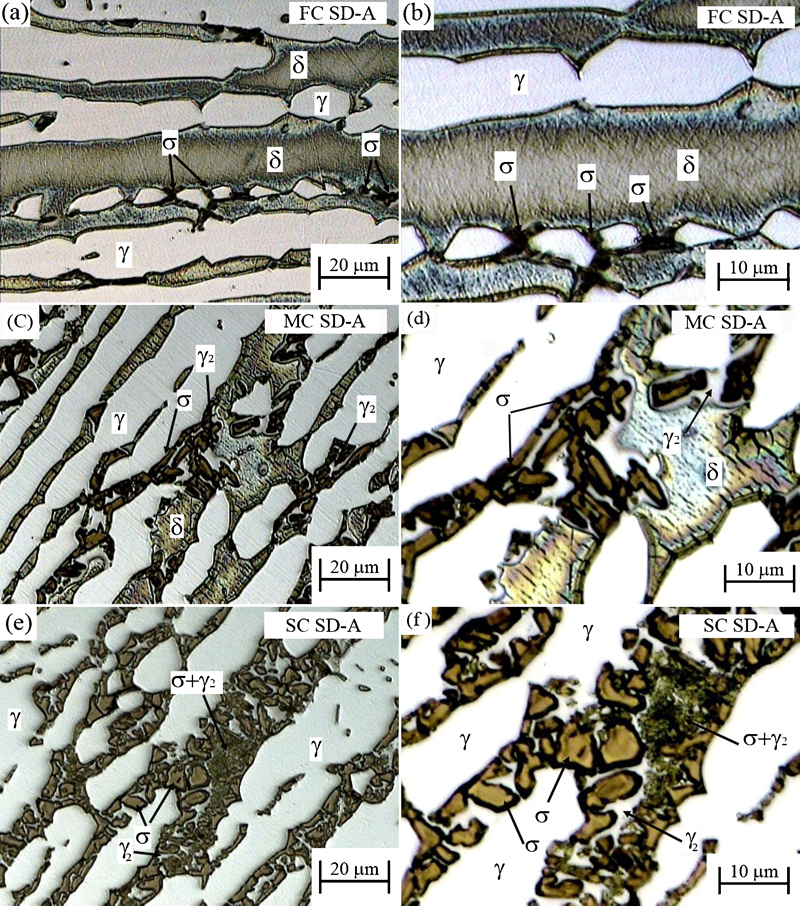
Deleterious phases precipitated by continuous cooling in SD-A samples: OM
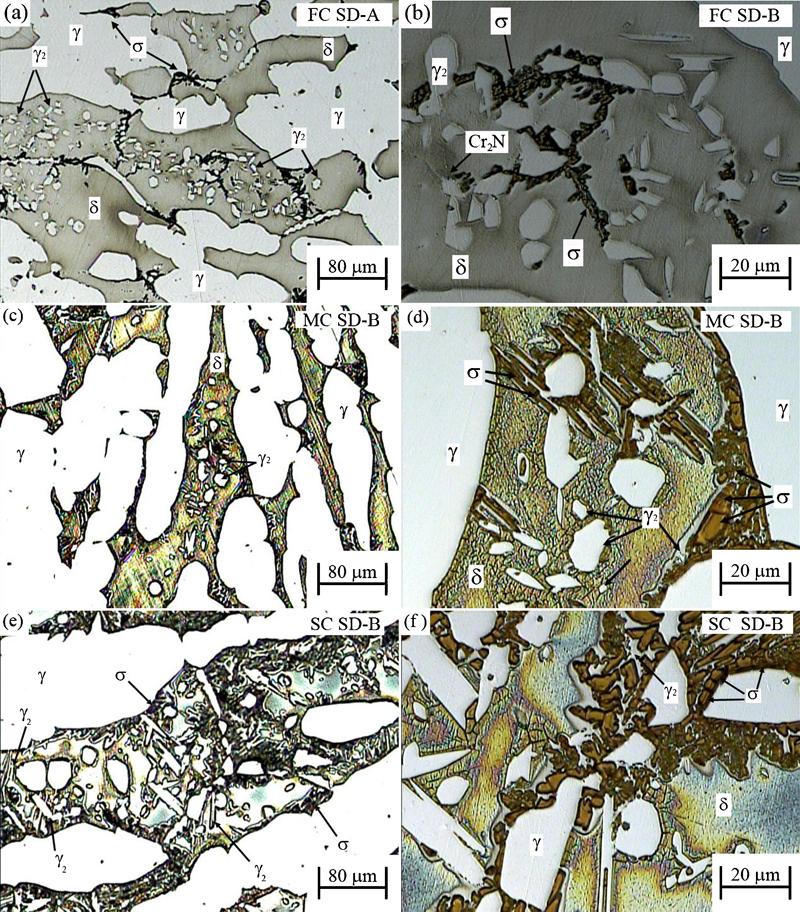
Deleterious phases precipitated by continuous cooling in SD-B samples: OM
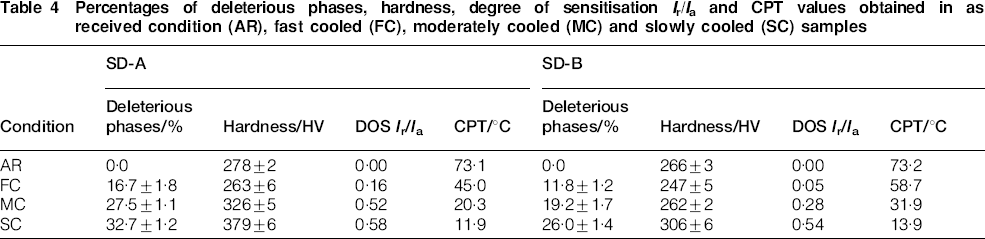
Percentages of deleterious phases, hardness, degree of sensitisation Ir/Ia and CPT values obtained in as received condition (AR), fast cooled (FC), moderately cooled (MC) and slowly cooled (SC) samples
In specimens of SD-A FC (Fig. 4a and b), the deleterious phases constituted mainly by σ phase precipitated preferentially in the δ/δ and γ/δ boundaries. Comparatively, in SD-B FC (Fig. 5a and b), the precipitation of σ phase and γ2 particles in the ferritic phase is clear. The γ2 can be precipitated from the Cr2N particles or independently involving diffusion mechanisms.
The comparison of SD-A MC with SD-A FC shows that the decrease in cooling rate produces the coarsening of σ plates and the formation of γ2 around them (Fig. 4c and d). Accordingly, the SD-A SC shows σ plates coarser than the FC and MC specimens, as can be seen in Fig. 4e and f.
Figure 6 shows the cooling curves obtained with FC, MC and SC and determines the residence time in the interval of 950–800°C. In SD-A SC, the greater permanence in this range of temperature has promoted almost the complete transformation of ferrite by reactions δ→γ2, δ→χ→σ, δ→σ and δ→σ+γ2 (lamellar eutectoid divorced).
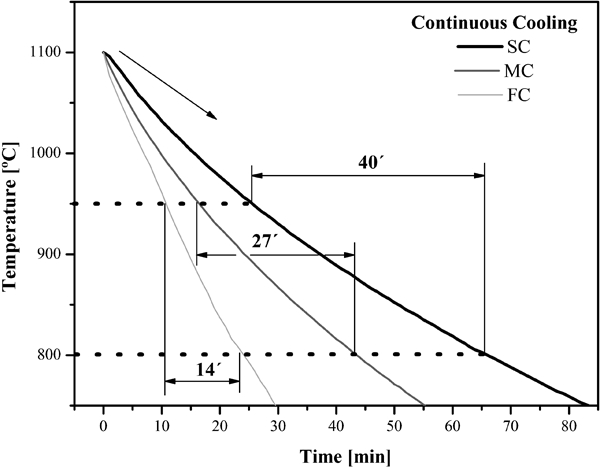
Residence times in 950–800°C range in continuous cooling curves of SD-A and SD-B: FC, MC and SC samples
The microstructures of SD-B with MC and SC are shown in Fig. 5 (c-d) and (e-f), respectively. As pointed out, the amount of deleterious phases precipitated are smaller than in specimens SD-A MC and SD-A SC (Table 4). In addition, in the SD-B SC sample, the ferrite phase was not completely decomposed, differently from SD-A SC behaviour. In general, SD-B also has more γ2 than SD-A, and this phase is also observed as allotriomorphic and needle shaped precipitates.
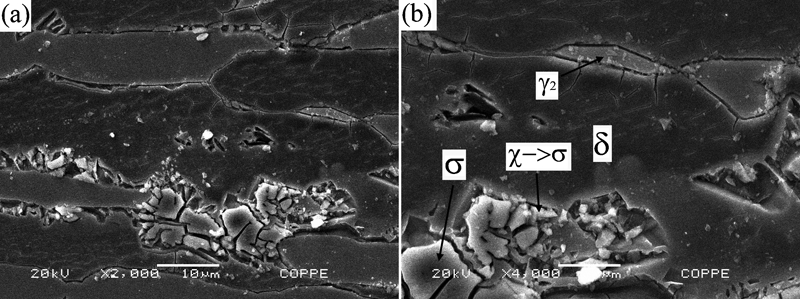
Figures 7 and 8 show the microstructures of SD-A and SD-B FC and SC observed in BSE mode in SEM, where it is possible to have a better identification of the deleterious phases.7–9 The χ phase corresponds to the small light particles precipitated at the grain boundaries. These particles appear isolated in the FC specimens, but the SC samples show that they are surrounded by σ phase, suggesting that χ→σ is taking place.
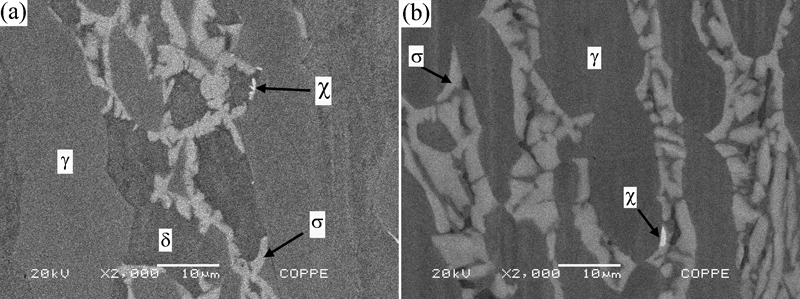
Characterisation of deleterious phases precipitated by continuous cooling treatment in SD-A samples: SEM-BSE
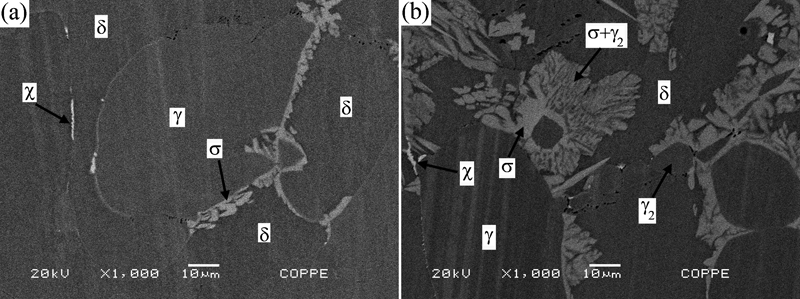
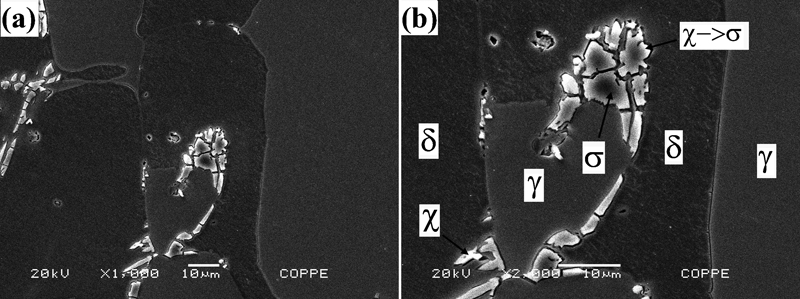
Characterisation of deleterious phases precipitated by continuous cooling treatment in SD-B samples: SEM-BSE
Figures 9 and 10 show the microstructure obtained with SE in the SEM with KOH etching in SD-A FC and SD-B FC respectively. These figures confirm the higher kinetics of deleterious phases in SD-A.
Characterisation of deleterious phases precipitated in SD-A FC: SEM-SE
Characterisation of deleterious phases precipitated in SD-B FC: SEM-SE
All the facts described may occur in heat affected zones of welding joints of SDSS steels. In general, the coarser grain sizes in DSS and SDSS are characteristic from bars, shapes, flanges and fitting components, and finer grain sizes are commonly found in cold rolled and annealed tubes and pipes.
The hardness values are presented in Table 4 for the AR and heat treated SD-A and SD-B samples. In both steels, the hardness values did not increase with the FC treatment, and even a small softening is observed. In SD-B MC, the hardness was also similar to the AR condition. This is a very interesting result, which shows that the precipitations of 16·7 of deleterious phases in SD-A and 11·8 and 19·2 in SD-B do not provoke the increase in hardness in continuous cooling specimens. Early works by Tavares et al.6 and Pardal et al.12 have shown that the hardness was not affected in the early stages of aging in isothermally treated samples. The results presented by Gunn2 suggest that the hardening effect of the σ phase starts after the precipitation of 10 of this phase. It is worth noting that the phases quantified by OM in the present work include not only σ but also χ and γ2.
The harmful effects of deleterious phase are the drastic embrittlement and corrosion resistance decay. It is reported that 5 of σ phase promotes the decrease in toughness values to the minimum allowed.5 For this reason, the hardness test does not represent a reliable method to detect σ phase precipitation during fabrication and assembly of components built with DSS and SDSS.
Table 4 also shows the DOS (Ir/Ia) and CPT values obtained for AR and heat treatment specimens. Figure 11 compares the variations of DOS and CPT as functions of heat treatments in the two materials investigated. It is found that, as a consequence of the higher kinetics of precipitation, the drop in the CPT values and the increase in the DOS are more pronounced in SD-A steel.
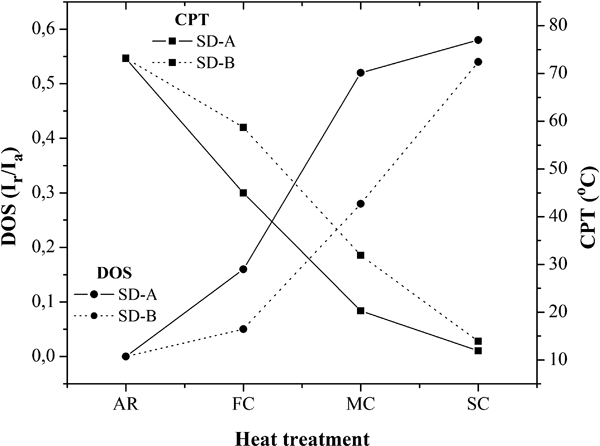
Degree of sensitisation (DOS) and critical pitting temperature (CPT) as function of heat treatments in SD-A and SD-B
Special attention was paid in the specimens FC. In the solution treated state (AR), both SD-A and SD-B samples did not show reactivation peaks in DL-EPR tests. The CPTs measured in these samples were 73·1 and 73·2°C respectively. In the FC treatment, the precipitation of 16·7 of deleterious phases in SD-A promoted the drop of CPT to 45·0°C and an increase in DOS to 0·16. This value was higher than the limit of 0·05 proposed by Lopez et al.4 in tests performed in UNS S31803 using the same electrolyte employed in the present work but at 30°C. In SD-B FC, the DOS (Ir/Ia = 0·05) was not so high as SD-A FC, which is a consequence of the lower amount of deleterious phases (11.8). The results show that the DL-EPR tests are a potential tool for non-destructive detection and characterisation deleterious precipitation in base metal and welds joints of SDSS. Portable cells have been developed for this type of test.19
The analysis of the specimens after the electrochemical tests gives complementary information. Figure 12 shows the working electrode surface of SD-A FC and SD-B FC after the DL-EPR tests. The dark regions indicated by white arrows are Cr depleted areas that were corroded during the test.
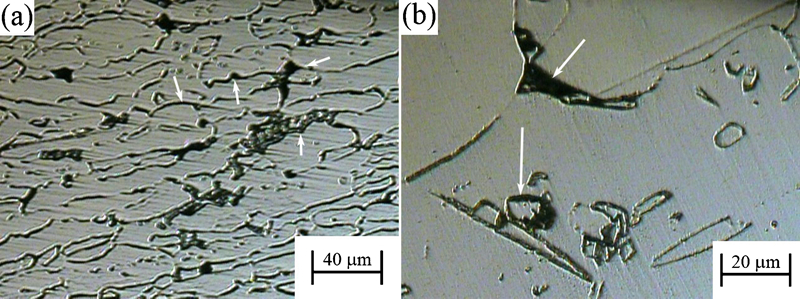
Working electrode surface after DL-EPR tests: OM
Figures 13 and 14 show the working electrode surfaces after the CPT tests of SD-A and SD-B FC and SC respectively. As can be seen, the pits represented by dark regions are greater in the SC specimens, in agreement to CPT values. However, by comparing Figs. 13 and 14, it can be seen that the pits are greater in SD-A than in SD-B.
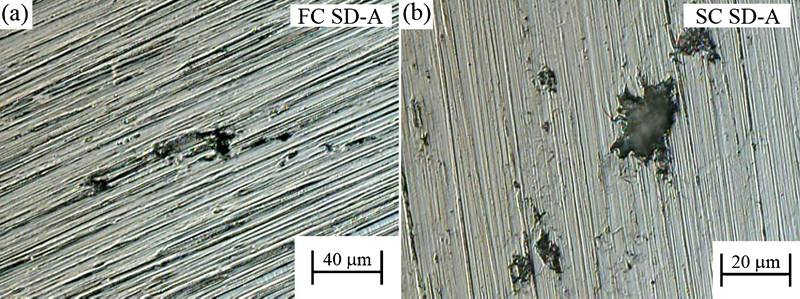
Working electrode surface after CPT tests: OM
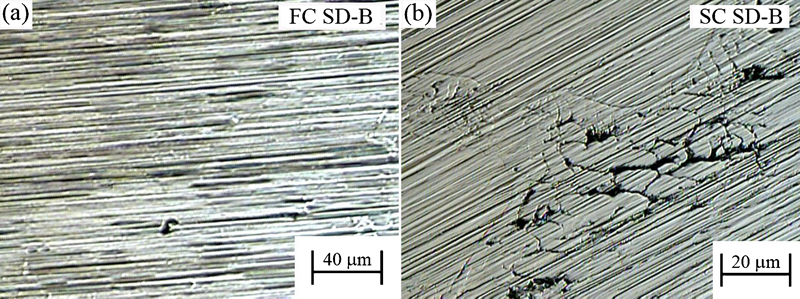
Working electrode surface after CPT tests: OM
Conclusions
The deleterious phase precipitation in SDSS during continuous cooling from 1100°C was investigated. Two UNS S32750 steels with similar composition but different grain sizes were studied. The main conclusions are the following.
Continuous cooling from 1100°C produces the decomposition of ferrite phase in a mixture of σ phase, secondary austenite γ2 and a minor quantity of χ. These deleterious phases were quantified by 15 KOH electrolytic etching, and the individual identification of these phases was obtained by BSE image in the SEM.
Some differences were found between the fine grained (SD-A) and the coarse grained (SD-B) materials. The kinetics of precipitation during continuous cooling was higher in SD-A, while a higher amount of γ2 was observed in SD-B.
A relationship between the amount of deleterious phases and the DOS measured by electrochemical potentiodynamic tests (DL-EPR) was observed. The decrease in the CPT was also related to the amount of phases precipitated.
The degradation of corrosion resistance with decreasing cooling rate was observed in both materials, but in SD-A (fine grained), it was faster due to its higher kinetics of precipitation.
Footnotes
Acknowledgements
The authors thank the Brazilian research agencies CAPES, FAPERJ and CNPq for the financial support.