
Abstract
X-ray diffraction, positron annihilation Doppler broadening spectroscopy and magnetic measurements have been used to investigate the effect of deep drawing on the generation of structural defects in austenitic Mn-based twinning induced plasticity steels. The effects of plastic deformation and hydrogen on structural defects in austenitic Mn-based twinning induced plasticity steels have not extensively been investigated, leaving the understanding of the effect of the deformation mechanisms involving twinning or plasticity induced transformation on the structural defects incomplete. X-ray diffraction measurements show an initial increase in defect concentration with increasing equivalent strain. Positron annihilation Doppler broadening revealed the existence of two defect types with a different degree of open volume. The interpretation in terms of dislocations, stacking faults and/or twins corroborated with the line broadening results from X-ray diffraction measurements. Magnetisation measurements revealed the formation of α′ martensite, which was related to the fraction of positrons annihilating at smaller structural defects. The presented findings attribute the larger defect type to dislocations, whereas the smaller defect type is attributed to partial dislocations and is consequently related to twinning or plasticity induced transformation.
Introduction
The use of advanced high strength steels in the automotive industry has significantly increased in the last decade in order to improve safety and fuel economy. One of the latest developments is austenitic Mn-based twinning induced plasticity (TWIP) steel. Austenitic Mn-based TWIP steels combine high strength with high ductility. These superior mechanical properties are a result of deformation mechanisms involving twinning or plasticity induced transformation, 1 1,2 which are related to the austenite (γ) stability. Austenite with a lower stability can deform by means of γ→ϵ→α′ transformation, resulting in a high workhardening rate. In addition to usual application issues like formability and weldability, a problem encountered with austenitic Mn-based TWIP steels is delayed fracture. Delayed fracture is the phenomenon that even after ‘successful’ forming, fracture may occur after some time. The delay time until fracture has been observed to range from seconds to weeks.3
Plastic deformation increases the susceptibility to hydrogen embrittlement due to the formation of structural defects, such as dislocations and vacancies. 4 4,5 This interaction has often been related to the phenomenon of delayed fracture.5 Research on the joint action of hydrogen and defects in metals has been carried out experimentally and theoretically. 6 6,7 Still, the direct observation of defects remains difficult, impelling the use of indirect measurement techniques, with X-ray diffraction (XRD) as the most commonly used one. This technique is based on the fact that stress fields around defects, in particular dislocations, distort the lattice and produce line broadening.8 Positron annihilation is a more sophisticated indirect technique capable of distinguishing between different open volume defect types. Several positron annihilation studies 9 9,10 investigated the effects of plastic deformation, annealing and hydrogen on the structural defects in metals. However, in austenitic Mn-based TWIP steels, these effects have not been investigated extensively, leaving the understanding of the effect of the deformation mechanisms involving twinning or plasticity induced transformation on the structural defects incomplete. In the present work, XRD, positron annihilation Doppler broadening spectroscopy and magnetic measurements were used for an experimental study on the effect of plastic deformation on the generation of structural defects in austenitic Mn-based TWIP steels. To this purpose, the characteristics of defects were studied along the wall of deep-drawn cups, representing a gradually changing deformation state.
Experimental
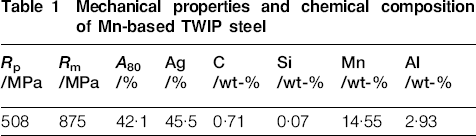
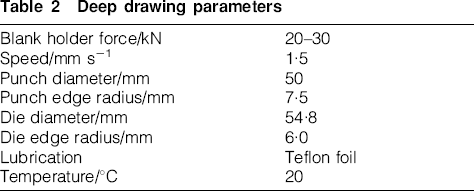
The examined material was a 1·7 mm thick Mn-based TWIP steel grade that has a fully austenitic microstructure at room temperature. The mechanical properties and chemical composition of the Mn-based TWIP steel are shown in Table 1. The cold rolled and annealed and recrystallised material was cut into round blanks with a diameter Db of 102·5 mm using water jet cutting technology. The blanks were formed into cups (see Fig. 1, inset) with a final height of 42 mm on an Erichsen press using a punch with a diameter Dp of 50 mm. This resulted in a deep drawing ratio Db/Dp of 2·05. Other relevant deep drawing parameters are shown in Table 2.
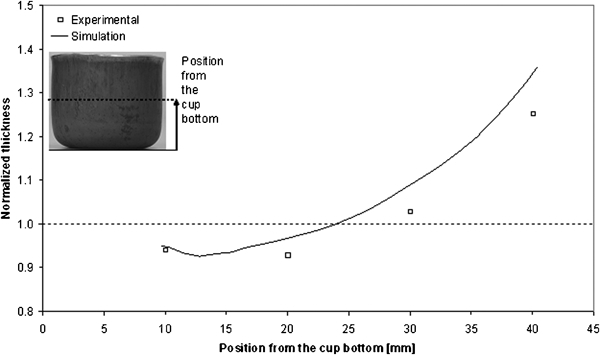
Effect of deep drawing on cup wall thickness, experimentally and according to finite element method (FEM) simulation: normalised thickness is plotted as function of position from cup bottom; inset shows example of deep-drawn cup
Mechanical properties and chemical composition of Mn-based TWIP steel
Deep drawing parameters
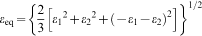
Finite element method (FEM) simulations using Pam-Stamp 2G software were performed to calculate the local strain conditions resulting from deep drawing. For the material model, one is referred to Ref. 11. The equivalent strain is defined as
In the present study, four cups were investigated:
a deep-drawn cup
a deep-drawn cup subsequently annealed in a hot air furnace for 15 min at 400°C
a deep-drawn cup subsequently electrolytically hydrogen charged at a current density of 33A m−2 for 300 s
a cup annealed and hydrogen charged.
The structural defects resulting from plastic deformation during deep drawing were examined as a function of the position from the cup bottom starting at 10 mm with 5 mm intervals.
X-ray analysis was performed on the deep-drawn cup using a Bruker AXS D8 Discover diffractometer with Eulerian cradle. Co Kα radiation was used for conventional θ–2θ scans. The diffraction patterns were recorded using a step size of 0·02° in 2θ, and the intensity was evaluated by DIFFRACplus Basic Evaluation Package 14. The XRD line broadening was determined by the integral breadths.
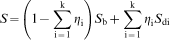
All the cups were examined by positron beam Doppler broadening spectroscopy, performed with the Delft variable energy positron beam.12 Positrons emitted from a 22Na source are, after moderation to thermal energy and subsequent controlled acceleration, injected in the samples with a kinetic energy of 25 keV. In steels with a density of 7800 kg m−3, the implantation energy of 25 keV corresponds to an implantation depth of ∼1 μm. The beam intensity is 104 positrons per second, and the beam diameter at target is ∼8 mm. After having slowed down to thermal energy, each positron eventually annihilates with an electron in the material. The electron involved can either be a relatively free valence electron or a relatively strongly bound core electron. Because of the conservation of energy and momentum, the annihilation results in the emission of two annihilation γ-quanta with energy of ∼511 keV each, emitted in (nearly) opposite directions. The positive or negative momentum component of the electron in the direction of the γ-emission (p//) Doppler shifts the measured γ-energy by

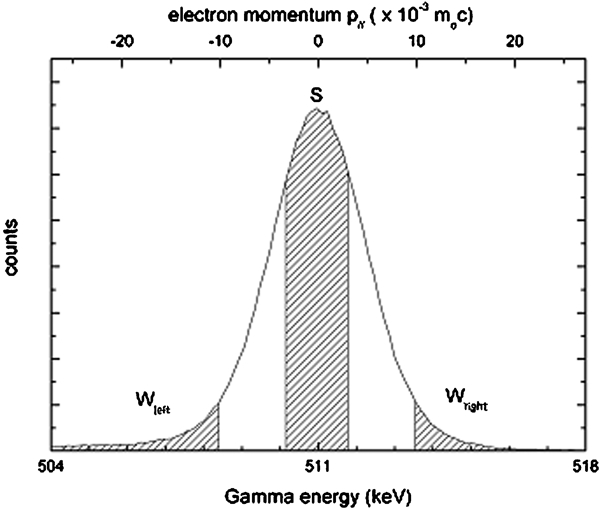
Annihilation γ spectrum ∼511 keV photopeak: specific line shape parameters S and W are calculated as ratios of counts registered in fixed central momentum window (S: |p//|<3·5×10−3moc) or from the high-momentum regions (W: 10×10−3moc<|p//|<26×10−3moc) to total number of counts in photopeak
The examined positions corresponded to the centre of the positron beam. Three Doppler broadening spectra were obtained for each position to check the reproducibility. This accounted for a minimum of 3×10⁶ registered positron annihilations per position.
The magnetisation of the deep-drawn cup at the appropriate positions from the cup bottom was examined with a gaussmeter (RFL model 912 gaussmeter, Dowty RFL Industries Inc.) in the radial, axial and tangential planes.
Results
Figure 3 shows the integral breadth of the {111} γ reflection as a function of the position from the cup bottom. For each examined position, the appropriate equivalent strain resulting from the FEM simulations is given along the horizontal axis. In the XRD data, all the observed reflections showed the same trend; therefore, for clarity, only the data for the {111} γ reflection are plotted. With increasing strain, the deep-drawn sample shows an initial increase in integral breadth followed by a small decrease.
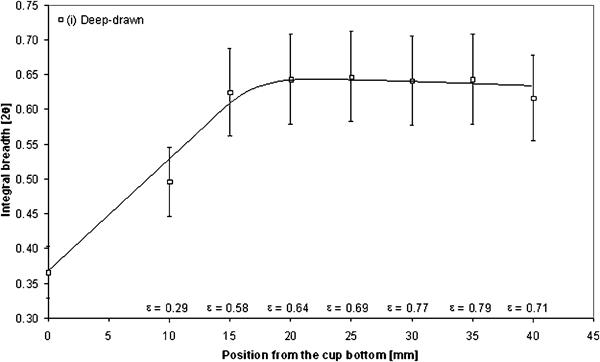
Integral breadth of {111} γ reflection as function of position from cup bottom and appropriate equivalent strain derived from FEM simulation: drawn line is to guide eye
Figure 4 shows the normalised S and W parameters as a function of the position from the cup bottom. The normalisation is with respect to the reference state of the material, which was accomplished by annealing for 1 h at 800°C to minimise the defect concentrations. For each examined position, the appropriate equivalent strain resulting from the FEM simulations is given along the horizontal axis. With increasing strain, all the results show an initial increase in S parameter followed by a small decrease for non-annealed cups. The W parameter shows an initial decrease with increasing strain for all the results and eventual saturation for the non-annealed cups. The fraction of positrons trapped and annihilated at defects increases as a result of deep drawing and to a lesser degree from H charging. Annealing decreases the concentration of defects, thereby lowering the fraction of trapped positrons. As a result, the material approaches the low defect concentrations of the reference state at 10 mm from the cup bottom, whereas at higher equivalent strains, the applied annealing treatment is not sufficient to fully remove the deformation induced structural defects. Given the lower fraction of trapped positrons after annealing, the effect of hydrogen is more pronounced.
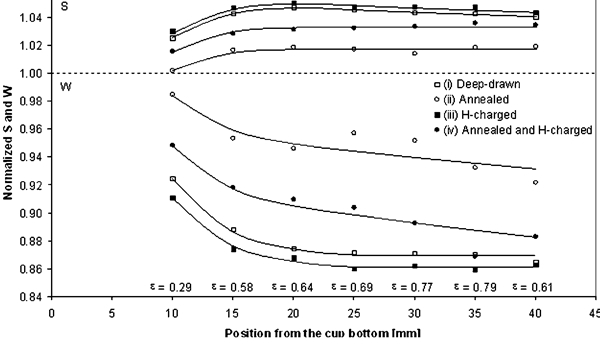
S and W parameters as function of position from cup bottom and appropriate equivalent strain derived from FEM simulation: error is approximately size of symbols; drawn lines are to guide eye
Figure 5 shows the effect of annealing and/or H charging on the combined W–S characteristics as a function of the position from the cup bottom. Starting from reference point R, all the curves initially (that is, for low cup heights) are close to the line connecting the points R and D1. In the literature, gradients dW/dS similar to the slope of the line R–D1 are attributed to the formation of dislocations or vacancy type defects. 14 14,15 With increasing deformation along the cup wall, the W–S characteristics start to deviate from the line R–D1. The observed trends for the different cups converge in a second specific point D2 in the W–S map. The observed change in slope indicates the development of a different (as seen by the positrons) type of defect along the cup wall. Since the normalised S values are much smaller than those reported for vacancy type defects, both defect types can be associated with dislocations, with the defect type related to point D2 having the smaller volume as follows from its lower S value. Using equation (2), the trapping fractions η1 and η2 have been calculated assuming two defect trapping states with characteristic S–W values S1 = 1·052 and W1 = 0·870 for defect D1 and S2 = 1·037 and W2 = 0·860 for defect D2. The result is given in Figs. 6 and 7 as a function of the position from the cup bottom. It is observed that for deformation to relatively low strain levels, η1 initially increases as a function of the position from the cup bottom. For cup heights above 25 mm, positron trapping at the second defect type D2 starts to increase at the expense of trapping at defect D1.
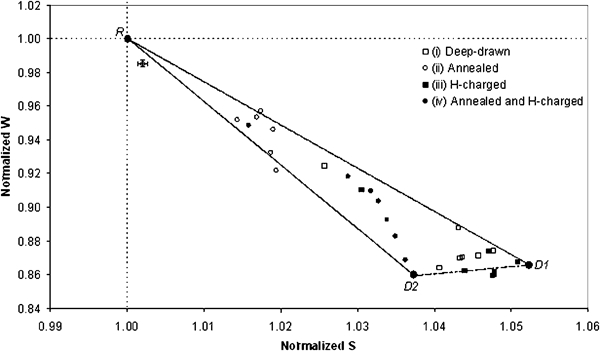
W–S map for austenitic Mn-based TWIP steel cups as function of position from cup bottom
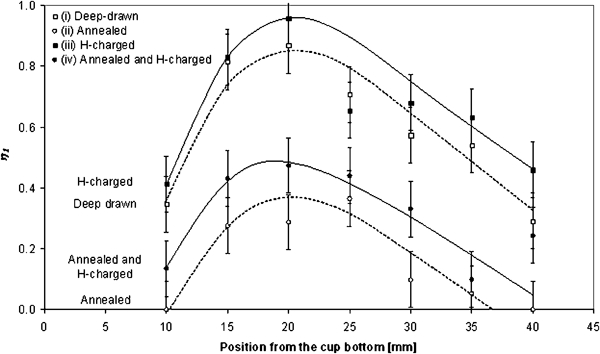
Fraction η1 of positrons trapped at defect type D1 as function of position from cup bottom
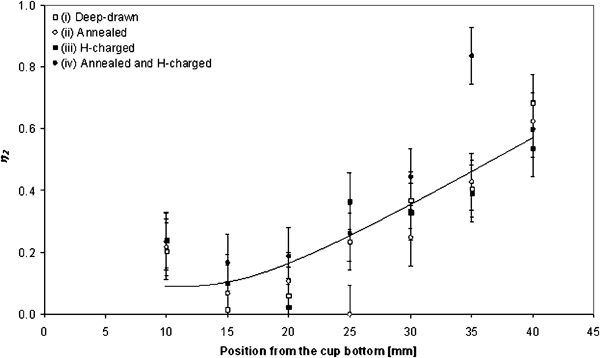
Fraction η2 of positrons trapped at defect type D2 as function of position from cup bottom
On the basis of the observed XRD line broadening alone (Fig. 3), it is not possible to distinguish between different defect types. Hence, in Fig. 8, the total fraction of positrons trapped at the defects η1+η2 is plotted against the integral breadth. From this figure, it is concluded that for the deep-drawn cup, the integral breadth varies linearly with the total positron trapping fraction η1+η2.
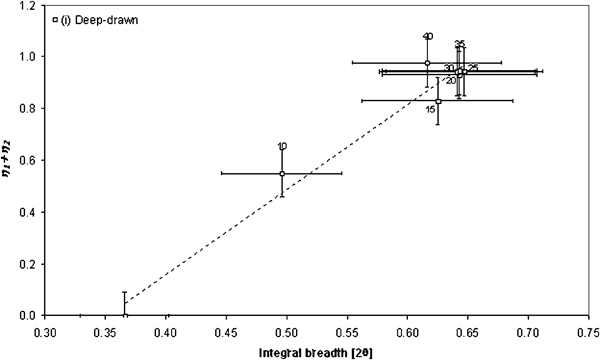
Total defect fraction η1+η2 as function of integral breadth of {111} γ reflection for deep-drawn cup
Magnetic measurements were performed to verify changes in the fraction of ferromagnetic phases, which can reveal the formation of α′ martensite. Figure 9 plots the magnitude of the local magnetic flux density caused by local magnetisation as a function of η2 for the deep-drawn cup (at 40 mm, the magnetisation could not be determined). Clearly, the magnetic flux density increases approximately linearly with the increase in η2. No such relationship could be found when the data were plotted as function of η1 or η1+η2.
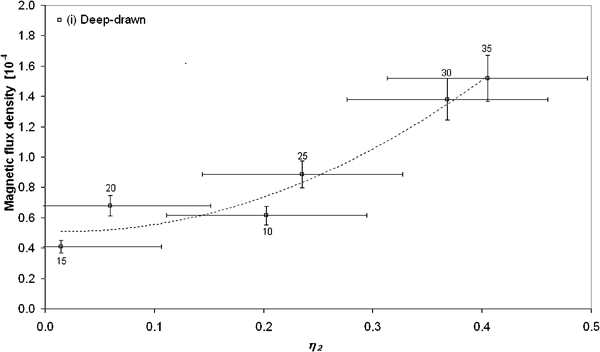
Magnetic flux density as function of positron trapping fraction η2 for deep-drawn cup
Discussion
Three indirect measurement techniques were used to investigate the generation of structural defects in austenitic Mn-based TWIP steels due to deep drawing. With increasing strain, the XRD measurements indicate an initial increase in defect concentration followed by a small decrease starting at 20 mm from the cup bottom. The positron annihilation results reveal that at least two types of positron trapping defects emerge with concentrations depending on the local strain conditions in the cup wall. Finally, magnetisation measurements revealed an increase in the fraction of ferromagnetic phases, most likely the α′ martensite content.
The development of the positron annihilation characteristics shows that at low strain values, the deformation in austenitic Mn-based TWIP steel is facilitated by dislocation slip. The W–S map and the derived trapping fractions, together with the results in the literature, 14 14,15 suggest that η1 can be related to normal dislocations. This assumption is further corroborated by the fact that η1 is sensitive to annealing and H charging. Indeed, annealing shows a similar effect on dislocations as stress relief. The introduction of hydrogen decreases the repulsive force and interaction energy between dislocations, resulting in increasing dislocation mobility. 7 7,16 In combination with residual stress, this may increase the dislocation density, which is reflected by the increase in the trapping fraction η1 observed in Fig. 6.
At higher strain, deviating defect characteristics are observed. Since the S parameter for defect type D2 is structurally lower but otherwise comparable to that of defect type D1, the related defect can be expected to be also dislocation like. A partial dislocation is a likely candidate to account for this observation. Partial dislocations play a role in twinning and plasticity induced transformation and can therefore be expected to be generated in this material. The dissociation of a normal dislocation into two Shockley partial dislocations (and consequently a stacking fault) is known to evolve differently for tension and compression deformation. According to Christian and Mahajan,17 this dissociation, on average, is more favourable under compression than under tension. The FEM simulations in Fig. 1 indicate that above 25 mm from the cup bottom, the material is in compression. Partial dislocations have a smaller Burgers vector than perfect dislocations and consequently lead to a smaller normalised S value. This and the fact that above 25 mm the material is in compression further confirm the suggestion that η2 is related to partial dislocations. These partial dislocations play a role in twinning and plasticity induced transformation and can be accompanied by stacking faults, twins and ϵ and α′ martensites. 18 18,19 Because of their thermal stability 17 17,19 and the fact that η2 is hardly sensitive to annealing (see Fig. 7), we have another reason to relate η2 to partial dislocations. In addition, the limited sensitivity of η2 to hydrogen may be due to the smaller defect size, which results in the defect being a less attractive trapping site.
The observed relationship of the XRD line broadening with the positron annihilation results corroborates the interpretation of the observed effects in terms of dislocations. On the other hand, the magnetisation measurements show that α′ martensite formation takes place in the upper half of the cup. The fraction of martensite formed scales linearly with the trapping fraction η2 (Fig. 9). It is therefore likely that α′ martensite forms through plasticity induced transformation. The presence of α′ martensite can be accompanied by ϵ martensite and twins.19 The present findings attribute the defect type related to η1 to dislocations, whereas the defect type related to η2 is attributed to partial dislocations and defects related to twinning or plasticity induced transformation, which is shown to lead to the formation of α′ martensite. It is interesting to emphasise that the trapping fraction η2 is found to show increasing values above a cup height of 20–25 mm (see Fig. 7). It is at this cup height that the deformation state undergoes a transition from tensile to compressive (see Fig. 1). The formation of α′ martensite, as observed in magnetisation measurements (Fig. 9), can therefore be concluded to correlate to the mode of deformation being stronger in compression.
Conclusions
The presented investigation on the effect of deep drawing on defect generation in austenitic Mn-based TWIP steels leads to the following conclusions.
Positron annihilation detects that two different defect types result from plastic deformation during deep drawing. The two defect types can be expected to be dislocations and partial dislocations.
Magnetic field measurements reveal the formation of α′ martensite, which correlates with the density of the defects identified as partial dislocations. Martensite formation only takes place in those regions of the deep-drawn cup that are subjected to compressive deformation.
Footnotes
Acknowledgements
This research was carried out under project no. MC5·07292 in the framework of the Research Program of the Materials Innovation Institute (M2i) (![]() ). The support of M2i, Tata and SKF is gratefully acknowledged. The authors want to thank M. de Bruine (Tata) and M. Faid (SKF) for their technical support in the deep drawing and H charging experiments respectively. The authors also want to thank P. Kömmelt for performing the FEM simulations.
). The support of M2i, Tata and SKF is gratefully acknowledged. The authors want to thank M. de Bruine (Tata) and M. Faid (SKF) for their technical support in the deep drawing and H charging experiments respectively. The authors also want to thank P. Kömmelt for performing the FEM simulations.