
Abstract
For pricing reasons the extent of metallurgical treatment often is questioned about its influence on bearing performance. In this paper steels with three different quality levels are compared with regards to cleanliness and fatigue resistance.
Introduction
Bearing steels are usually fabricated by expensive metallurgical processes. Some standard practices are extensive ladle treatment, such as vacuum degassing for reduction of oxygen content, and Ar gas bubbling for the separation of non-metallic inclusions from liquid steel and finally gas shrouding during casting to prevent reoxidation.1 All the steps are costly, and their use varies across different steel companies, which results in different pricing. These costs are frequently questioned about the effect on bearing performance. The present paper compares three bearing steels with different quality levels as produced by different metallurgical treatments. The cheapest was ∼25% lower in cost as compared to the average.
Selected steels
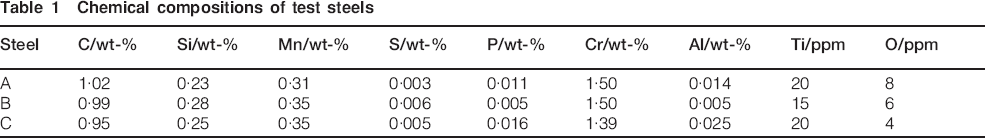
The three steels were melted from scrap by three different steel plants. Plant A, not supplying to Schaeffler, was known for low quality, plant B for European standard quality and plant C for European premium quality. Therefore, different metallurgical treatments were estimated. Paperwise, the three steel companies were the same in treating liquid steel: melting was performed from scrap mainly, and the metallurgical treatment was performed in a ladle followed by degassing in a vacuum vessel. All the steels were produced by continuous casting with strand sizes of ∼240×240 mm and rolled to a bar dimension of 60 mm round. The test materials were taken from the first heat of a sequence after cropping of ∼6 m. The chemical compositions of the main alloy and trace elements are listed in Table 1. Oxygen measurement was performed by the combustion method with three specimens per heat. The single measurements deviated ∼2 ppm from the average.
Chemical compositions of test steels
The first characterisation step was an ultrasonic immersion test according to SEP 19272 with a detectability of 0·3 mm flat bottom hole. While steels B and C showed no indication, steel A revealed three indications per meter test length in average, and the indications ranged from 0·3 to 0·5 mm flat bottom hole.
The next characterisation was a cleanliness rating against EN50602. The results are given in Table 2.
Cleanliness ratings of test steels according to EN50602
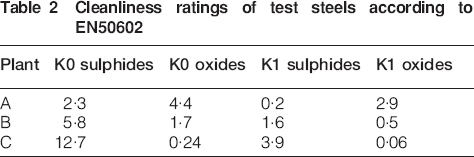
All the three steels were well in line with the requirements of K4<6 as recommended by Annex B of the international bearing steel standard ISO 683/XVII. The carbide banding for all three steels was rated 7·2 according SEP 1520.
The next step was an inclusion characterisation under a scanning electron microscope. Cuts were taken perpendicular to the rolling direction, heat treated, ground and polished down to 0·5 μm diamond quality. An area of 100 mm2 was scanned using an image analyses software. The inclusions found with an inclusion size of ⩾2 μm were analysed by EDX and mapped in a ternary oxide chart. The results are shown in Fig. 1.
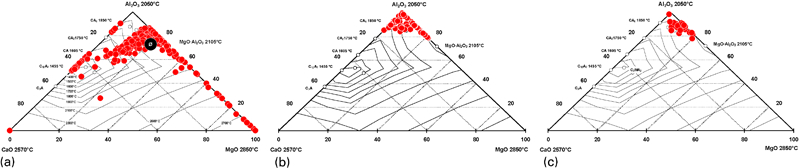
Ternary oxide systems
In total, 187 oxides/cm2 were detected in steel A, 76 oxides/cm2 in steel B and 31 oxides/cm2 in steel C.
Differences in composition are clearly visible. The position of heat A indicates in the ternary CaO–MgO–Al2O3 system that there is a problem with the refractory applied in ladle and/or tundish. Additionally, the presence of CaO containing inclusions in the edge system CaO–Al2O3 might be caused by emulsified top slag particles during ladle treatment and/or slag carryover from ladle to tundish. Heat B is located in the Al2O3 corner of the system with some CaO and MgO. Heat C is positioned in the high melting region of Al2O3 and MgO.Al2O3 spinel in the Al2O3–MgO edge system. A well performed ladle metallurgy characterised by sufficient inclusion separation and good shielding of the liquid steel melt against reoxidation results in the numbers of oxides of 187, 76 and 31 oxides/cm2 respectively.
The next step of characterisation was the determination of the extreme values of inclusions according to ASTM E2283.3 For the evaluation, six specimens were taken randomly from six different bars. For each measurement, an area of 200 mm2 was investigated under a microscope at ×100 magnification. The microscope used an image analyser for documentation. Every specimen was measured four times with intermediate regrinding and repolishing. The results are given in Fig. 2.
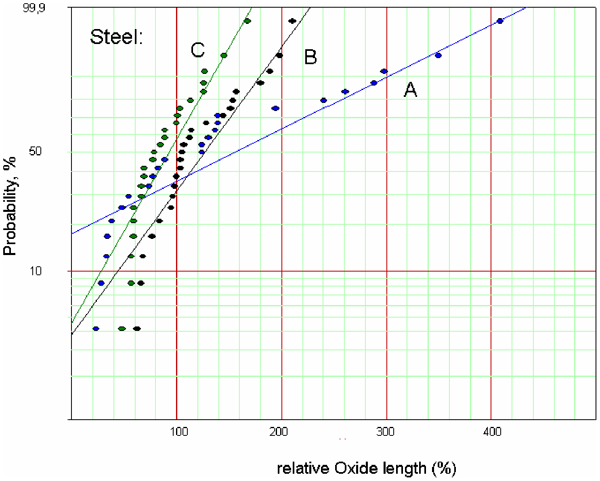
Oxide length distributions
As can be seen in Fig. 2, the maximum oxidic inclusion length in steel A is ∼2·5 times, and in steel B, it is 1·2 times the size of inclusions in steel C. The slope of graph A points to the existence of a high number of larger inclusions, typical for a refractory based problem.
For a first over-rolling test, a set of 12 discs (50 mm diameter and 10 mm thick) were cut from each steel; for steel A, a bar segment was used without ultrasonic indication. The discs were hardened and tempered to ∼61 HRC (3–4% retained austenite as measured by X-ray diffraction), ground and polished to a roughness Ra of 0·05 μm. Over-rolling was performed in a disc tester at 4800 MPa. The ball diameter was ∼7 mm, with 12 balls per bearing, and the system was oil lubricated by Mobile Velocite Nr.3. The test was terminated at 500 h if no failure occurred.
The results are summarised in Fig. 3.
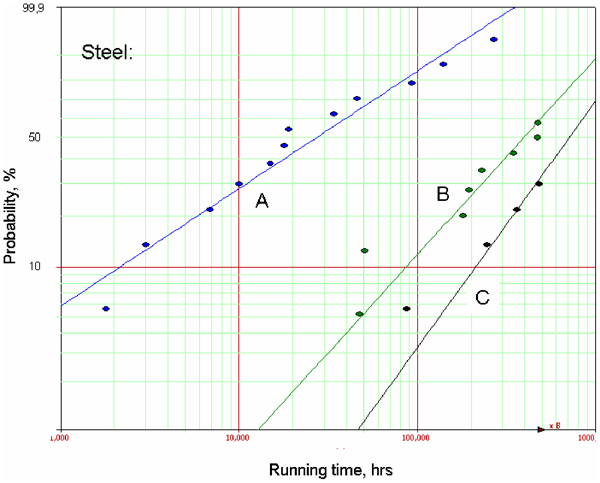
Failures of over-rolled discs at contact pressure of 4800 MPa
It is clearly visible that the difference in content and size of oxides is duplicated in endurance performance. The difference between best and worst is nearly a factor of 100. To verify inclusions as a cause for failures, in particular, the early failed specimens were investigated by SEM, and in many cases, the residuals of non-metallic inclusions were detected in the pitting.
The test conditions of such highly loaded over-rolling tests are argued to be not representative for typical bearing applications. The load is clearly above the static bearing capacity of 4000 MPa, and by this, plastic deformation in the raceway occurs. Even small defects and inclusions can cause failure under this load, while the same features are without influence at lower loads.
Therefore, a second over-rolling test was set up more in the range of regular service conditions. Twenty-four ball bearings 6206 were used for this test per set. The rings were machined directly from the bars and heat treated in the same way as the discs before. The rings were ground and honed to a surface roughness Ra of 0·03–0·05 μm. The over-rolling was performed at 2900 MPa under full elastohydrodynamic lubrication, oil was Shell Morlina 46 and κ was calculated to be 1·27. The contact pressure is above the level of most industry bearings but beyond applications like gearbox bearings in cars. The calculated life according to DIN/ISO 291 for this condition was 18 h. The results for the 10% failure rate (B10) are compared in Fig. 4.
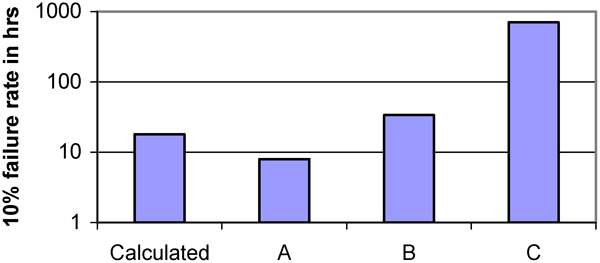
Failure rates (10%) of three test steels for angular contact ball bearings 7205B at contact pressure of 2900 MPa
In addition, here, a significant difference in performance is obvious. While 10% of steel A did not even reach the calculated life, steel C outperformed the calculated life by a factor of 50. Within the calculated B10 life, four early failures occurred in steel A, and no failure occurred in steels B and C. Especially, the early failures are reason enough to leave steel plant A out of the bearing supplier list.
Conclusions
For a long time, the quality of a bearing steel was more or less exclusively combined with the oxygen content of steel, and values below 10 ppm were considered to guarantee a long bearing life. The three steels tested here were certificated with values below this level, so no significant difference in performance had to be expected.
The next indicator for a long bearing life would be the cleanliness value as determined under the light microscope by comparing inclusions with picture charts. Based on the oxidic inclusion ratings as listed in Table 2, differences in bearing life could be expected. However, the absolute differences are not clear.
The tests showing differences between the steels are the SEM evaluation and the maximum value analysis. Both indicate clear differences; in particular, steel A is different compared with the others.
The inclusion types in steel A as determined by the composition indicate a problem with the process stages following metallurgical treatment. This is not reflected by the oxygen content in the certificate because this value is determined at the end of the metallurgical treatment before casting. Therefore, the oxygen content is only one indicator for steel but not sufficient by far.
All in all, the treatments and measured values, such as metallographic as well as life test values, follow a logical sequence. The cheapest steel has at least problems with the refractories used, and in addition, probably the Ar bubbling was insufficient. As a consequence, it contains a lot of larger inclusions, resulting in poor over-rolling behaviour.
In opposite to this, the steel with the best metallurgical practice contains the lowest number of inclusions with a well defined composition. The inclusions are relatively small, and the bearing life is as good as could be expected from the calculated maximum inclusion length.4
From this evaluation, the following can be concluded.
Steel production costs are usually combined with steel quality, at least on the low cost side.
The oxygen content of steel, as given in the certificate, is insufficient for correct quality classification.
The inclusion rating, according to the maximum value analysis, separates steels significantly better than classical rating methods like DIN K.
Inclusion evaluation under SEM is already a strong indicator for the later bearing performance.
The statistical bearing life depends on the largest microscopic inclusions in steel.
Footnotes
This paper is part of a special issue on ‘Bearing steels’