
Abstract
The strengths of the α precipitate and the β matrix were evaluated by nanohardness in the Ti−15Mo−1Fe and Ti−15Mo−3Al alloys and compared to those of the Ti−15Mo alloy. The α phases with similar size (a long axis of a few micrometres and a short axis of a few hundred nanometres), distribution and volume fraction were obtained in three alloys by adjusting the aging temperature. Analyses by SEM-EDS confirmed that Fe and Mo were enriched in the β phase and depleted in the α phase, while Al was enriched in the α phase and depleted in the β phase. Tensile tests were carried out, and the tensile strength was shown to be higher in the Ti−15Mo−1Fe and Ti−15Mo−3Al alloys than in the Ti−15Mo alloy. The nanohardness measurements indicated that the α phase was softer than the β phase in both Ti−15Mo−1Fe and Ti−15Mo alloys, while it was harder in the Ti−15Mo−3Al alloy. The increased tensile strength was mainly caused by the strength of the Fe enriched β phase in the Ti−15Mo−1Fe alloy and by the strength of the Al enriched α phase in the Ti−15Mo−3Al alloy.
Introduction
Since the introduction of the Ti−13V−11Cr−3Al alloy in the early 1950s, 1 1,2 the β titanium alloys have been used for aerospace, automotive and other industrial applications due to their high specific strength and good corrosion resistance.2–5 The β titanium alloys are superior since they show significant strengthening by the second phase precipitation such as the ω and α phases; however, due to an embrittlement problem of the ω phase, 6 6,7 they are usually strengthened by the α phase precipitation. Many types of thermomechanical processing have been developed to control the volume fraction and the morphology of both the α phase and the β matrix for achieving a good combination of strength and ductility.8–10
Many studies have dealt with the importance of the α phase for the high strength β titanium alloys and described its strength affected by the alloying elements qualitatively.11–14 However, there has not been any published work to describe the strength of the α phase itself quantitatively. Since the α phase is relatively fine in the β matrix, it is difficult to evaluate its strength by the conventional macro- or microVickers hardness measurement.
The recent development of the nanoindentation technique 15 15,16 has made it possible to evaluate the macroscopic strength of materials on a submicrometre or nanometre scale, which Ohmura et al.17–19 have reported for body centred cubic single crystals and Fe–C martensitic steels. In the previous work, the present authors20 evaluated the strength of the α and β phases from the nanohardness in the Ti−15Mo binary alloy after aging at 873 K for 36 ks, where the α phase had a long axis of a few micrometres and a short axis of a few hundred nanometres. They found that the α phase was softer than the β phase since Mo was depleted in the α phase and enriched in the β phase.
To obtain a further understanding of the effect of alloying elements on the strength of the α and β phases, the Ti−15Mo−1Fe and Ti−15Mo−3Al ternary alloys were selected for the present study since Fe acts as a β phase stabiliser while Al acts as an α phase stabiliser. In addition, it is important to know whether or not the macroscopic strength of the Ti−15Mo alloys with Fe and Al addition can be explained by the measured nanohardness. For reliable measurement of the nanohardness and evaluation of the macroscopic strength, the microstructure control becomes important, i.e. the size, distribution and volume fraction of the α phase in the Ti−15Mo−1Fe and Ti−15Mo−3Al alloys should be similar to those in the Ti−15Mo alloy.
The purpose of the present study is to investigate the nanohardness of the α and β phases in the Ti−15Mo−1Fe and Ti−15Mo−3Al alloys and discuss the effects of alloying elements on the nanohardness in each phase and the correlation between the nanohardness and the macroscopic strength.
Experimental
Materials preparation
The Ti−15Mo−1Fe and Ti−15Mo−3Al alloys were prepared by cold crucible levitation melting (CCLM). Some data of the Ti−15Mo alloy reported in the previous work20 were used for comparison. The ingots of the two alloys had a diameter of ∼80 and 68 mm respectively, each with a weight of ∼1 kg. Figure 1 shows a schematic drawing of the heat treatments for the alloys. The ingots were homogenised at 1273 K for 3·6 ks, hot forged at 1273 K into blocks of 60×60×40 mm (l×w×t) for the Ti−15Mo−1Fe alloy and 90×40×40 mm (l×w×t) for the Ti−15Mo−3Al alloy and then hot rolled into plates of 240×60×10 and 290×50×10 mm (l×w×t) respectively at 1173 K followed by air cooling (AC). The plates were cut into 40×60×10 and 40×50×10 mm (l×w×t) pieces respectively and were solution treated at 1173 K for 3·6 ks followed by water quenching (WQ). The plates were then aged at various temperatures from 773 to 973 K for 36 ks followed by WQ to investigate the size, distribution and volume fraction of the α phase. The principal axes of the rolled specimens corresponding to the normal direction (ND), rolling direction (RD) and transverse direction are defined as shown in Fig. 1. Table 1 provides the analysed chemical compositions of the alloys after the solution treatment. All the heat treatments were carried out in air. Three alloys had a similar oxygen content of ∼0·1 mass- with little nitrogen and carbon. The present authors20 reported that the contents of O, N and C did not change by further aging treatment. Thus, the effects of these impurities on the strength of the α and β phases after aging were not taken into account in the present study.
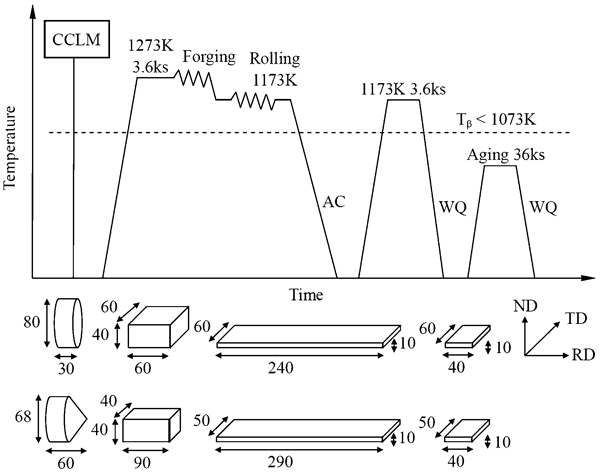
Schematic drawing of heat treatments for Ti−15Mo and Ti−15Mo−1Fe alloys with ingot diameter of 80 mm and Ti−15Mo−3Al alloy with ingot diameter of 68 mm: CCLM, AC and WQ refer to cold crucible levitation melting, air cooling and water quenching respectively
Nominal and analysed chemical compositions of Ti−15Mo, Ti−15Mo−1Fe and Ti−15Mo−3Al alloys/mass-
Microstructural characterisation
The mechanically polished specimens were observed by a field emission scanning electron microscope (FE-SEM), and the elemental distributions in the α and β phases were investigated by energy dispersive spectroscopy (EDS) line analysis performed on a JSM-7001F system. The phase identification and the lattice parameter measurement were made by X-ray diffraction (XRD) analysis with a RINT-2500 diffractometer using a Cu Kα radiation operated at 40 kV and 300 mA. The specimens for microstructural observation and X-ray and SEM-EDS line analyses were cut along the RD and ND of the plates.
Tensile test
The tensile specimens with a width of 4 mm and a thickness of 2 mm in the gage section with a length of 18 mm were cut by electric discharge machining along the RD and transverse direction of the plates. The tensile tests were carried out at ambient temperature with a crosshead speed of 5×10⁻³ mm s−1 (an initial strain rate of 2·78×10−4 s−1).
Nanohardness measurement
The load control nanoindentation tests were carried out using a Hysitron, Inc. triboindenter with a Berkovich indenter. The tip truncation of the indenter was calibrated using a reference specimen of fused silica. The specimens cut along the RD and ND of the plates for the nanoindentation tests were carefully polished mechanochemically. The α and β phases were indented with a peak load of 100 μN in at least 30 positions for each specimen, and the indenter was held at the peak load for 5 s before unloading. After the nanoindentation tests, the size and configuration of the indents on the α and β phases were checked in situ with scanning probe microscopy. The method of Oliver and Pharr21 was used for the tip calibration and the nanohardness calculation.
Results and discussion
Microstructure
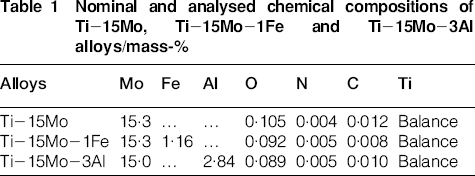
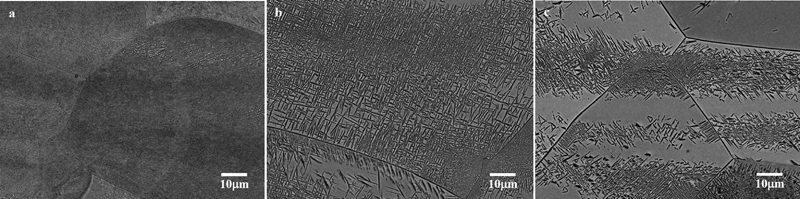
Figure 2 shows the backscattered electron images of the Ti−15Mo alloy after aging at 823, 873 and 923 K for 36 ks. The distribution of the α phase becomes heterogeneous, and the size of the α phase increases with aging temperature. The uniform distribution of the α phase after aging at 873 K, as shown in Fig. 2b, was selected for the nanohardness measurement in the Ti−15Mo alloy, as reported in the previous work.20 Figure 3a shows the microstructure in the Ti−15Mo alloy at higher magnification. The α phase has a long axis of a few micrometres and a short axis of a few hundred nanometres. Meanwhile, the microstructures, such as the finer α phase after aging at 823 K, in Fig. 2a and the heterogeneous distribution of the α phase after aging at 923 K in Fig. 2c were not suitable for measuring the nanohardness and evaluating the macroscopic strength in the present study. In addition, the α phases in the Ti−15Mo−1Fe alloy after aging at 823 K for 36 ks and in the Ti−15Mo−3Al alloy after aging at 923 K for 36 ks, as shown in Fig. 3b and c respectively, were also suitable and selected for the present study.
Images (SEM backscattered electron) of Ti−15Mo alloy after aging at a 823 K, b 873 K and c 923 K for 36 ks
Images (SEM backscattered electron) of a Ti−15Mo alloy after aging at 873 K for 36 ks, b Ti−15Mo−1Fe alloy after aging at 823 K for 36 ks and c Ti−15Mo−3Al alloy after aging at 923 K for 36 ks
The difference in the aging temperatures of the selected alloys is due to the different β phase stabilities, as shown in Table 2. Note that the β transus temperatures were calculated on the basis of the equation for the relationship between the β transus temperature and the chemical compositions in titanium alloys, as reported by Ouchi.22 The β transus temperature in the Ti−15Mo−1Fe alloy is lower than that in the Ti−15Mo alloy, while the one in the Ti−15Mo−3Al alloy is higher. Note that the temperatures of (Tβ−TA) are almost the same among the alloys, where Tβ and TA represent the β transus temperature and the aging temperature respectively. Thus, it is reasonable to obtain similar microstructures in three alloys despite aging at different temperatures.
β transus temperature, aging temperature, ratio of integrated intensity of peak to that of (110) β peak I α /I β and lattice parameters of α and β phases after solution treatment (ST) and aging for 36 ks (STA) in Ti−15Mo, Ti−15Mo−1Fe and Ti−15Mo−3Al alloys
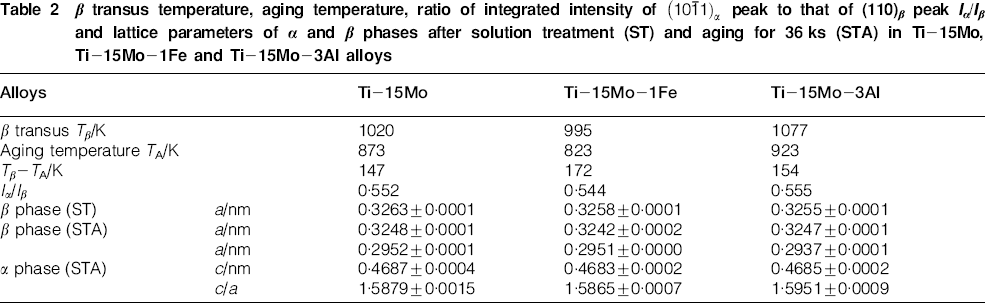
Figure 4 shows the XRD profiles of the alloys after aging. The presence of the α and β phases is detected for each alloy. The ratio of the integrated intensity of the  peak to the one of the (110)
β
peak was used to evaluate the volume fraction of the α phase qualitatively and calculated to be 0·552, 0·544 and 0·555 for the Ti−15Mo, Ti−15Mo−1Fe and Ti−15Mo−3Al alloys respectively, as shown in Table 2. This result implies that the alloys have the same volume fraction of the α phase after aging.
peak to the one of the (110)
β
peak was used to evaluate the volume fraction of the α phase qualitatively and calculated to be 0·552, 0·544 and 0·555 for the Ti−15Mo, Ti−15Mo−1Fe and Ti−15Mo−3Al alloys respectively, as shown in Table 2. This result implies that the alloys have the same volume fraction of the α phase after aging.
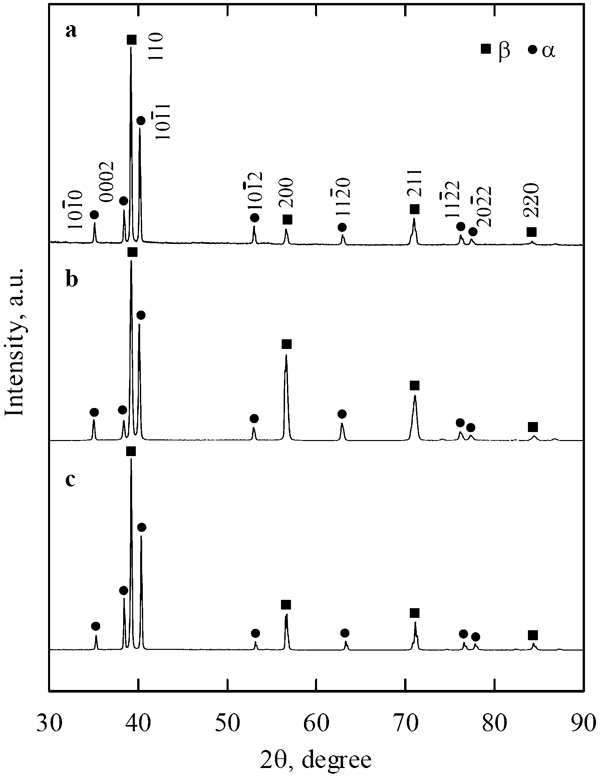
X-ray diffraction profiles of a Ti−15Mo, b Ti−15Mo−1Fe and c Ti−15Mo−3Al alloys after aging for 36 ks
Table 2 lists the lattice parameters of the α and β phases. The lattice parameter of the β phase decreases by Fe and Al addition in the Ti−15Mo alloy after solution treatment and decreases by the α phase precipitation for each alloy after aging. The a and c axes and c/a ratio of the α phase in the Ti−15Mo−1Fe alloy are almost the same as those in the Ti−15Mo alloy; however, the a axis decreases and the c/a ratio increases without any significant change in the c axis in the Ti−15Mo−3Al alloy.
Fe as a β phase stabiliser like Mo is strongly enriched in the β phase and depleted in the α phase with a very limited content. 23 23,24 The lattice parameters of the α phase in the Ti−15Mo−1Fe alloy are almost the same as those in pure titanium (a axis = 0·2950 nm, c axis = 0·4683 nm and c/a = 1·5870),23 indicating that both Fe and Mo are depleted in the α phase. The distributions of Fe and Mo in the α and β phases were confirmed further by SEM-EDS line analysis. As shown in Fig. 5a, Fe as well as Mo are enriched in the β phase and depleted in the α phase. On the other hand, Al as an α phase stabiliser is mainly enriched in the α phase 11 11,25 and can increase the c/a ratio by decreasing the a axis without causing much change in the c axis.11 The lattice parameters (Table 2) and the distributions of Al and Mo in the α and β phases, as shown in Fig. 5b, indicate that Al is enriched in the α phase and depleted in the β phase.
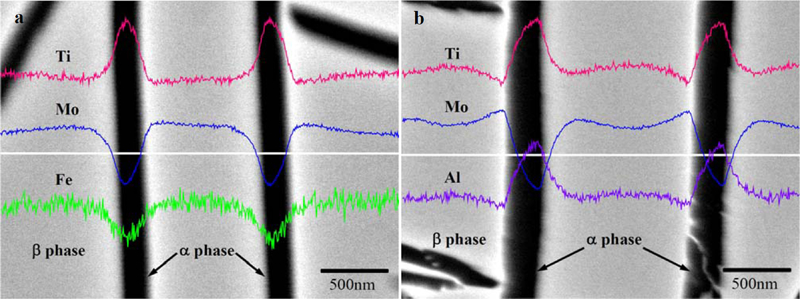
Elemental distribution by SEM-EDS line analysis in a Ti−15Mo−1Fe and b Ti−15Mo−3Al alloys after aging for 36 ks
Tensile strength
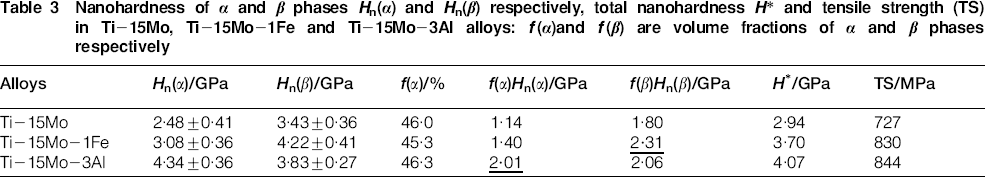
Figure 6 shows the nominal stress–strain curves of the alloys after aging. The Ti−15Mo−1Fe and Ti−15Mo−3Al alloys show similar stress–strain curves with higher tensile strength and smaller elongation than those of the Ti−15Mo alloy. Table 3 lists the tensile strength for each alloy. The tensile strength in the Ti−15Mo−1Fe and Ti−15Mo−3Al alloys is 830 and 844 MPa respectively and is 103 and 117 MPa higher than that of the Ti−15Mo alloy.
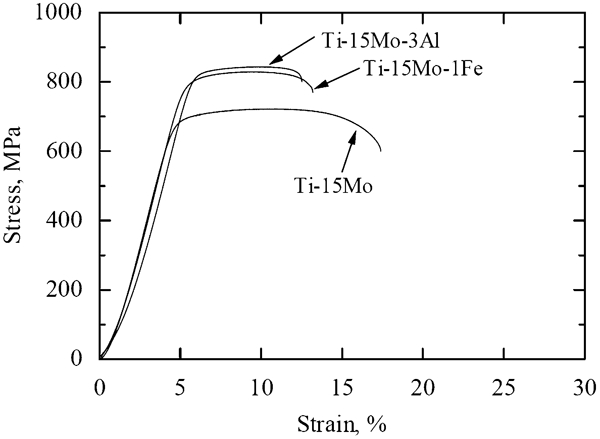
Nominal stress–strain curves of Ti−15Mo−1Fe and Ti−15Mo−3Al alloys after aging for 36 ks along with that for Ti−15Mo alloy
Nanohardness of α and β phases Hn(α) and Hn(β) respectively, total nanohardness H* and tensile strength (TS) in Ti−15Mo, Ti−15Mo−1Fe and Ti−15Mo−3Al alloys: f(α)and f(β) are volume fractions of α and β phases respectively
Since three alloys after aging have a similar microstructure for the size, distribution and volume fraction of the α phase, as mentioned in the section on ‘Microstructure’, the effects of the precipitation/dispersion hardening and grain refinement strengthening on the tensile strength are thought to be almost the same. In the Ti−15Mo alloy, the present authors20 reported that the α phase is softer than the β phase, which is caused by the Mo depletion in the α phase and enrichment in the β phase. Thus, due to the different chemical distributions of Fe and Al in the α and β phases (Fig. 5), the increased tensile strength in the Ti−15Mo−1Fe and Ti−15Mo−3Al alloys may be explained by the rule of mixture with the strength of each α and β phase.
Nanohardness of α and β phases
Figure 7 shows the typical load–displacement curves of the α and β phases obtained by the nanoindentation tests in the Ti−15Mo−1Fe and Ti−15Mo−3Al alloys along with the Ti−15Mo alloy. The penetration depth of the α phase is deeper than that of the β phase in both Ti−15Mo (Fig. 7a) and the Ti−15Mo−1Fe alloys (Fig. 7b), and one of the α phases is shallower than that of the β phase in the Ti−15Mo−3Al alloy (Fig. 7c). These curves indicate that the α phase is softer than the β phase in the Ti−15Mo−1Fe alloy, while it is harder in the Ti−15Mo−3Al alloy. Since the penetration depth of the α phase at the peak load of 100 μN ranges from 15 to 30 nm, as shown in Fig. 7, the size of the corresponding plastic deformation zone is estimated to be about 150–300 nm in diameter on the basis of the hemispherical approximation.26 Figure 8 shows a typical scanning probe microscopy image after the nanoindentation tests in the Ti−15Mo−1Fe alloy. The sizes of the indents in the α phase are comparable or smaller than the length of the short axis of the α phase. Thus, the effect of the interphase boundary is thought to be small, and the measured nanohardness of the α phase is dominated by the strength of the α phase itself. Table 3 shows the nanohardness Hn of each α and β phase calculated from the load–displacement curves. The α phase is 1·14 GPa softer than the β phase in the Ti−15Mo−1Fe alloy, while the α phase is 0·51 GPa harder than the β phase in the Ti−15Mo−3Al alloy. As shown in Fig. 9, the α phases in the Ti−15Mo−1Fe and Ti−15Mo−3Al alloys are harder than that in the Ti−15Mo alloy, and the Ti−15Mo−3Al alloy shows the maximum nanohardness. On the other hand, the β phase in the Ti−15Mo−1Fe alloy is the hardest, and it is slightly harder in the Ti−15Mo−3Al alloy than in the Ti−15Mo alloy.
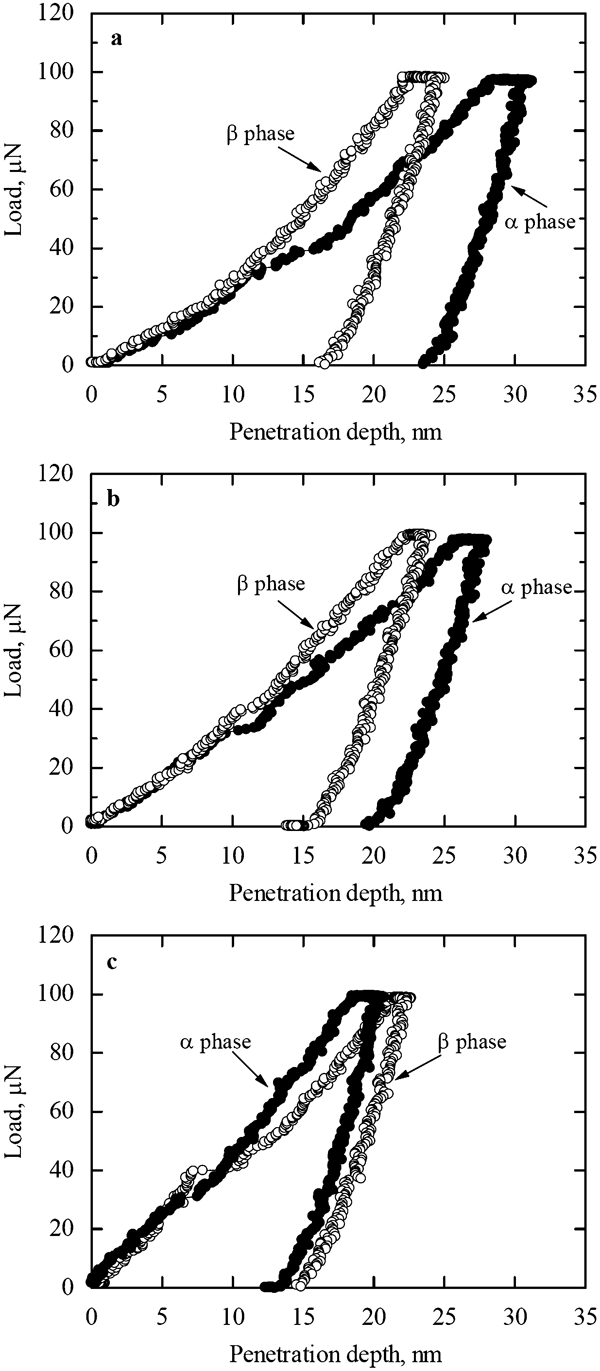
Typical load and penetration depth curves of α and β phases in a Ti−15Mo, b Ti−15Mo−1Fe and c Ti−15Mo−3Al alloys after aging for 36 ks
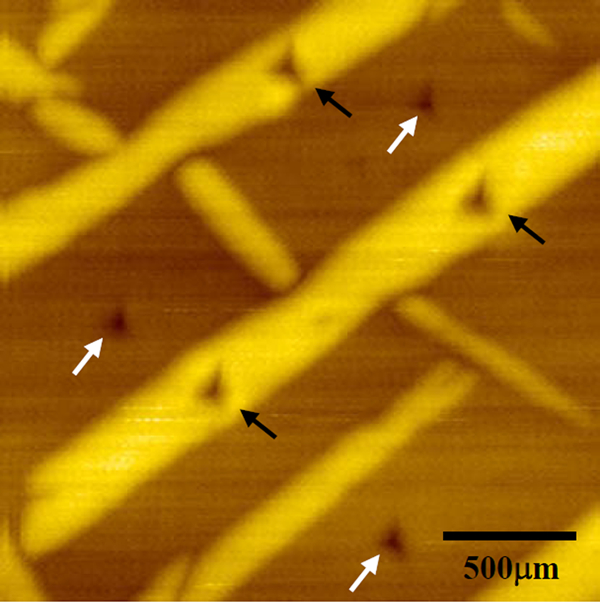
Scanning probe microscopy image after nanoindentation tests in Ti−15Mo−1Fe alloy after aging at 823 K for 36 ks: black and white arrows show locations of indents in α and β phases respectively
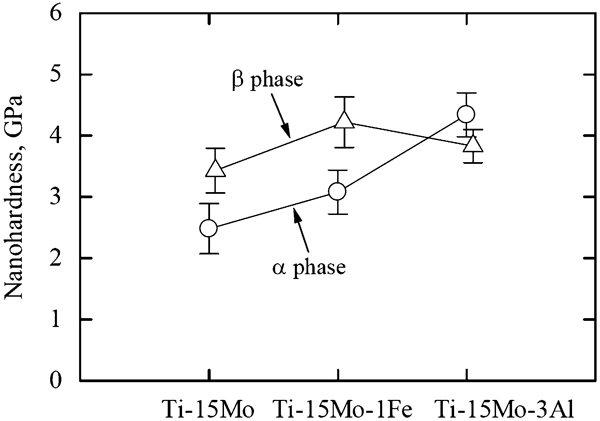
Changes in nanohardness of α and β phases in Ti−15Mo, Ti−15Mo−1Fe and Ti−15Mo−3Al alloys after aging for 36 ks
Based on these results, Fe enriched in the β phase can increase the strength of the β phase in the Ti−15Mo−1Fe alloy further, and Al enriched in the α phase leads to a significant increase in the strength of the α phase in the Ti−15Mo−3Al alloy due to the contribution of solid solution strengthening.
Next, the increased tensile strength in the Ti−15Mo−1Fe and Ti−15Mo−3Al alloys (Fig. 6) is discussed with the strength of each α and β phase. The total nanohardness on the basis of the rule of mixture can be described as

It can be concluded that the increased tensile strength in the Ti−15Mo−1Fe alloy is mainly caused by the strength of the Fe enriched β phase, while in the Ti−15Mo−3Al alloy, it is mainly caused by the strength of the Al enriched α phase.
Conclusions
The strengths of the α and β phases were evaluated quantitatively by the nanohardness in the Ti−15Mo−1Fe and Ti−15Mo−3Al alloys and compared to those of the Ti−15Mo alloy after aging at different temperatures, and the increased tensile strength was discussed with the strength of each α and β phase. The main results are summarised as follows.
The α phase with a similar size (a long axis of a few micrometres and a short axis of a few hundred nanometres), a uniform distribution and the same volume fraction is obtained in the alloys by adjusting the aging temperature.
Fe and Mo are enriched in the β phase and depleted in the α phase, while Al is enriched in the α phase and depleted in the β phase.
The α phase is softer than the β phase in the Ti−15Mo−1Fe, while it is harder in the Ti−15Mo−3Al alloy.
The increased tensile strength is mainly caused by the strength of the Fe enriched β phase in the Ti−15Mo−1Fe alloy and by the strength of Al enriched α phase in the Ti−15Mo−3Al alloy.