
Abstract
The additions of 0·022–0·025 mass- phosphorus and 0·010–0·012 mass- boron could enhance the creep properties and increase the service temperature of IN718 superalloy markedly. However, the as cast microstructure and solidification behaviour of modified IN718 with P and B additions are not completely recognised. In the present paper, differential scanning calorimeter (DSC) technique accompanied by scanning electron microscope and electron probe microanalysis characterisation is applied to understand the effects of P and B additions. It is found that P and B additions may promote the formation of big blocky Laves phase and result in the existence of B bearing phase enriched in Nb and Mo. In the meantime, another endothermic peak appearing before the Laves phase peak in the DSC heating curve is related to the melting of the B bearing phase. After the thermodynamics calculation, this new endothermic peak detected may be involved with the melting of M3B2. Furthermore, the endothermic peak appears before the Laves phase peak in the DSC heating curve, suggesting that the incipient melting temperature is greatly reduced as a result of P and B additions. In addition, both melting and solidification temperature ranges are significantly widened, indicating that the solidification process becomes more complex for the P and B doped IN718 superalloy.
Introduction
IN718 has been the most classical Ni base superalloy so far because of its excellent strength, good workability and best weldability. 1 1,2 For the previous application in gas turbine engines, the upper temperature limit of IN718 was 650°C.3 While higher gas efficiency and less carbon emissions have stimulated increased interests in the development of next generation superalloy used at higher temperatures. In recent decades, considerable efforts have been made to increase the temperature capability of IN718.3–8 It has been reported that the addition of 0·022–0·025 mass-P and 0·010–0·012 mass-B could enhance the creep properties and increase the service temperature by at least 30°C.5 However, such additions in IN718 will significantly influence the as cast microstructure and solidification behaviour due to the strong segregation tendency of P and B.
As powerful tools, thermal analysis techniques are always utilised successfully to characterise the solidification behaviour and identify the reaction temperatures during the solidification process, which includes differential scanning calorimeter (DSC) and differential thermal analysis.9–12 According to the interpretation of previous attempts, two types of secondary phases, i.e. MC carbide and Laves phase, are known to form in the solidification process of standard IN718 superalloy besides the γ matrix. 1 1,13 In addition, three reaction peaks associated with γ matrix, MC carbide and Laves phase respectively can be identified in the endothermic and exothermic curves.13 However, no further and detailed DSC study on IN718 with P and B additions has been reported.
In the present paper, we use the DSC technique to obtain the solidification information, intending to find the difference between standard IN718 and modified IN718 with P and B additions. Meanwhile, the DSC results are deeply analysed and verified by thermodynamics calculation, scanning electron microscope (SEM) and electron probe microanalysis (EPMA).
Experimental
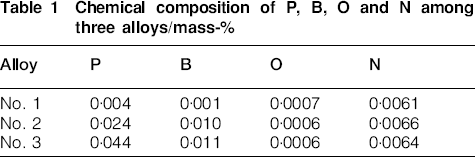
The studied materials are prepared according to the sequence shown in Fig. 1. First, the master IN718 was obtained by vacuum induction melting furnace. The composition of the master ingot is Fe–53·0Ni–19·5Cr–5·35Nb–3·10Mo–1·00Ti–0·52Al–0·05C (mass-). Second, the scale jacket of the master ingot was removed. Third, the master ingot was remelted in vacuum induction melting furnace to make three 10 kg ingots that were doped in different levels of P and B. Table 1 shows the chemical compositional results determined by inductively coupled plasma and LECO O and N equipment. According to the analysis results, the no. 1 alloy contained 0·004 mass-P and 0·001 mass-B, which represents standard IN718, while 0·024 mass-P and 0·010 mass-B are doped in the no. 2 alloy, which is in accordance with the optimum range of modified IN718. In addition, the P content of the no. 3 alloy is a bit higher than the no. 2 alloy, and the B content of the no. 3 alloy is basically the same as the no. 2 alloy. The contents of O and N exhibit no difference among the above three alloys.
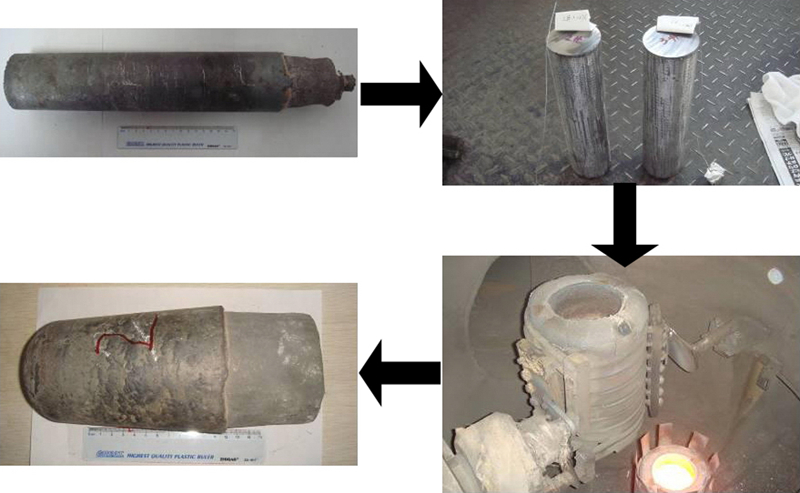
Preparation process of three alloys used in present study
Chemical composition of P, B, O and N among three alloys/mass-
All three alloys were investigated in detail by microstructures analysis on cut samples from the longitudinal centre of each ingot. After standard metallographic procedures, the samples were electrolytic etched with a solution of 10 mL HCl, 30 mL HNO3 and 50 mL C3H8O3 at 6 V for 10 s. A Leica DM6000M optical microscope and a Zeiss Ultra 55 SEM were applied to reveal the microstructures. The element distributions were examined by a Shimadzu 1720 series EPMA and a JEOL JXA-8500F thermal field emission EPMA.
The DSC test was carried out on a NETZSCH STA 449C instrument using a round column sample cut from the longitudinal centre of each ingot. The maximum heating temperature is set as 1400°C, and the heating/cooling rate was controlled at 10°C min−1. The reaction temperatures during heating and melting were then identified from the DSC curve by NETZSCH Proteus Analysis software.
It has been reported that lots of critical thermophysical properties could be predicted by Java based material properties (JMatPro) for most Ni and NiFe based superalloys. 14 14,15 Hence, JMatPro v5·0 developed by Sente Software Ltd. was used to calculate the variation in specific heat value during solidification process among three alloys.
Results and discussion
As cast microstructure and segregation behaviour
Figure 2 shows the microstructures from the longitudinal centre of each ingot obtained by optical microscope. It can be seen that for the given range of P and B content in the present study, P and B did not appear to have noticeable effects on the microstructure at an optic metallographic level. Clear dendrite structures of three alloys demonstrate that severe segregation happens during solidification process, where white areas are dendrite cores and black areas are interdendritic regions. In view of the calculated results by JMatPro, as shown in Fig. 3, Nb and Mo exhibit strong segregation behaviour in IN718 superalloy. With the proceeding of solidification, Nb and Mo contents in the residual liquid are increasing dramatically. However, Ni, Cr and Fe tend to be depleted in the residual liquid. It is also demonstrated that B is gradually enriched in the residual liquid and will have great impact on the last stage solidification process. Owing to the limit of JMatPro software, no information of P is available in the calculation results. However, a lot of experimental references have suggested that P is also enriched in the residual liquid like B. 16 16,17
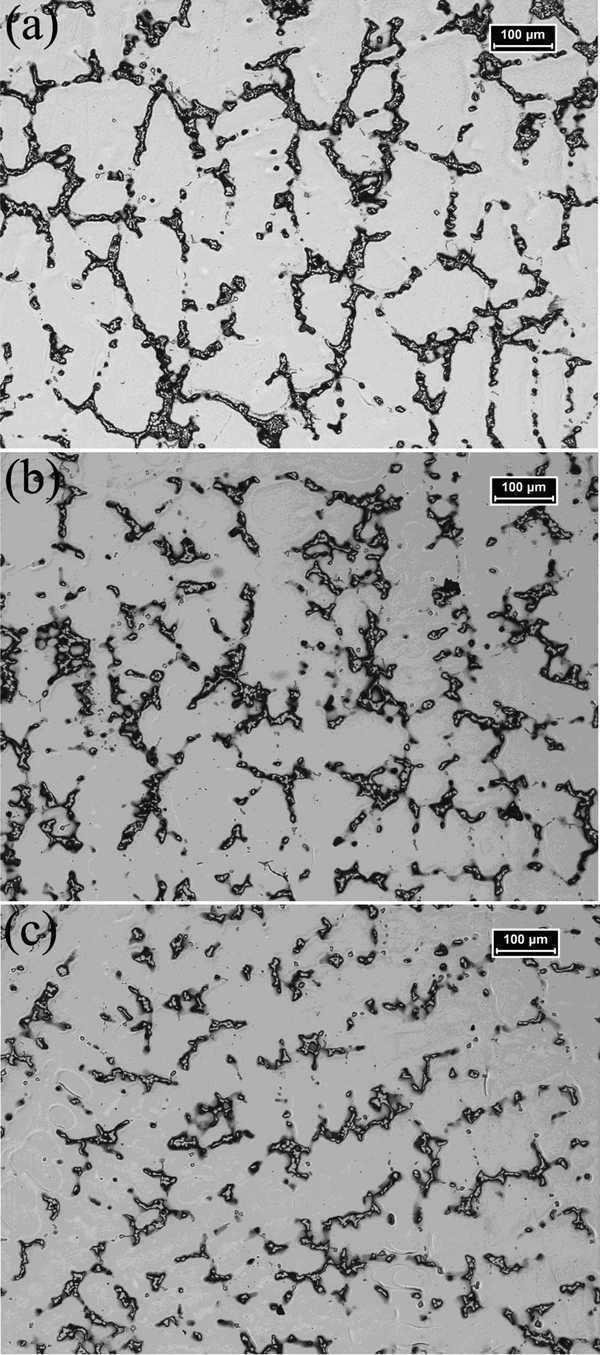
Dendrite microstructures from longitudinal centre of each ingot
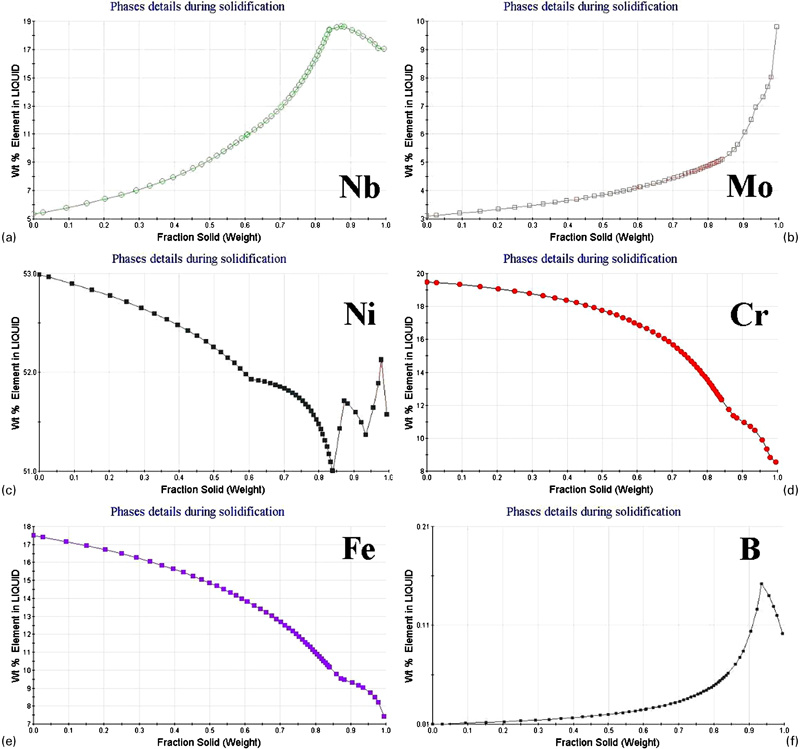
Element contents in residual liquid during solidification process calculated by JMatPro
In order to test the segregation behaviour calculated by JMatPro, element distribution mapping is carried out using EPMA, and the results of which are shown in Fig. 4. Figure 4a shows the backscattered electron image of the interdendritic region in no. 1 alloy. Obviously, Nb and Mo are enriched in the Laves phase that precipitates at the last stage of the solidification process, which is in accordance with the calculated results. In comparison, Ni, Cr and Fe are enriched in dendrite cores that solidify before carbide and Lave phases.
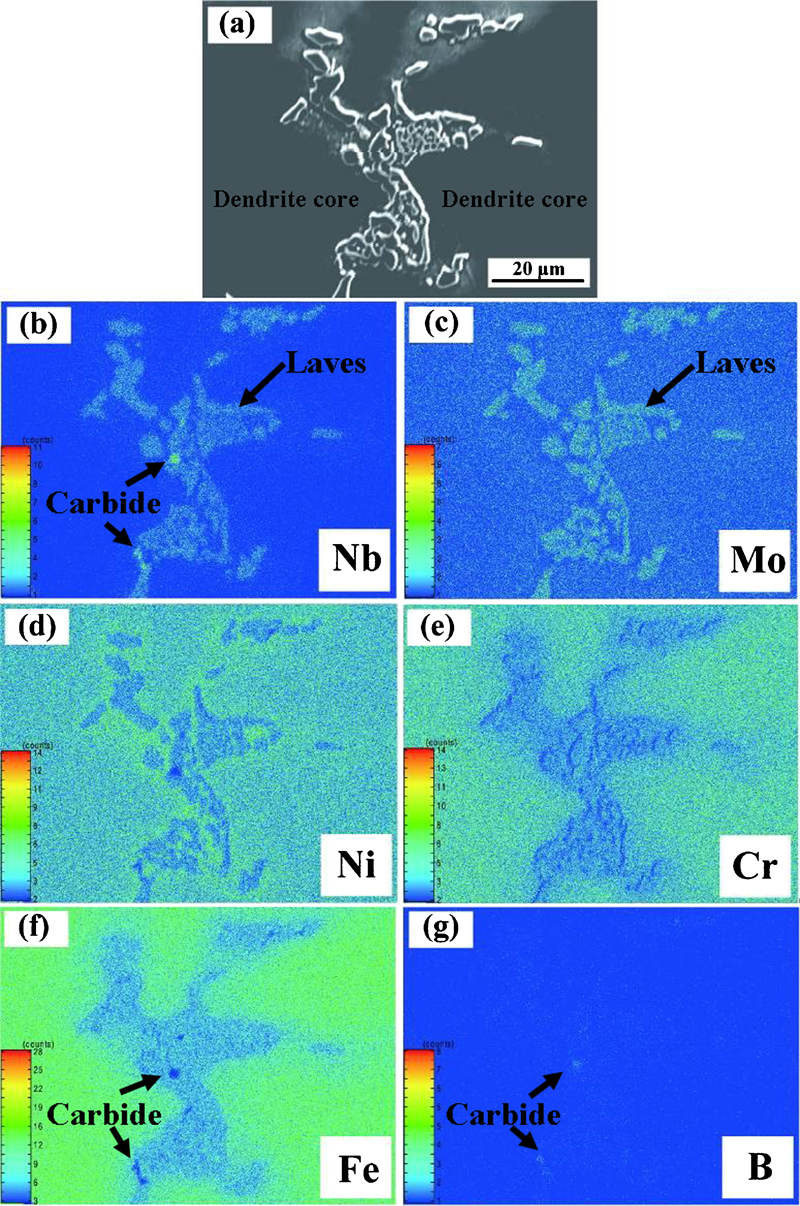
Element distribution in interdendritic region of no. 1 alloy
Carbide is identified according to the characteristic of extremely high Nb shown in Fig. 4b. From the B mapping result, it can be observed that a little B is contained in carbide. In light of the similar atom size between C and B, B can reasonably replace C in the carbide formation process. However, the EPMA result shows that there is no sign of B enrichment in the interdendritic region for the no. 1 alloy, which is not in agreement with the JMatPro result. From compositional points of view, only 0·001 mass-B is microalloyed in the no. 1 alloy, indicating that no obvious segregation of B would happen in the residual liquid. In contrast, ∼0·010 mass-B is doped in the no. 2 and 3 alloys, which is 10 times as much as that in the no. 1 alloy. Therefore, the effect of B cannot be ignored in the no. 2 and 3 alloys.
Figure 5 presents the SEM images of the interdendritic region in three alloys. In the no. 1 alloy, two kinds of morphology are observed regarding the Laves phase: the eutectic Laves and the blocky Laves. However, only blocky Laves phase exists in the no. 2 and 3 alloys. In addition, the size of the Laves phase is obviously bigger than that in the no. 1 alloy, which suggests that P and B additions may promote the formation of big blocky Laves phase. At the same time, some needle phases can be seen in the vicinity of the Lave phase for the no. 2 and 3 alloys, while there is no such precipitate for the no. 1 alloy.
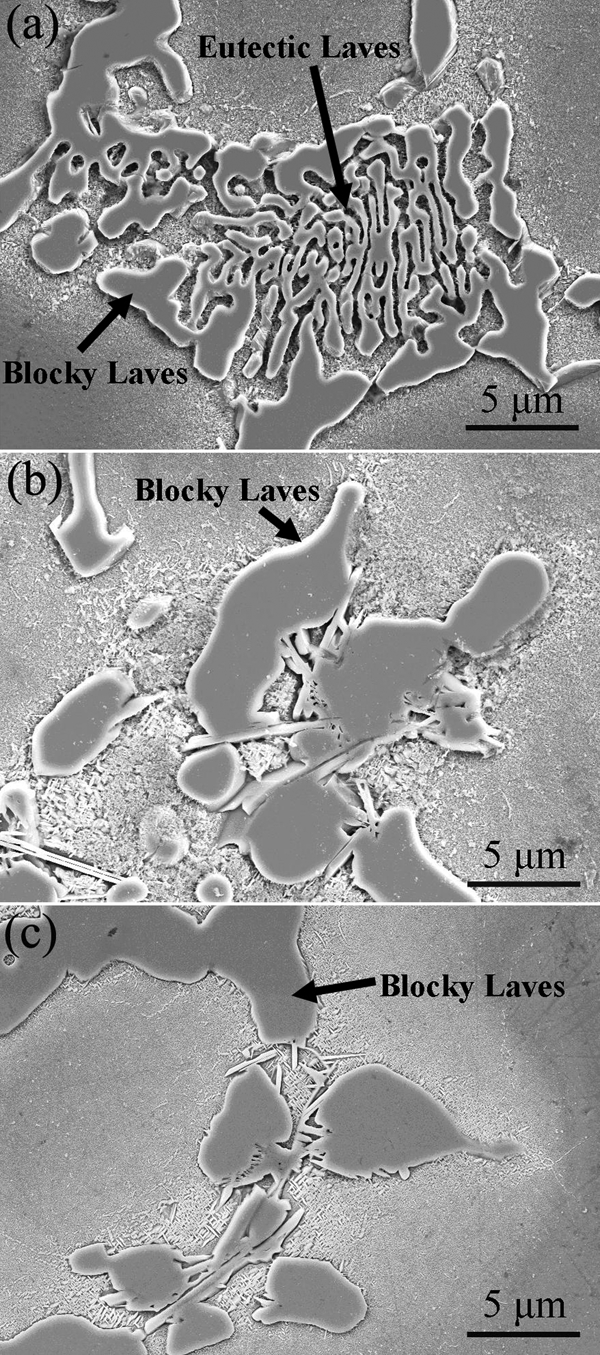
Images (SEM) of interdendritic region at high magnification
The detailed microstructure of the no. 2 alloy was investigated by field emission EPMA, as shown in Fig. 6. According to the morphology, 18 18,19 plate-like δ phase and very fine γ″ precipitates are identified in Fig. 6a. Apart from that, one ‘L’ shape phase situates in the middle of the Laves phase. From the element distribution analysis (see Fig. 6b), this ‘L’ shape phase is enriched in Nb, Mo and B. In contrast, the contents of Nb and Mo in B bearing phase are a little higher than those in the Laves phase. As estimated, the appearance of B bearing phase is the result of severe B segregation in the last stage solidification process. It is also noted that P is segregated in the Laves phase, which confirms that P is prone to enriching into the residual liquid. Dong et al.20 suggest that attractive interactions exist between metal and non-metal elements. Therefore, co-segregation of Nb–P, Mo–P, Nb–B and Mo–B may occur in the residual liquid during solidification, resulting in the formation of blocky Laves phase and needle-like B bearing phase in the no. 2 and 3 alloys.
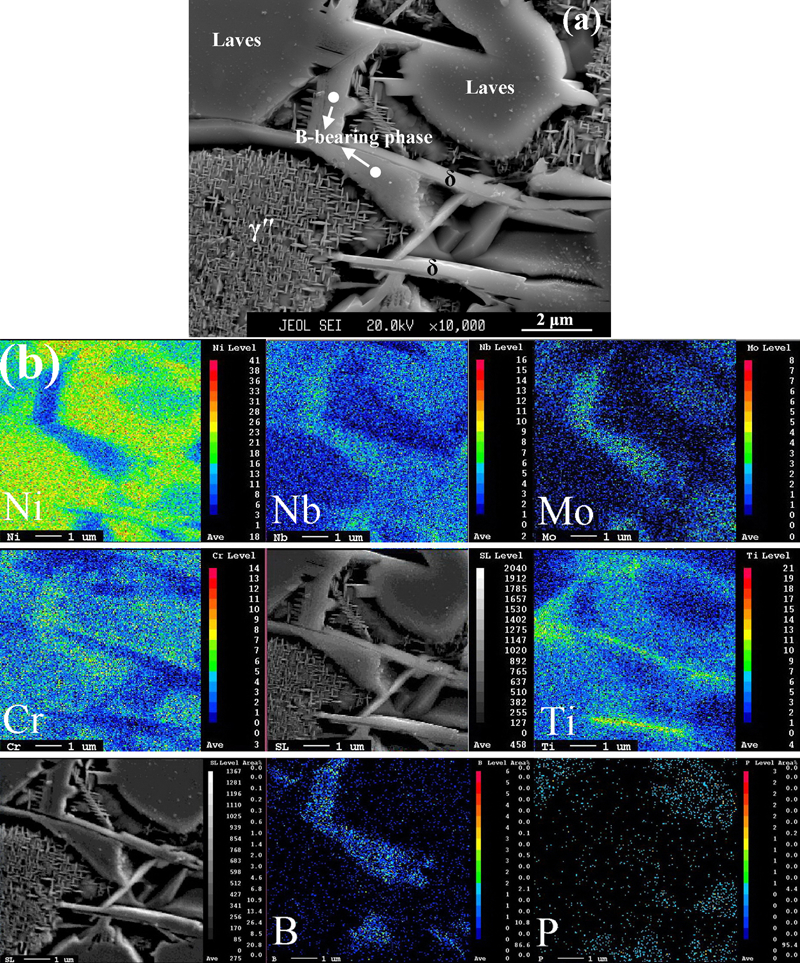
Element distribution in interdendritic region of no. 2 alloy
Differential scanning calorimeter curves and JMatPro calculations
The DSC heating and cooling curves are shown in Figs. 7 and 8, which are analysed on the basis of the above microstructure characterisation results. During the heating process, three endothermic peaks are observed for the no. 1 alloy, which are labelled as P-H2, P-H3 and P-H4 respectively. In reference with previous interpretation results, 13 13,19 P-H2 peak stands for the melting of the Laves phase. Afterwards, the melting of carbide and γ matrix is associated with the subsequent P-H3 and P-H4 peak, while it is apparent from the heating curve that four peaks exist for the no. 2 and 3 alloys. As expected, the P-H1 peak is connected with the B bearing phase.
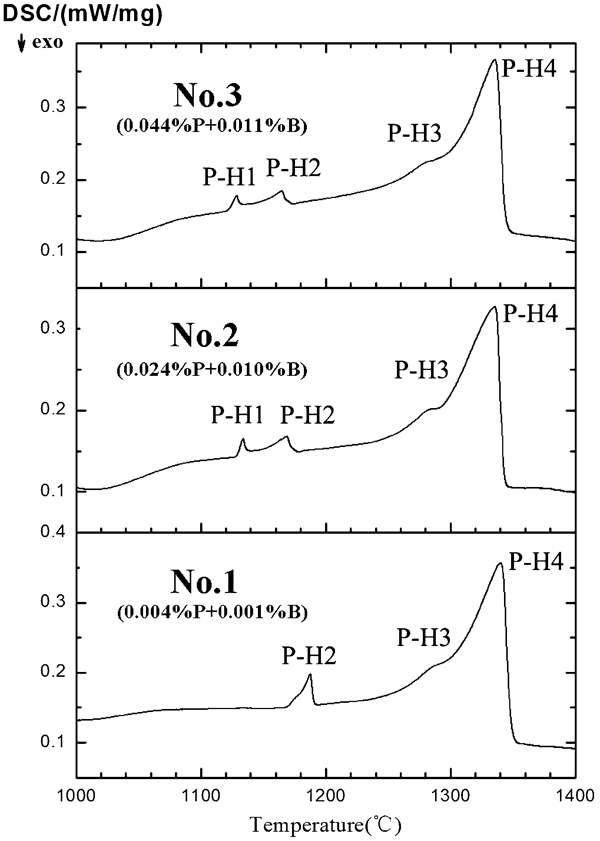
Heating curves (DSC) of three alloys
Cooling curves (DSC) of three alloys
In the meantime, the JMatPro software is used to calculate the variation in specific heat for the IN718 superalloy. We design three alloys containing different levels of B, with all the other elements equal. The calculated results (Fig. 9) of 0B alloy show that γ matrix, carbide and Laves phase peak are in perfect match with the DSC heating curve. Apart from that, δ phase and σ phase peaks are detected. Actually, although the δ phase exists in the as cast microstructure, no endothermic peak has been reported.19 In addition, σ phase is reported to exist in other superalloy21 but not in IN718. With increasing B content, M3B2 peaks are noticed in both 0·005B and 0·010B alloys. Accordingly, the ϵ phase is eliminated with the same reason because no reference supports the existence of ϵ phase in IN718. To sum up, M3B2 is the most possible phase precipitate after Laves phase, which results in the presence of P-H1 peak in the DSC heating curve.
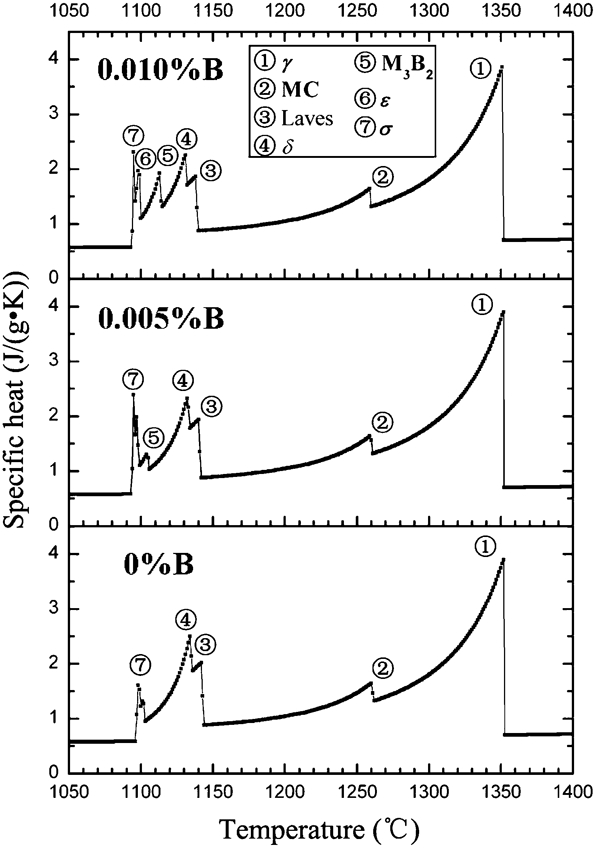
Specific heat calculated by JMatPro
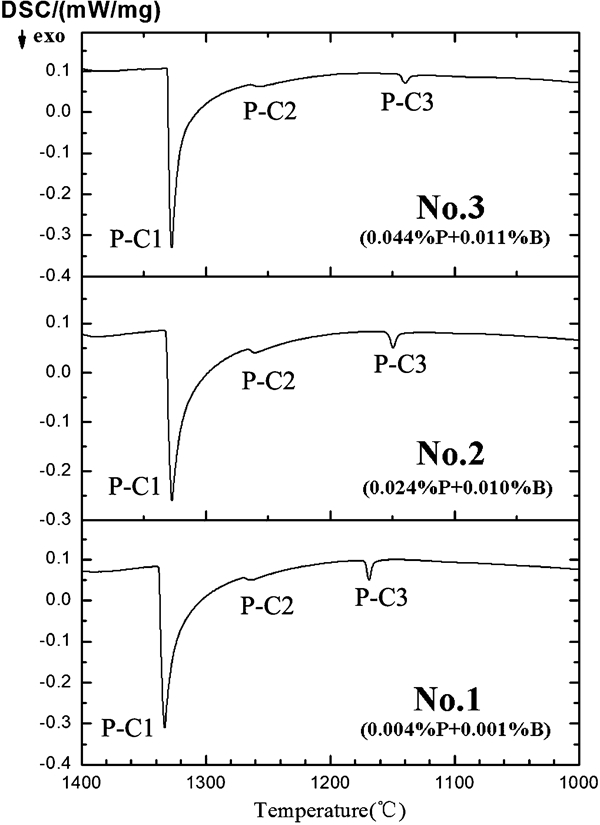
As the opposite process of melting, the solidification process characterised by the DSC cooling curve also demonstrates the same pattern, as shown in Fig. 8. All three alloys exhibit three exothermic peaks, which are labelled as P-C1, P-C2 and P-C3 respectively. The correspondent reactions referring to P-C1, P-C2 and P-C3 peaks are L→γ, L→MC and L→Laves. The phenomenon of no existing B bearing phase peak in the cooling curves of the no. 2 and 3 alloys may be explained by the sample status. As we know, the DSC heating curve is the result of as cast sample melting. Naturally, the B bearing phase peak appears since the B bearing phase exists in the as cast microstructure. However, the DSC cooling curve is derived at a cooling rate of 10°C min−1. It is probable that the B bearing phase would not precipitate at such high cooling rate because of the low segregation tendency in the small sample.
Solidification behaviour analysis
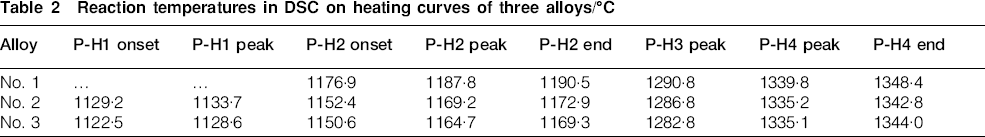
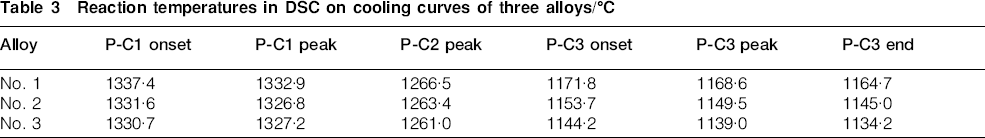
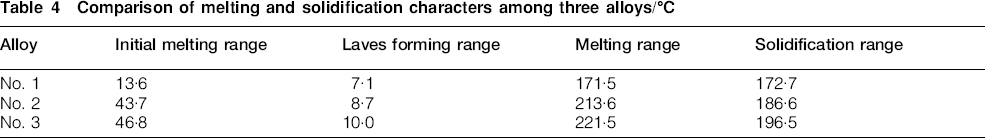
The reaction temperatures in the DSC heating curves (shown in Table 2) are determined by three types: onset temperature, peak temperature and end temperature respectively. The incipient melting temperature for the no. 1 alloy is observed at 1176·9°C, while for the no. 2 alloy, it is 1129·2°C in the presence of the B bearing phase. As for the no. 3 alloy, with increasing P content, the incipient melting temperature is a bit lower than that of the no. 2 alloy. In addition to the incipient melting temperature, the melting temperatures of carbide and γ matrix for the no. 2 alloy are both lower than those for the no. 1 alloy. Table 3 lists the reaction temperatures in DSC cooling curves. It is also shown that the existence of P and B in the residual liquid strongly postpones the solidification temperatures. Specifically, the onset temperature of Laves phase precipitation for the no. 2 alloy is reduced by 18°C compared to the no. 1 alloy. While the 0·044 mass- content of P doping in the no. 3 alloy will lead to lower solidification temperatures. Table 4 summarises the melting and solidification characteristics according to the DSC heating and cooling curves of three alloys. With the additions of P and B in combination, the initial melting temperature range is obviously widened as well as the Lave forming temperature range. As expected, both melting and solidification temperature ranges are significantly widened, indicating that the solidification process becomes more complex with the additions of P and B.
Reaction temperatures in DSC on heating curves of three alloys/°C
Reaction temperatures in DSC on cooling curves of three alloys/°C
Comparison of melting and solidification characters among three alloys/°C
Conclusions
The as cast microstructure of IN718 superalloy appears to be more complex with the additions of P and B. It is found that P and B additions may promote the formation of big blocky Laves phase and result in the existence of B bearing phase enriched in Nb and Mo. The DSC technique offers an effective approach to confirm the microstructure observation and help to understand the effects of P and B additions. Another endothermic peak appears before the Laves phase peak in the DSC heating curve, suggesting that the incipient melting temperature is greatly reduced as a result of P and B additions. According to the calculation results by JMatPro, the new endothermic peak detected may be involved with the melting of M3B2. Moreover, after identifying the DSC reaction temperatures in heating and cooling curves, it is possible to conclude that both melting and solidification temperature ranges are significantly widened owing to P and B additions.
Footnotes
Acknowledgements
This project was supported by the Major Program for the Fundamental Research of the Shanghai Committee of Science and Technology, China (grant no. 08dj1400402). One of the authors (Z. J. Miao) would like to thank Dr W. R. Sun and Dr L. X. Yu from the Institute of Metal Research, Chinese Academy of Sciences, for alloy preparation and useful discussions.