
Abstract
In this paper, both direct and indirect extrusions are simulated using a viscoplastic constitutive model. The simulated velocity fields for both direct and indirect extrusions are discussed and compared with experimental results. Advanced numerical techniques are used to trace backward and forward discrete particles of the billet. The effect of friction on the material flow is discussed. Back-end defects are simulated and practical methodologies are derived to minimise such defects using finite element modelling (FEM). Peak loads, temperatures and strain rate distribution are also compared between direct and indirect extrusions. Numerical subroutines have been developed and integrated into the FEM software in order to introduce the possibility of prediction of microstructural evolution. The results of such numerical simulations to increase productivity within the extrusion industry are currently limited only by the lack of sufficient physical metallurgical detail and by obstacles preventing the FEM simulation to be directly applied. This aspect is discussed in some detail.
Introduction
Although extrusion is a modern process (rolling and forging being much older) it precedes the development of aluminium which was only commercially available following the invention in 1886 independently by Hall working in the USA and by Heroult in France, of the electrolytic process to extract the metal from bauxite. The conventional extrusion process is complex but it is the most efficient process to transform a cast and homogenised billet into an intricate profile. Currently the design of extrusion dies and operation of the extrusion press is based on a process of educated trial and error. Understanding the way in which the material flows during the hot extrusion of aluminium alloys is therefore essential if the process is to be intelligently controlled. Material flow is greatly affected by the friction between the tool and billet interface. Among the industrial methods by which aluminium billets can be transformed to exceedingly complex shapes, extrusion has no rival and has firmly established itself as a major industrial process as shown by Sheppard.1 It has been noted that almost since the inception of the extrusion process there have been two modes of operation: direct and indirect extrusions. Sheppard and Paterson2 provided a detailed study which highlighted considerable differences between the two modes: in the indirect case the friction at the container billet interface was close to zero, whilst at the die face the friction coefficient was about 0·45. The reader should realise that small amounts of graphite are applied at the die face and at the die land and the tool/ram interface to promote removal of the extrudate and discard etc. This additive will also lower the friction acting in the process. Chadwick3 and Tuschy4 have pointed out that the major difference is that in the indirect mode there is no friction between the billet and container whereas in the direct mode the outer shell of the billet is assumed to move relative to the container as the extrusion proceeds and the friction coefficient at the container/billet varies between 0·8 and 0·95. Thus in direct extrusion the surface of the billet is sheared at, or slides along, the container wall. In every case, part of the extrusion load, depending on the length of the billet, is expended in overcoming the friction between the billet and container, or in shearing the inner material from the slower-moving peripheral layer adjacent to the container wall. As one would expect, this results in considerable variation in flow behaviour which is discussed in this paper. Metal flow in the extrusion process is an important factor controlling the mechanical properties of the extruded products. Sheppard and Wood,5 Clode and Sheppard6 and Valberg and Malvik7 have shown the importance of material flow of aluminium alloys during extrusion. Valberg8 has written an excellent review concerning visioplasticity methods. In these studies, the techniques range from commonly used techniques such as gridded billets (introducing pins of an aluminium alloy into the as cast billet and then grinding and etching the surface after the end of the extrusion) to marking grids within the initial billet. These techniques did achieve practical results describing metal flow but, because of the experimental limitations, could only be directed to meso rather than macro features. For a more comprehensive understanding of the extrusion process, numerical simulation with finite element modelling (FEM) is now a powerful tool. At present, many researches show that with some commercial FEM codes, metal flow and other variables (such as temperature, pressure, strain, evolution of microstructure) could be well predicted. For instance, Jo et al.9 employed Deform 3D to investigate the metal flow during the extrusion of AA7003 aluminium alloy with the influencing factors of billet temperature, extrusion load and surface quality. Flitta and Sheppard 10 10,11 have used Forge to predict the required extrusion load, extrudate temperature and metal flow. Using Forge2, Duan and Sheppard12 and Flitta et al.13 also successfully predicted extrusion load, temperature, pressure, the evolution of the volume fraction recrystallised (XV), subgrain size and internal dislocation density of the extrudate.
An advanced technique termed ‘prior-sensors’, was developed and user activated to show the source of the back-end defects and also practical ways to minimise undesired features, i.e. dead metal zone (DMZ). A subroutine was coded and integrated into the FEM to simulate the change of the temperature compensated strain rate (Z) during extrusion. The simulation results agree well with Subramaniyan's14 experimental data. Throughout this document we shall use both micrographs and data in tabular form: all of which were produced at Imperial College London. Extrusion was also undertaken at Imperial College using a 5MN vertical extrusion press. Sheppard et al.15 have reported the details of the experiments.
Simulation and experimental details
Finite element modelling formulation
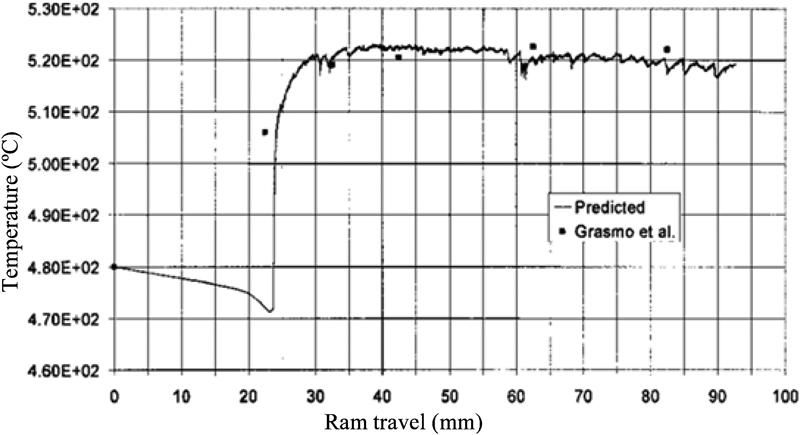
Finite element modelling simulation is used in the present study. Forge is an implicit and fully thermomechanically coupled FEM software with automatic meshing and remeshing capabilities. Material flow is based on Lagrangian descriptions. For hot extrusion, the elasticity effect can be ignored and hence the most economical constitutive laws are purely viscoplastic approximations. The Zener-Hollomon parameter Z is used to describe the flow stress
 is the mean equivalent strain rate and in practical terms is governed by the extrusion ram speed whilst ΔH is the activation energy for the material and is a function of alloy content, dispersoid and precipitate distribution. G is the universal gas constant and T is the temperature of the billet at the relevant location. The flow stress may then be written as follows where A, α and n are constants specific to each alloy
Material and FE model
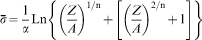
The aluminium alloy AA2024 was selected as the material for all direct and indirect simulations. The alloy composition is given in Table 1. For the aluminium alloy AA2024, values for the equation (2) are as follows: ΔH = 148880 J mol−1, A = 3·252×108, α = 0·016, n = 4·27 (Sheppard and Jackson16). This alloy was selected as being the only material for which the necessary extrusion results were available (certain compromises were still necessary).
Chemical composition of AA2024 alloy, wt-
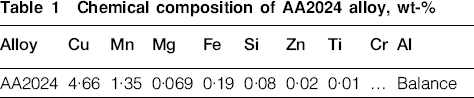
In direct extrusion, the ram pushes the billet towards the die orifice to obtain the desired shape and properties. The container and die are fixed in this case (Fig. 1). For indirect extrusion in an industrial environment the container and ram are fixed and the die moves towards the billet. However, for the purpose of these simulations the die was fixed and both the container and ram were allowed to move together towards the billet.
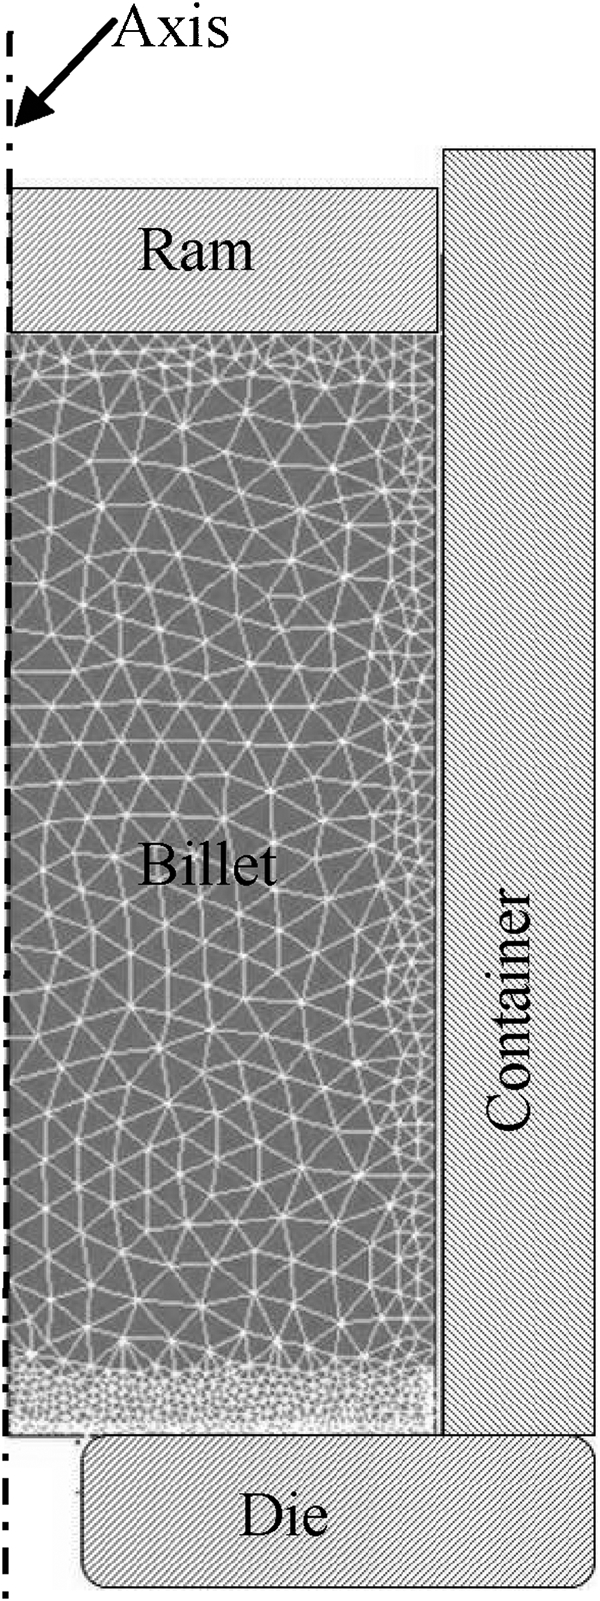
Typical mesh of billet for FEM simulation
To reduce the computer analysis time, ram, container and die are assumed to be rigid, which means there is no elastic deformation of the tools and a single temperature value is assigned to each component during thermomechanical coupled computation. The radius of the die entrance is 1 mm. The mesh size is a set value of 4 mm with a meshing option of ‘fine front’ value of 2 mm. This allows finer meshes near the surface of the billet or at the die corner (as shown in Fig. 1). Six-node triangle elements are adopted to discretise the billet. Each element side is described by a second order curve. The heat transfer coefficient between the billet and tools (die, ram and container) is set as 20 000 W m−1 K−1. The convective heat transfer coefficient is 10 W m−1 K−1. The emissivity is chosen as 0·05. The Tresca friction law is adopted in this study. Friction is the least understood factor during hot forming. Sheppard and Paterson made a thorough investigation concerning the friction coefficient and its value when attempting to model aluminium alloy extrusion under industrial conditions. Their experiments included the application of a graphite mix in small quantities to all interfaces relevant to the process which is normal under real conditions and is applied as a parting agent at the die face and the pressure pad. Their study showed that the friction coefficient was found to increase as flow stress decreased ( = 0·96 at 450°C, and = 0·75 at 300°C) and increase as the temperature increased ( = 0·92 at 450°C, and = 0·65 at 300°C) for both direct and indirect processes. It is clear that the addition of a parting agent is influential in determining the coefficient. Because of the difficulty of determining the exact value of the friction coefficient and its evolution during the extrusion cycle, the common measure for researchers is to assume it is a constant and frequently made equal to unity. In this study, constant coefficients were assumed. The friction factor will therefore not have a value of 1 as indicated by Yoneyama and Takahashi's experiment17 and other workers. The friction factor (0⩽m⩽1) at the die surface/billet interface is 0·4, 0·85 for the container/billet interface and 0·1 for the ram/billet interface.
Extrusion experiments
Experimental data were taken from Subramaniyan's experiments. Extrusion was performed on a 5 MN press operating with tooling set-up for direct and indirect extrusions. Both extrusion ratios were 40∶1, the ram speed was 5 and 3 mm s−1 for direct and indirect extrusions respectively. The initial billet temperature was 400°C and the temperature for tools was 350°C. The billets were 75 mm in diameter and 95 mm in length and were heated in an induction heater. Ideally the same speed should have been selected. However the speeds selected by Subramanyian were designed for his theoretical work and this was the nearest we could select for our conditions. This was considered for each result and the reader can readily recognise that a difference of as the structure is dependent primarily on the value of ln Z. Since 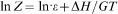 and the ratio of these two terms is 2/26 then a small difference in ram speed (strain rate) will not be consequential.
Results and discussion
Evolution of extrusion pressure and temperature
Figure 2 compares the extrusion pressure–ram displacement diagrams obtained from the direct and indirect FEM simulations. The load loci differ for the direct and indirect extrusions but follow a similar pattern. As expected the indirect mode exhibits a pressure which is always lower than that in the direct case with a maximum difference of 0·75 MN at the peak load, and the gap between them narrows from the peak until the end of the ‘steady state’ because the predicted indirect load increases slightly while the direct load has a considerable decrease. This is mainly caused by the different frictions and consequent temperature increase resulting from the differing extrusion modes. The difference is most pronounced during the period when the loads increase from zero to their peak values; the ‘steady state’ region being attained earlier in the indirect case. Most certainly this is because the dislocation density will be lower in the indirect case (temperature lower). One interesting point is that the pressure rise at the finish of the ram stroke commences at 82 mm for the direct case and is 87 mm in indirect extrusion. This indicates that the discard depth should be 13 mm for direct extrusion and 8 mm if we are able to use an indirect press. This represents a small but significant increase in productivity. The reason for this would appear to be obscure since the direct billet will contain an undeformed DMZ which is potentially softer than material in the indirect billet at a similar location. However, in direct extrusion the material will encounter greater friction along the die face than does the indirect billet.
Variation of load with ram displacement for two modes of extrusion
The predicted peak load 3·944 MN for the direct extrusion is exactly the same as the load obtained from experiment, 3·94 MN whilst the predicted peak load of the indirect extrusion exceeds the experimental measurement by ∼10. This is largely because of possible overestimation of the friction between the billet and tools but is more likely to be due to an underestimation of the heat transferred across the die face.
There is no experimental data to validate the simulated temperature distribution. However Flitta and Sheppard's18 work has proven that Forge can produce reliable temperature prediction. Below is a brief review of their study.
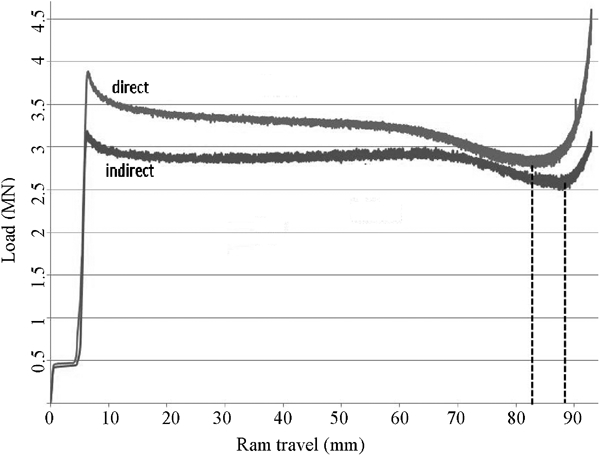
Grasmo et al.'s conducted experiments to determine temperature evolutions of ram, container and die during the extrusion of AA6060 alloy by inserting thermocouples to critical locations. Their results are shown in Fig. 3 in which their experimental and calculated values for thermocouples 7, 8, 9 and 14 are presented.
Temperature changes according to Grasmo et al.'s experiment19
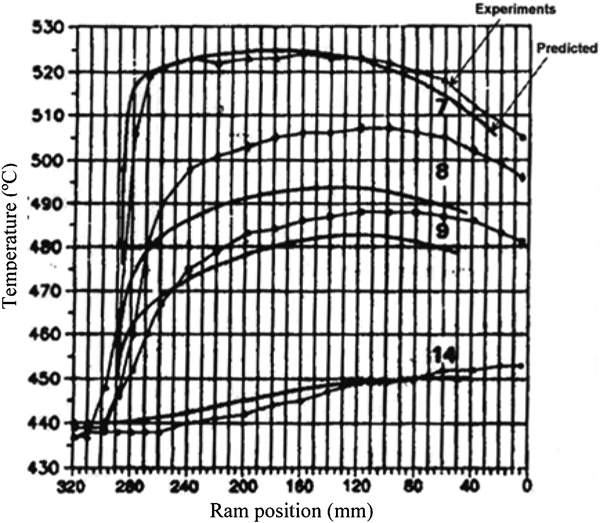
Measurements of the thermocouple 7 represent the extrudate's temperature evolution at the die entry. By comparing their predicted results at the thermocouple 7 with Grasmo et al.'s results, Flitta and Sheppard validated the predicted temperature readings from Forge, which are displayed in Fig. 4.
Forge predicted temperature versus Grasmo's measurements (Flitta and Sheppard18)
From both Figs. 3 and 4, it can be seen that during steady state the extrudate temperature distribution will nearly remain constant. Therefore, the predicted temperatures at the ram displacement of 65 mm for both extrusion modes were chosen to be displayed in Fig. 5. The results show that with the same initial temperature, billets both direct and indirect extrusions experience considerable temperature rises, and they have similar distribution patterns. It can be seen that the further the material is from the die exit, the lower is the temperature rise with the lowest temperatures appearing at the corner farthest from the die exit. However, the increase is greater and more acute for the case of direct extrusion. Although in both cases the temperature difference within the billet is ∼100°C, we can see that in direct extrusion, the cooler black area occupies nearly half of the billet butt and there exists a temperature difference between the internal and the outer part of the extrudate, while in the indirect mode the black area is less widespread in the billet butt and an extrudate with even temperature distribution is acquired. Since temperature is closely linked to the important structural parameters and their evolution we should observe that indirect extrusion achieves a more homogeneous temperature. Critically the final temperature of the extrudate appears to be determined by the die-entry radius. However, the lower final temperature in the indirect case will result in fewer propensities for damage to the surface of the extrudate and/or the possibility to utilise greater extrusion speeds. Each of these points may be relevant. The reduction in temperature could lead to some retained substructure in the heat treated condition: thus increasing strength, fracture toughness and corrosion resistance and the increased ram speed to additional productivity adding to that produced by the reduced discard length.
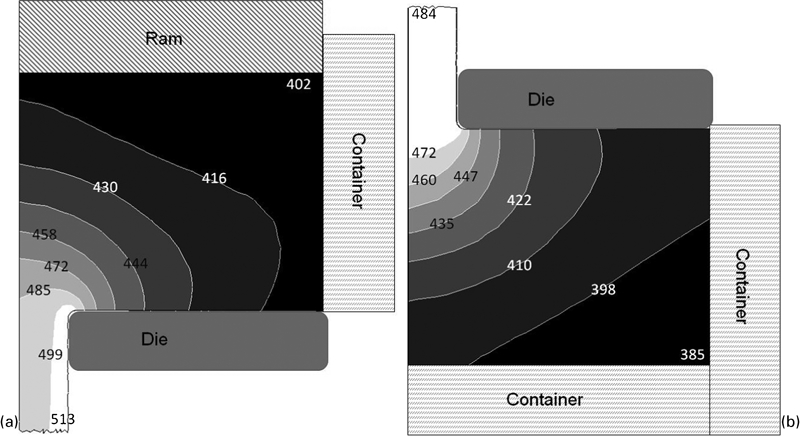
Temperature distribution for a direct and b indirect extrusions
Metal flow and surface formation
To clearly show the metal flow, a simulation technique termed the ‘prior-sensor’ method is used in this study. It is important that the reader realises that each sensor has a position but has zero size and volume and hence cannot in itself affect flow. Thus this study differs from those previously reported. The initial positions of the sensors are shown in Fig. 6 for both the direct and the indirect extrusions.
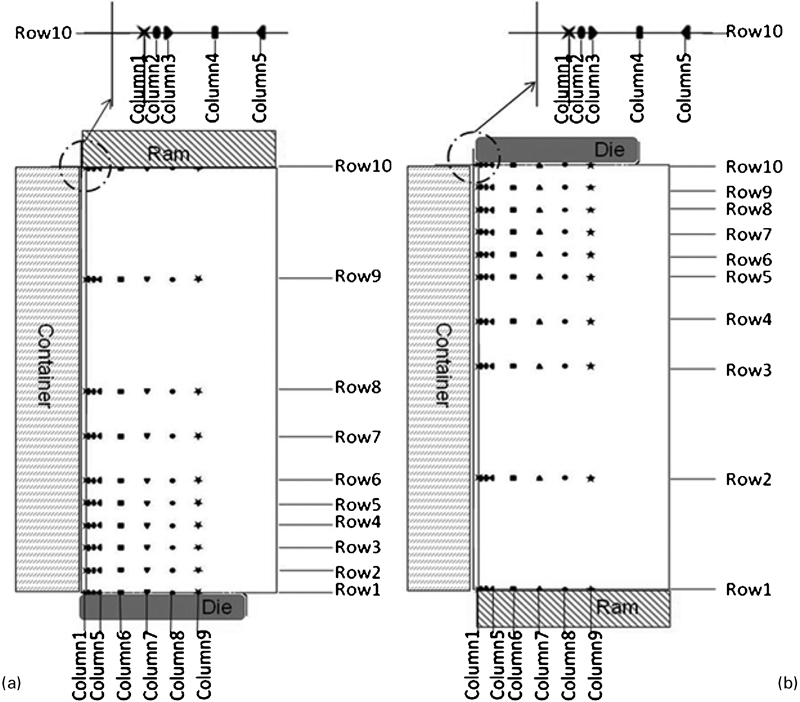
Sensors’ initial positions for a direct and b indirect extrusions
For convenience, they are denoted according to their position in row and column. For example, sensor (8,9) implies the sensor at the intersection of row 8 and column 9. Here for both cases distances of columns from the billet surfaces are: 0, 0·2, 0·5, 1·5, 2·5, 6·5, 11·5, 16·5 and 21·5 mm for columns 1–9 and distances of rows from the die face are: 0, 5, 10, 15, 20, 25, 35, 45, 70 and 95 mm for row 1–10 in direct extrusion, and with all the distances in a reverse order for row 1–9 in indirect extrusion.
Two frames are captured from the FEM simulation and presented in Fig. 7. Figure 7 demonstrates the material flow in the billet illustrated by the movement of the sensors at a ram displacement of 9 mm for direct extrusion and 8·5 mm for indirect extrusion. Figure 7a shows significant movement of the sensors in direct extrusion at a ram displacement of 9 mm. At this stage both sensors (2,9) and (3,9) have entered the extrudate but are not on the surface. Sensor (1,9) is moving along the die face and would reach the extrudate at a further stage. Little movement is observed for the sensors which are away from the die exit. In Fig. 7b, with 9·5 mm of ram displacement, quite similar movement is achieved for the sensors in the indirect extrusion billet. There are also two sensors which have moved into the extrudate. Of them, sensor (10,9) slips into the extrudate along the die face, representing part of the material that forms the extrudate surface, whilst sensor (9,9) is in the inner part of the extrudate. It is obvious that as the ram/or die progresses then, with the process of extrusion for both modes, more and more sensors will flow into the extrudate and by recording their position in the extrudate, we can get a better understanding of metal flow and the extrudate surface formation.
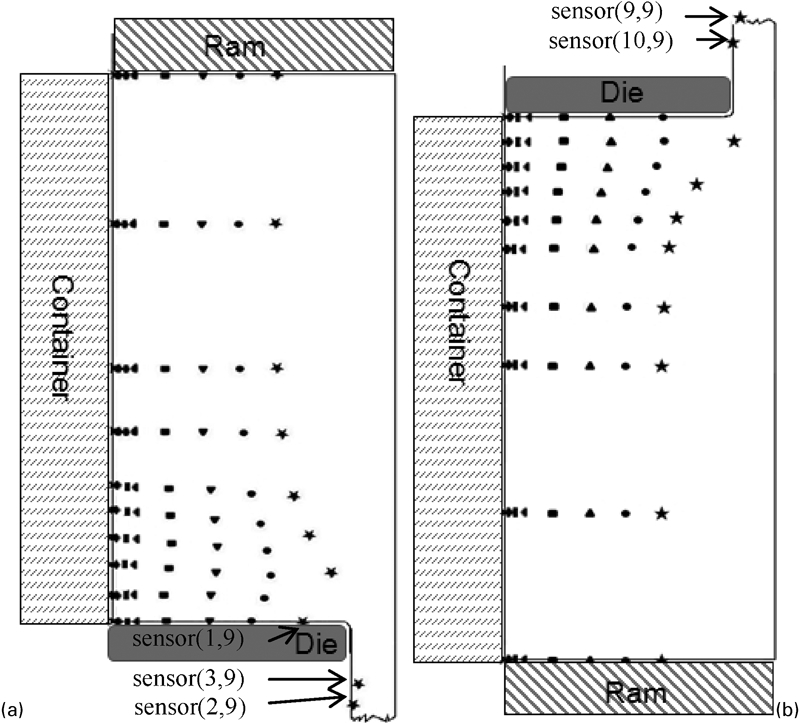
Positions of sensors a for direct extrusion at ram displacement 9 mm and b for indirect extrusion at ram displacement 9·5 mm
Figure 8 assists the reader to interpret the extrudate surface formation for direct and indirect extrusions by presenting the relation between distance from the extrudate surface and ram travel of each sensor that finally forms the extrudate. In the graph each curve represents the sensors on a specific column which finally moves into the extrudate. The direct extrusion curves in Fig. 8a show similar shapes, for each curve (column), the closer the sensors are to the die face, the nearer they would finally appear to the extrudate surface. However, each column exhibits a reverse change in curvature which would appear to occur at points around sensors on row 7 [sensor (7,4), sensor (7,5), sensor (7,6), sensor (7,7), sensor (7,8) and sensor (7,9)]. From this point the graph representing columns approaches the surface at a greater rate with increasing ram travel. However, this does not apply to column 5 in which sensor (9,5)'s position is further from the extrudate surface than sensor (7,5), rather than being closer if it were to follow a similar path to the other sensor loci described above. It seems abnormal if we further compare it with other sensors [sensor (9,6), sensor (9,7), sensor (9,8) and sensor(9,9)] with which sensor (9,5) is in the same row in the initial setup. The fact we can see from these four sensors is the closer the sensor is to the billet surface, the nearer it would finally appear to be to the extrudate surface (this trend even applies to other sensors in the same row). Actually it is evidence of the back-end effect during which surface material of the billet moves into the central part of the extrudate rather than the periphery at the final stage of extrusion. It appears that none of the sensors on columns 1, 2 and 3 are relocated to the extrudate during extrusion. Those closest to the container, appear to be relocated to the ram face or in the DMZ and hence will be found in the discard and will not appear in this figure. It is thus clear that for direct extrusion those defects which are located on the billet surface (and in general are not removed by machining) will not harm the quality required in the finished extrude since their eventual location will be in the discard. The initial positions of those sensors which formed the extrudate surfaces are marked in the two small insets figures for both cases using the black bold lines. For the direct mode, only sensors (1,9), (1,8), (1,7) and (2·6) fall on the extrudate surface. All others either travelled to the interior of the extrudate, or were deposited in the discard or remained in the DMZ (where, of course, they do not move). The bold line connecting these sensors in the inset figure of Fig. 8a can be regarded as the dividing line of the DMZ and the heavily deformed conic area in the direct extrusion. Reviewing both Figs. 7 and 8a leads to the conclusion that extrudate-surface-forming material comes from near the line connecting sensors (1,9), (1,8), (1,7) and (2·6) and between columns 6 and 1. The DMZ exists behind this line in the corner of the container.
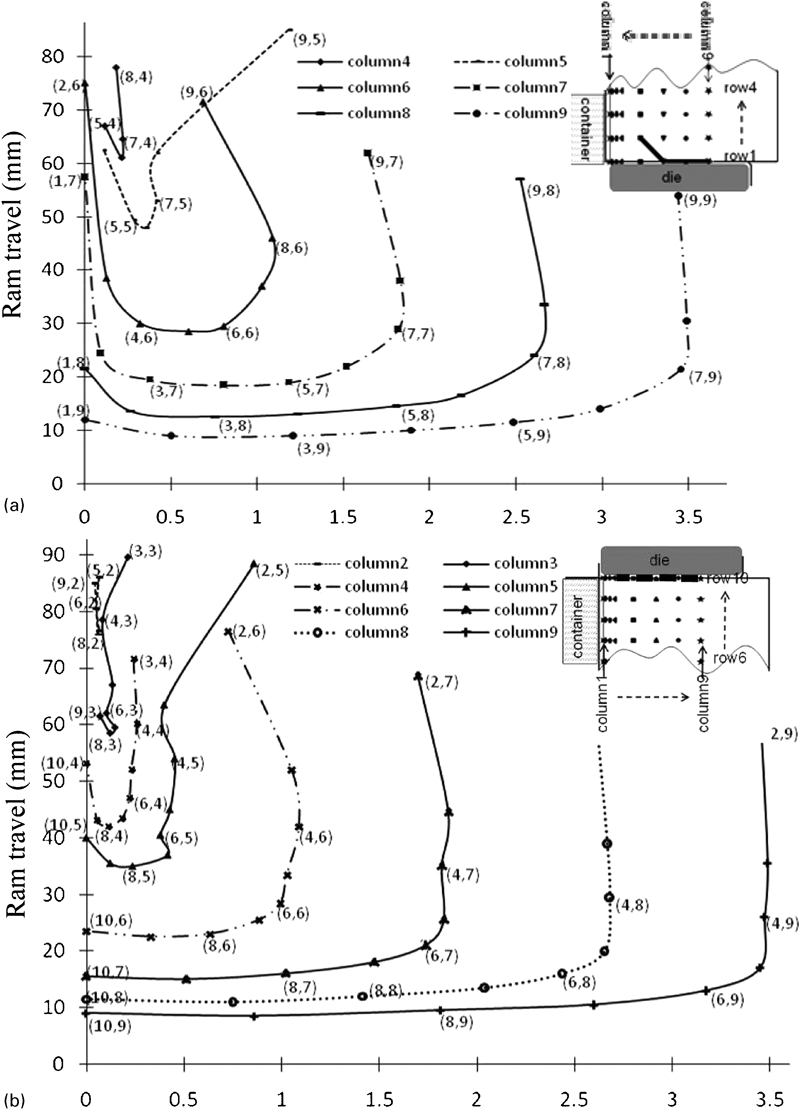
Relation between ram travel and sensor distance from extrudate surface
Overall, Fig. 8b has a similar shape with the Fig. 8a showing that for each curve there is a point at which the curvature reverses. It also is approximately close to sensors located on row 7 and the closer-to-billet-surface-the-closer-to-extrudate-surface observation applies as in direct extrusion except that in column 5 sensor (2,5)'s final position is further from the extrudate surface than those that are in the same row and is caused by that section which will become the back-end effect. It also shows that the surface of the extrudate will be formed mainly from the material located in the designation of row 10 (initial positions are marked in the inset figure), which are sensors (10,9), (10,8), (10,7), (10,6), (10,5) and (10,4). The figure indicates that in the early stage this material does not reach the surface of the billet which suggests that a DMZ may be very temporarily formed in the centre region of the die face as previously reported by Sheppard and Patterson but will certainly not be a permanent feature as in the direct case. A striking difference between direct and indirect extrusion is that nearly all of the sensors are relocated in this process even for those not appearing in the Fig. 8b, such as sensor (9,2) near the die/container corner, which suggests there is a larger deformation zone but there is not a DMZ as in direct extrusion. A larger deformation zone leads to a relatively homogeneous structure and this region has been reported as the cause of geometric dynamic recrystallisation and peripheral coarse grain by other investigators (Bandar et al.20). It would seem improbable that peripheral coarse grain originates from these so called geometric dynamic recrystallisation. In more detailed flow studies dynamic recrystallisation has not been observed and indeed may, in our opinion, be a researcher's misinterpretation of an insufficiently prepared micrograph. Despite this fact, it is very clear that in indirect extrusion the subcutaneous layer of the billet will form the subcutaneous layer of the extrudate (see column 2 in Fig. 8b) or even the extrudate surface if we take the computation tolerance of the FEM software into account. Combining information from both Figs. 7b and 8b the conclusion can be drawn that the extrudate surface is formed by material from the die/billet interface and could also contain material from the subcutaneous layers of the billet (but not from the initial 0·5 mm surface depth) that later slide along the die/billet interface. This implies that control of billet quality in indirect extrusion requires either no machining of the billet surface or very little careful pre-machining.
Zener–Hollomon parameter
The Zener–Hollmon parameter appears in many of the analyses necessary to determine the structure within the extrudate since it largely determines the subgrain size and by incorporating the ‘Holt’ (Sheppard and Paterson) relationship may also predict the dislocation density. Because during the steady state Zener value will not vary much, only its distributions at the ram travel of 65 mm are shown in Fig. 9 for both modes. Figure 9 indicates that the distribution of this parameter throughout the partially extruded billet after 65 mm ram travel. In direct extrusion in the vicinity of the die entry the parameter is at its maximum whilst in the DMZ the values are low. They are also of smaller magnitude at the rear of the billet. The fact that they exhibit a value above zero is an anomaly caused by the temperature being much greater than the strain rate which is very close to zero in these regions. The same comments apply to the indirect case where the die face/billet can be regarded as asymptotic to the blocker/billet interface and also exhibit low values. This presents a problem in the incremental calculation of structural parameters (i.e. subgrain size, dislocation density and misorientation). This is thus one more fertile research area. Figure 9 indicates substantial differences in the Z parameter during direct versus indirect extrusion modes. Thus, we may safely conclude that structure and properties resulting from the alternative processes will also vary. In Fig. 9 we have manually altered these points to give a zero value.
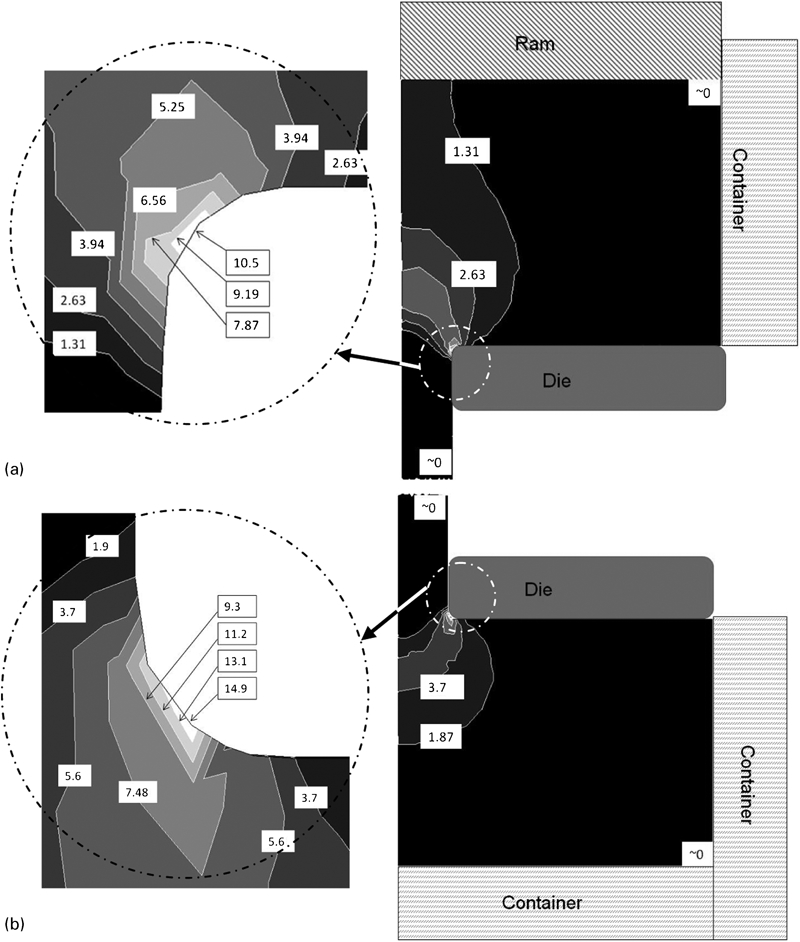
Distribution of parameter Z (×1010) for a direct and b indirect extrusions
Integrating appropriate mathematical models into Forge, microstructure evolution information during different metal forming process can be predicted. Good results have been obtained by Duan21 for aluminium rolling combining the FEM with the microstructure evolution models through Forge's subroutine interface. Later this integrated modelling method was applied by Peng22 to a more complicated forming process such as 2D rod simulation. Because of greater relevance to the current study these results will be briefly reviewed.
In Fig. 10, the simulated subgrain size is compared to the experiments. Although the biggest error is ∼17·5, the prediction can be taken as reasonable for there is a relative error of 9 in any subgrain size measurement.
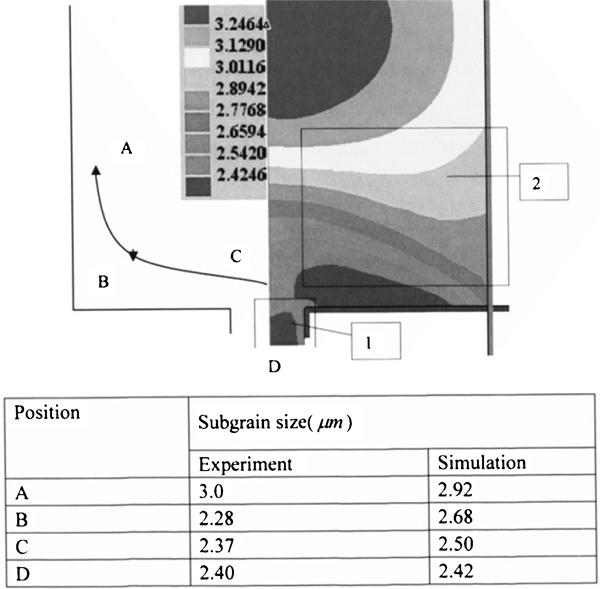
Subgrain size distribution
Conclusions
The pressure and temperature loci analysed for the alternative processes indicate that, for the indirect mode, productivity may be increased by utilising an extended ram stroke producing a slimmer discard. The values predicted for the predicted pressure necessary to produce the extrudate were very close to the experimental value. Predicted contours for iso-temperatures are also very sensible.
For direct extrusion the original billet surface can be seen to reside either in the discard or in the DMZ at conclusion of the ram stroke. The surface is formed from the regions subcutaneous to the billet surface and located in a position between the experimental sensors defined by columns 1 and 2. In indirect extrusion, the surface is largely formed from the original billet face and not from the billet surface material (which is most generally accepted). The authors consider that more thorough investigation is required on this particular point.
The origin of the surface of the extrudates is significantly different between the two modes of extrusion. The predicted distribution of the Z parameter is acceptable and varies in the differing modes. It is concluded that incremental calculation of substructural parameters requires intensive study and at the present time a suitable model for this does not exist.