
Abstract
In the present study, the accumulative roll bonding (ARB) process was used as a technique for manufacturing aluminium–alumina composites. Textural evolution during the ARB process of composites was evaluated using X-ray diffraction. After the first ARB cycle, copper {112}〈111〉 and brass {011}〈211〉 were the major texture components. However, with the progress of deformation after 5 cycles, the components transformed completely, and the rotated cube {001}〈110〉 component became dominant, which remained as the major component in higher cycles (ninth and thirteenth). This shear texture was developed due to the shear deformation induced by the high level of friction between the rolls and the strips. Generally, the intensity of all the texture components, except that of the rotated cube, was very weak. This result is attributed to the presence of second phase particles.
Introduction
Recently, severe plastic deformation (SPD) has been well documented as a tool for producing bulk nano- and ultrafine grained materials.1 The main feature of all SPD methods is the accumulation of large plastic strain without any remarkable change in the specimen dimensions.2 In recent years, there has been quite a bit of work to understand the effects of SPD techniques, such as equal channel angular pressing, high pressure torsion and accumulative roll bonding (ARB) on microstructure, mechanical properties and texture, especially in face centred cubic (fcc) metals1,3–8 and, to some extent, in steels.9
The ARB process developed by Saito et al.5 is a process to impose severe plastic strain on materials without changing the specimen dimensions. The ARB process involves rolling the sheets, cutting them into stacks and then roll bonding. By repeating this procedure, very high strains have been introduced successfully into different metals and alloys, and as a result, significant structural refinement has been achieved.5–7
Material texture is defined as a microstructural property that describes the orientation distribution of the grains constituting a polycrystalline aggregate. Severe plastic deformation processes, which involve large strain levels and, in some cases, frequent strain path changes, are expected to lead to substantial changes in texture. The post-processed deformation texture can influence many aspects of material behaviour, such as strength, workhardening, plastic anisotropy, formability, grain refinement and fracture. Most of these structural properties of interest cannot be fully understood without knowledge of the texture of the SPD processed metal.10
In commercially pure Al, it has been shown by Heason and Prangnell11 that most of the shear texture is rotated to Cu {112}〈111〉 and S {123}〈634〉 textures when incorporated at the centre during the ARB process. Kim et al.12 also observed the presence of ideal copper {112}〈111〉 and Dillamore {4 4 11}〈11 11 8〉 orientations at the centre during ARB in A8011 alloy. In commercially pure Al, it has been shown from {111} pole figures that the texture that is developed after ARB is asymmetric and very weak. 7 7,13
Although extensive studies have been conducted regarding the microstructural evolution and mechanical properties of materials processed by the ARB process, there is very limited quantitative information available on the texture evolution during this process. Furthermore, the textural behaviour of metal matrix composites produced by the ARB process has not yet been investigated. In the present investigation, an attempt is made to understand the textural changes in the Al–Al2O3 composite produced by the ARB process.
Experimental
The materials used in the present study were fully annealed strips of commercial purity aluminium alloy (specifications are given in our previous article)8 and Al2O3 particles (<50 μm). Two strips of 200×50×1·5 mm were degreased in acetone bath and scratch brushed with a stainless steel brush wire of 0·26 mm diameter. After surface preparation, Al2O3 particles were uniformly dispersed between the two strips, which were then stacked over each other and fastened at both ends by copper wires. Attention was also paid to proper alignment of the two strip surfaces before rolling. The roll bonding process was carried out with no lubrication using a laboratory rolling mill, with a loading capacity of 20 tons. The roll bonding process was carried out with a specific amount of reduction equal to 50 (corresponding to a von Mises equivalent strain ϵvM of 0·8/cycle). Then, the roll bonded strips were cut in half. The same procedure was repeated up to 5 cycles at room temperature (the first step). Then, to achieve a uniform distribution of reinforcement particles in the matrix and also to remove porosities in the interfaces of aluminium–aluminium and aluminium–alumina, the above procedure was repeated up to 13 cycles without adding reinforcement particles (the second step). The schematic illustration of the ARB process for manufacturing of composite is shown in our previous article.8
Macrotexture observations were performed on the section that is perpendicular to the transverse direction of rolling (RD–TD (Rolling Direction–Transverse Direction) section). Texture was measured on an area of 25×15 mm of the samples and in the subsurface region that is 0·25 mm under the surface of the samples. These samples were prepared by standard metallographic procedures (grinding and mechanical polishing). Texture measurements were made by recording pole figures of (111), (200) and (220) planes by X-ray diffraction. A pole figure is a two-dimensional distribution of a crystal direction (e.g. pole to a lattice plane hkl) relative to sample coordinates. Pole figures are expanded with spherical harmonic series in the Fourier space. The expansion is carried out up to a finite order, usually between 16 and 32, providing an angular resolution of about 10–15°. Euler angles that correlate with the orthogonal sample and crystal coordinate systems are defined by three rotations. The corresponding rotations φ1, Φ and φ2 are used in the Bunge convention. The experimental pole figure data were used to calculate orientation distribution function (ODF) using Textools software. In each case, three pole figures were used to determine the ODF. For a better understanding of the texture evolution, the main fcc fibres were calculated directly from the calculated ODFs. The f(g) denotes the normalised orientation density output from the ODF data. For measuring the intensity of α-fibre, the calculated ODF data versus φ1, where Φ = 45° and φ2 = 0°, were drawn. For the intensity of τ-fibre, the calculated ODF data versus Φ, where φ1 = 90° and φ2 = 45°, were also drawn.
Results
Figure 1 demonstrates the {111} pole figures of the annealed aluminium and ARB processed composites after 1, 5, 9 and 13 cycles. The figures did not show any kind of asymmetry along RD and TD. Based on previous research, 11 12 11,12,14 the initial texture of the annealed commercial purity aluminium is cube texture {001}〈100〉 with a maximum intensity of 2×R, evidently a weak and close to random texture, which is characteristic of the recrystallised state. After 1 cycle of the ARB process, the pole figure of the composite indicates wholly different features. The texture components after one ARB cycle can be characterised as copper {112}〈111〉 and brass {011}〈211〉 (Fig. 1a). The maximum intensities of the copper and brass components are 1·7×R and 1·4×R respectively, both of which are very weak and very close to random texture. However, the texture component of copper is clearer. The {111} pole figure of the ARB processed composite after 5 cycles is presented in Fig. 1b. Again, it can be seen that the texture components are different from those in the first cycle. In this specimen, the rotated cube {001}〈110〉 component with a maximum intensity of 2·4×R is the major component. The texture component after nine ARB cycles can be characterised as a rotated cube, too (Fig. 1c). Although the texture evolution is similar to that of the five ARB cycle specimen, the intensity is reduced to 2×R. Finally, the {111} pole figure of the ARB processed composite after 13 cycles is presented in Fig. 1d. In this specimen, the texture components are very similar to those of the 9 cycle ARB processed composite. In other words, the rotated cube component with a maximum intensity of 2×R is the dominant component.
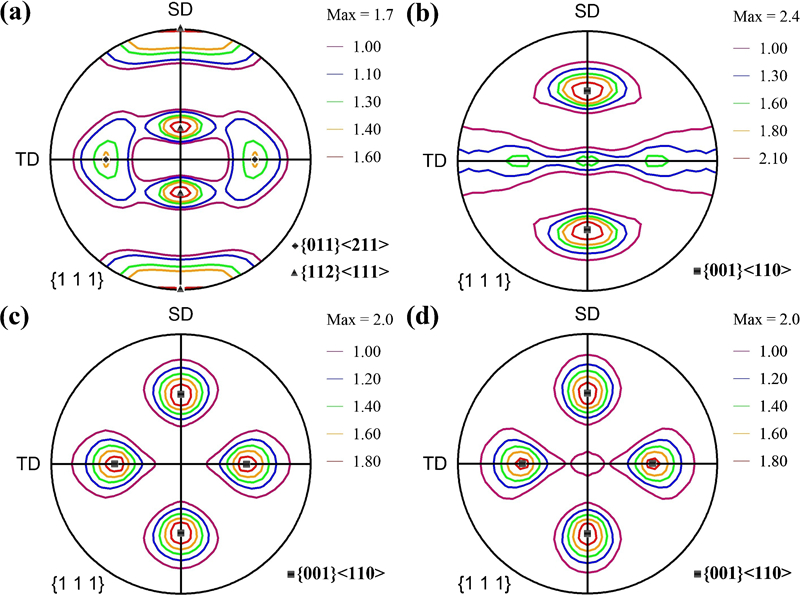
{111} pole figures of ARB processed composites after a one, b five, c nine and d 13 ARB cycles
From the pole figures, assuming an orthogonal symmetry, the ODFs were calculated for a better description of texture evolution. Figure 2 illustrates the ODF for the ARB processed composites after 1, 5, 9 and 13 cycles. The ODF plots separate the components partially overlapping in the pole figures, thus allowing for a more unambiguous comparison of the individual components and fibres. 13 13,15 Figure 2a illustrates the ODF after the first cycle. The textural components can be characterised as the brass component {011}〈211〉 and the copper component {112}〈111〉. The maximum intensities of the copper and brass components are 2·6×R and 1·3×R, respectively. After the fifth cycle (Fig. 2b), it can be seen that the components have changed completely; this finding coincides with the corresponding pole figure. The dominant component is a rotated cube {001}〈110〉 with maximum intensity of 6×R, which introduces shear texture. In other words, the overall intensity after the fifth cycle indicates a remarkable increase compared to that of the first cycle. After the ninth cycle of the ARB process (Fig. 2c), a similar ODF to that of the 5 cycle ARB processed composite was observed, and the most striking point here is that the overall texture intensity remains almost the same even after an increase in the strain level. In this specimen, again, the rotated cube component with a maximum intensity of 5·7×R is the major component. Finally, after 13 cycles also, the evolution of the textural components is very similar to that of the 9 cycle ARB processed composite (Fig. 2d). In other words, the rotated cube component with a maximum intensity of 5·7×R is the dominant component. It seems that from 5 cycles onwards, the texture of the composites does not change much with the increase in degree of cold rolling.
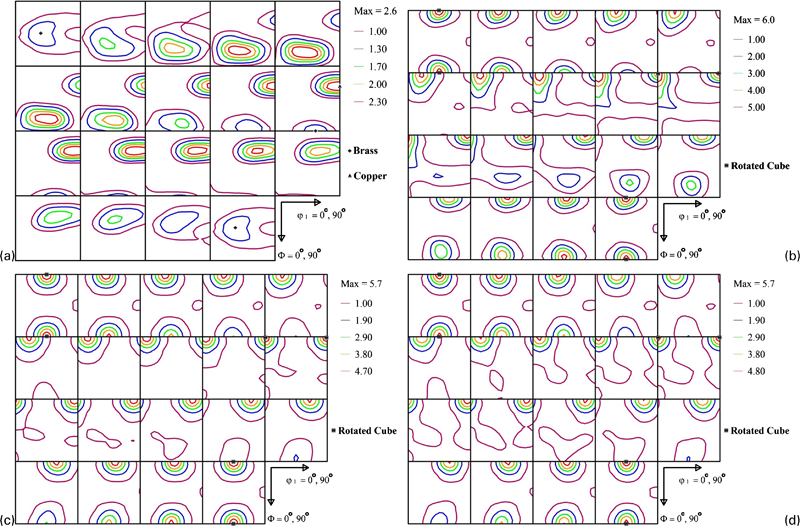
Orientation distribution functions of ARB processed composites after a 1, b 5, c 9 and d 13 cycles
Textural evolution can be clarified more by showing the fibres during the process. Therefore, the orientation density f(g) of the main fcc fibres (α, β and τ) was calculated after calculating the ODF using orthogonal symmetry, as plotted in Fig. 3. The orientation density of the α-fibre for different cycles of the ARB process is shown in Fig. 3a. In the 1 cycle ARB processed composite, the textural evolution is mainly centred on the brass {011}〈211〉 component. From Fig. 3a, it is also observed that for the fifth, ninth and thirteenth cycles, the brass component disappears, and there is no sign of the α-fibre. In other words, for the 5, 9 and 13 cycle ARB processed composites, the overall intensity of the α-fibre becomes homogeneous with a very low value.
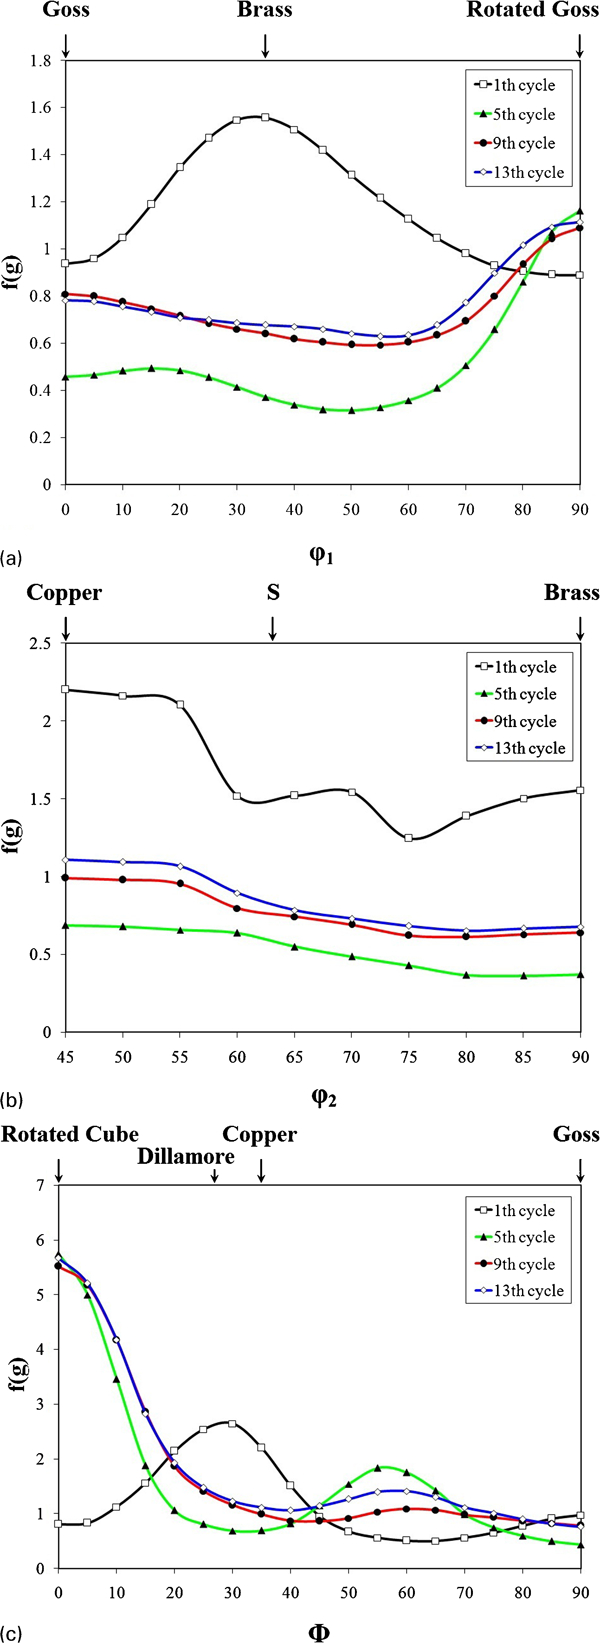
Fibres developed during ARB process for aluminium–alumina composite
Figure 3b shows the intensity of the β-fibre during the successive cycles. After 1 cycle, the textural evolution is centred mainly around the copper {112}〈111〉 and brass {011}〈211〉 components. In the higher cycles, it can be seen that the copper and brass components disappear, and there is no sign of the β-fibre. In other words, the overall intensity of the β-fibre becomes wholly uniform with a very weak value for the 5, 9 and 13 cycle ARB processed composites.
Finally, the τ-fibre is presented in Fig. 3c. For the 1 cycle ARB processed composite, the textural evolution is centred mainly around the Dillamore {4 4 11}〈11 11 8〉 and copper {112}〈111〉 components. However, by increasing the number of cycles, it can be seen that textural evolutions have occurred around the rotated cube {001}〈110〉 component. Generally, the τ-fibre shows an almost strong intensity distribution.
Discussion
In the present work, it is observed that the symmetry of the pole figures is perfect for all specimens. The textural evolution after 1 cycle changed to copper {112}〈111〉 and brass {011}〈211〉 components. Later, with the progress of deformation, the copper and brass components completely transformed to a rotated cube {001}〈110〉 component. This means that in the early stages of the ARB process, the volume fraction of the {110} components (such as the brass component) is low, and by increasing the number of cycles, it reduces, which is typical of materials with high stacking fault energy, such as aluminium.16
However, there was no major change in the textural components as well as texture intensity in the 5, 9 and 13 cycle ARB processed composites. This result is consistent with other researchers’ findings,10 which have shown that it is possible for the texture evolution to saturate after many cycles (usually beyond 4–8) to a steady state texture. In addition, this result may be attributed to adding no alumina particles between aluminium strips from the fifth cycle onwards.
The rotated cube component becomes dominant maybe from the fifth cycle onwards. The most important parameter that influences texture component development is friction. The texture heterogeneity becomes more pronounced under conditions of high friction. It has been reported14 that the surface shear textures developed in fcc metals include {001}〈110〉 and {111}〈110〉 components. In ARB, a large amount of redundant shear strain owing to the friction between the rolls and the materials is introduced into the surface region, so shear texture is formed near the top surface of the strips. Additionally, half of the severely deformed region near the surface comes to the centre by cutting and stacking in the next ARB cycle. As a result, unlike conventional rolling, the sheared regions do not localise only at the subsurface layers but are distributed throughout the thickness of the strips as the ARB cycles proceed along. The ARB processed materials have quite complicated combinations of plane strain deformation and shear deformation, depending on two parameters17
location of thickness: if the texture measurements are carried out nearer to the surface, the shear texture, such as the rotated cube component, is developed. In the present work, texture measurements were carried out in the area that is 0·25 mm under the surface of the strips. Thus, the presence of rotated cube as the major texture component in the present study can be somewhat related to this parameter anyway
number of cycles: when the number of cycles increases, the number of interfaces increases, too, and the distance between them decreases. These interfaces have shear texture anyway. Therefore, beyond a specific cycle's number, the shear texture (rotated cube component) can become a major component. In the present research, after 1 cycle, the rotated cube was not dominant. However, when the number of cycles was increased (from 5 cycles onwards), the rotated cube texture component as shear texture became a major component. In other words, by increasing the number of cycles, the possibility of dominating the shear component becomes higher. Therefore, the presence of rotated cube as the dominant texture component in the present study can be attributed to this parameter more than the previous parameter. Several authors 12 12,15 have stated that the shear texture easily changes to the rolling texture during the next ARB cycle. However, the findings in the present work show that the alumina particles between strips lead to the presence of shear texture even after the next ARB cycles. In other words, the Al2O3 particles can prevent grain rotations as well as changes in the shear texture through the strip thickness during the ARB process.
Generally, in the present study, the intensity of all the texture components was very weak except for the rotated cube component. This result is related to the presence of second phase particles. The effect of second phase particles on the deformation texture depends on the size, volume fraction and strength of the particles. Large (>1 μm), non-deformable particles are associated with a zone of lattice rotation, and in these regions, the formation of the normal deformation texture is disrupted. The volume of this zone is comparable to that of the particle, and therefore, for conventional alloys, in which the particle volume fraction is typically less than ∼0·05, the overall effect on the deformation texture is small. However, in particulate metal matrix composites, which have much higher volume fraction of particles, the volume of the particle deformation zones is significant, and the deformation textures are very weak.14 In addition, according to Heason and Prangnell,11 the occurrence of large lattice rotations around the second phase particles during the deformation of particle containing aluminium alloys leads to the increase in local misorientations and the production of new high angle grain boundaries. These dispersed particles also develop a random and more heterogeneous plastic flow behaviour within the matrix and promote the fragmentation of lamellar structures. Furthermore, Kim et al.12 have said that the particles might bring about an inhomogeneous deformation around them, which would result in a weakening of the texture. Generally, it is noticeable that at large strains, the strongest texture develops in the single phase alloy,18 but that in the aluminium–alumina ARB processed composite, the texture generally weakens. This is due to the effect of large second phase particles, which randomise the deformed texture in the area beside the particles.
Meanwhile, the presence of second phase particles can also accelerate the rate of dynamic recovery. Accumulation of dislocations in the vicinity of these particles rapidly transforms the low angle grain boundaries to high angle grain boundaries and forms an equiaxed ultrafine grain structure, thereby decreasing the texture intensity.11,12,19–21
As mentioned before, for the 5, 9 and 13 cycle ARB processed composites, the overall intensity of the β-fibre becomes homogeneous with a very low value. It has been reported that in fcc materials after cold rolling with high friction, a normal β-fibre is found in the middle,12 which confirms the decrease in β-fibre intensity on the nearby surface. Generally, more specimens in the present work had a strong τ-fibre, while the β-fibre was the weakest.
The mechanical properties and tribocorrosion of these composites were discussed in the authors’ previous article. 8 22 8,22,23 Further studies, focusing on corrosion, wear, TEM, and electron backscatter diffraction investigations, are now in progress.
Conclusions
In the present work, the ARB process was performed up to 13 cycles at ambient temperature for manufacturing the aluminium–alumina composite. Textural evaluation showed that after the first ARB cycle, copper and brass were the dominant components. However, with the progress of deformation after 5 cycles, the components changed completely, and the major component became rotated cube, which introduced shear texture. The same texture was observed after 9 and 13 cycles of the ARB process. In other words, there was no major change in the textural components as well as texture intensity in the 9 and 13 cycle ARB processed composites. Generally, the intensity of all the texture components was weak except for the rotated cube component. This result was related to the presence of second phase particles.