
Abstract
Metallographic characterisation is combined with statistical analysis to study the microstructure of a BT16 titanium alloy after different heat treatment processes. It was found that the length, width and aspect ratio of α plates in this alloy follow the three-parameter Weibull distribution. Increasing annealing temperature or time causes the probability distribution of the length and the width of α plates to tend toward a normal distribution. The phase transformation temperature of the BT16 titanium alloy was found to be 875±5°C.
Introduction
The BT16 titanium alloy was developed in Russia. It is widely used in Russian military and civilian airplanes and space components. It has reliable properties and is commercialised, especially for making fasteners. Research on this alloy has in recent years moved to China, on various processing routes including alloy melting, rolling and extrusion, straightening and surface smoothing of rods, and the relationship between heat treatment and mechanical properties.1
The BT16 titanium alloy belongs to two-phase titanium alloys. Owing to experimental limitations, the research concentrated on the constitutive relations of the titanium alloys.2 Studies included the effects of deformation parameters and alloy composition on the deformation behaviour, the material hardening during the deformation process, and the material softening due to the deformation heat. Empirical relations were proposed. In addition, research has found that the tensile ductility of granular or plate microstructures is not strongly dependent on the grain size.3
In the past decade, research that is more systematic has been carried out on the microstructural evolution during complex deformation process of two-phase titanium alloys. The deformation mechanisms and their relations with the deformation process have been studied, as have the relationships between microstructure and the deformation behaviour and mechanisms.4–6 There has been much research on the α phase evolution and the strengthening mechanisms in α+β titanium alloys.7–12
The hardness of α′ is just slightly higher than that of the α solid solution. When α″ appears, the strength and hardness of the alloy even decrease. Martensite should be avoided in the BT16 titanium alloy as much as possible before deformation processing.
The microstructure characteristics of the metal have an important influence on the local stress state including the grain friction during cold deformation. The microstructure determines the deformability of the metal. A good microstructural state is an important precondition for good cold deformability of BT16 alloy fasteners, and this is controlled by the heat treatment before cold deformation. In addition, in order to obtain good mechanical properties of the fastener products, heat treatment is usually required after forming to increase strength, which also requires a good knowledge of the heat treatment effects of the BT16 titanium alloy. Therefore, it is very important to understand the effect of the heat treatment processing parameters on the microstructure of the BT16 titanium alloy.
At present, the BT16 titanium alloy for cold deformation mainly has a plate microstructure. This type of microstructure is significantly affected by heat treatment processing parameters.12–16 In the past, research on the heat treatment of titanium alloys and their microstructures were mostly concerned with alloys having acicular microstructures. The research was mainly on the effect of heat treatment on the phase composition. Quantitative research on the relationship between the heat treatment and the microstructure changes has been limited. 17 17,18 On the other hand, as stated above, revealing this relationship between the heat treatment process and the microstructural parameters of the BT16 alloy is critical to studying its cold deformation behaviour and establishing its cold deformability.
The present paper examines the length, width and the aspect ratio of α plates and carries out statistical analysis of their relationship with annealing conditions. The effects of heat treatment temperature and time on the phase formation of the plate structure in the BT16 titanium alloy are studied. Recently, the relationship between microstructure and deformation behaviour during dynamic compression in this alloy has been studied,19 but it does not contain the detailed measurements of microstructural changes induced by heat treatment.
Experimental
Material and heat treatment parameters
The material studied in the present paper is BT16 titanium alloy, produced in Russia for cold deformation processing of fasteners used in airplanes. The as received state was in the form of a 8 mm diameter rod, in hot rolled and annealed condition. The rod had a relatively homogeneous microstructure after hot rolling and annealing. The compositions of the BT16 alloy are 3Al, 4·6Mo, 4·9V, 0·01C, 0·17Fe, 0·04Si, 0·30Zr, 0·14O, 0·011N, 0·01H, ⩽0·30 others and Ti balance (wt-).20–22 The alloy thermal history was proprietary to its manufacturer and was not declared. The microstructure of the as received alloy will be shown and statistically analysed later in the present paper.
The heat treatment of the rod material was carried out in a 4000W SX2-4-10 resistance furnace. The furnace temperature was calibrated using a standard NiCr–NiAl thermocouple, to an accuracy of ±5°C.
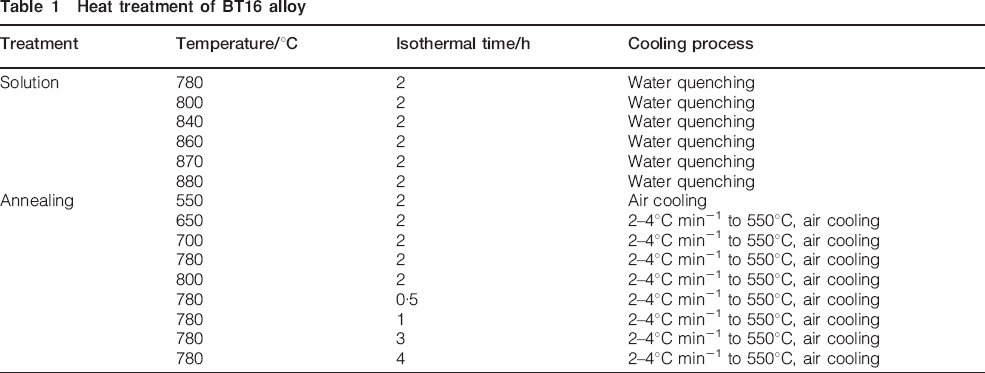
The heat treatment process involved the following steps. The alloy was inserted into the furnace preheated to the desired temperature and kept for a certain period, followed by different ways of cooling. Water quenching was used after solution treatment, which involved 2 h at 780, 800, 840, 860, 870 and 880°C. After annealing treatment, cooling involved furnace cooling at a rate of 2–4°C min−1 to 550°C, followed by air cooling. Two groups of annealing treatment were used. The first group involved a constant annealing time of 2 h, at 550, 650, 700, 780 and 800°C. The second group involved a constant annealing temperature of 780°C, for 0·5, 1, 2, 3 and 4 h. Table 1 shows the heat treatment combinations.
Heat treatment of BT16 alloy
Microstructural examination
After heat treating the specimens, the oxide layer on the surface was removed by grinding. Coarse and then fine grinding using sand papers followed, until the specimen surface was shiny. Then the specimens were electropolished. The electrolyte was 60 ml perchloric acid, 350 ml ethane-1,2-diol and 390 ml methanol. The process parameters were ∼30 V, ∼1 A, for ∼30 s.
The etching solution for the BT16 titanium alloy consisted of 100 ml H2O, 4 ml HNO3 and 2 ml HF. An XJP-3C optical microscope was used to examine alloy microstructure after heat treatment.
The procedure for transmission electron microscopy (TEM) and selected area electron diffraction of the as received specimens was as follows. Slices of 0·3 mm thickness were cut using an electrical discharge machine with molybdenum wires. This was mechanically thinned to 50 μm, and then ion beam thinned in vacuum using GL-6960 equipment, at a voltage of 6 kV, current of 0·4 mA and vacuum level of 10−5 Pa or better. Specimens of TEM were obtained in this way. The as received state of the BT16 titanium alloy was examined with a Hitachi H-800 TEM, using bright field imaging and selected area electron diffraction.
Procedures used for analysing microstructures
The statistical method for analysing microstructural parameters of α plates in the BT16 titanium alloy is as follows. In each heat treatment condition under examination, five metallographic photographs were taken at about ×1000 magnification, along the axial direction of the BT16 titanium alloy rod (Fig. 1). In each micrograph, a circle having a diameter of 50 μm was drawn, with the centre randomly selected (Fig. 2). The microstructural parameters of all the α plates intercepting the circumference are statistically collected, including length, width, and the angle between the length direction and the horizontal direction of the picture (Fig. 3). In each heat treatment condition, the number of α plates analysed is more than 800. The α grain size was statistically calculated by dividing the circle (Fig. 2) area by the number of α grains inside the circle. The latter value equalled the sum of α grains completely inside the circle and half of the α grains intersecting the circle.
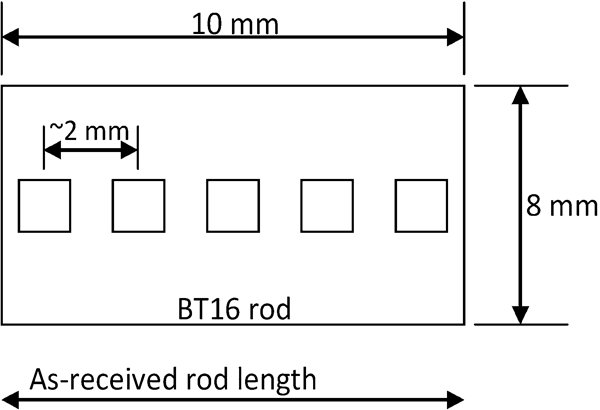
Five photo locations for taking micrographs for statistical processing of microstructural parameters: 10 such 10 mm length samples were cut from as received 100 mm length rod
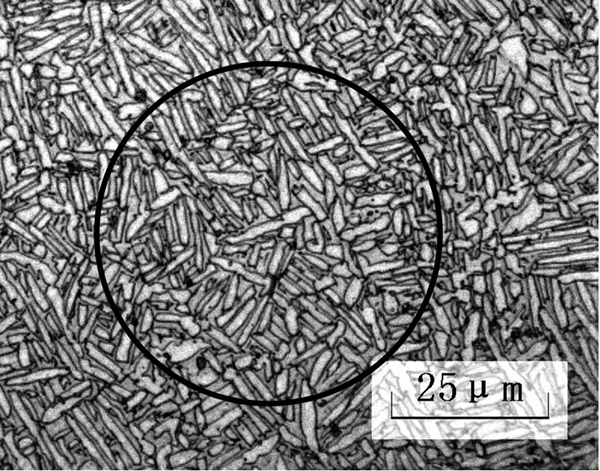
Method of choosing grains for statistical processing of microstructural parameters
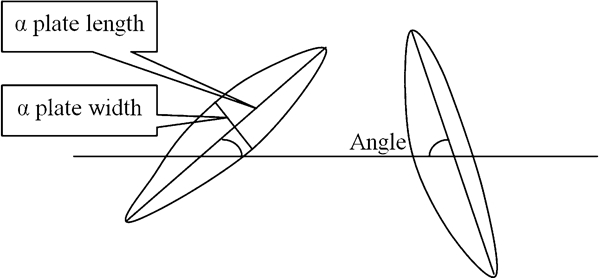
Schematic diagram showing measurement of α plate microstructural parameters
Results and discussion
As received microstructure
Figure 4 shows the typical microstructure of the as received BT16 titanium alloy rod, on a longitudinal section. The microstructure consists of a mixture of β phase (note: not transformed β phase) and fine plate shaped α phase. The average length of α plates is ∼4·4 μm, width ∼1 μm and aspect ratio ∼5·3. The aspect ratio is the ratio of the length to width. However, the average aspect ratio here (5·3) is the average of the aspect ratio values measured on individual plates, and not the ratio of the average length (4·4 μm) and the average width (1 μm). This is why it deviates from 4·4/1, but not very significantly. The β fraction is ∼33. This was measured on optical micrographs, and not using TEM. Scanning electron microscopy is unnecessary for this purpose. Five measurements were made, but no error data were kept after the experimental work. The error among the five measurements was small. The β fraction was determined by the alloy composition, hot working process and so on. In the present paper, the value would not be changed by heat treatment. Thirty-three per cent is an average value. The as received hardness is 30 HRC. The α+β two-phase state, which the BT16 alloy is in, is common in nearly all titanium alloys, a range of which is discussed in Ref. 12. The difference is the detailed α morphology, shown here for this particular alloy not previously well characterised.
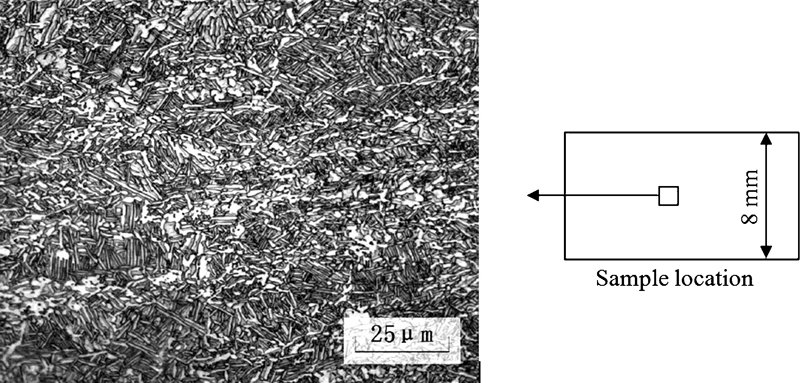
Typical microstructure of BT16 titanium alloy for cold deformation
Selected area electron diffraction results show that in the as received state, only the hcp α phase and the bcc β phase are in the BT16 titanium alloy (Fig. 5). The β phase is distributed around the α phase.
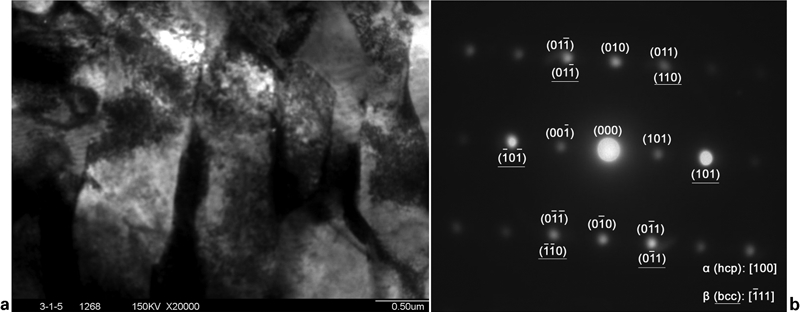
a plate morphology microstructure and b electron diffraction pattern of BT16 alloy rods for cold deformation
Effects of solution treatment parameters on microstructure
In order to determine the phase transformation temperature of the BT16 titanium alloy, systematic solution treatment on the alloy was carried out. The results show that there are two types of effects of the solution temperature on the metallographic phase formation and morphology in the BT16 titanium alloy, depending on the solution treatment temperature range, at 880°C, or 870°C or lower. Differential scanning calorimetry was not used.
At a solution temperature of 880°C or higher, the quenched microstructure is mainly martensitic (Fig. 6). This is because, before quenching, the alloy was in the single β phase field. Quenching induces the β to α″+βresidual transformation. The high temperature β phase has transformed to coarse α″ phase.
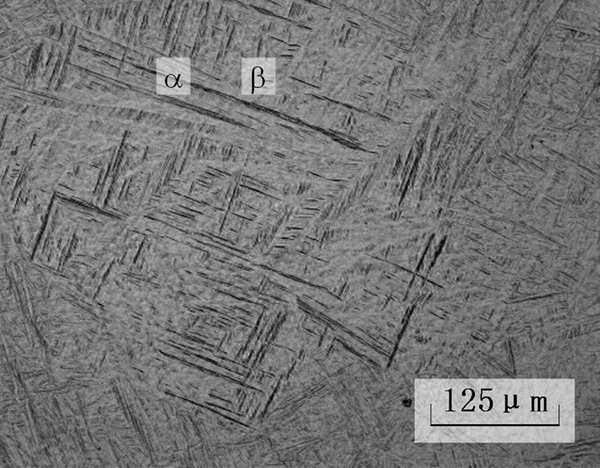
Metallography of BT16 titanium alloy after 2 h at 880°C and water quenching
When the solution temperature was 870°C or lower, the quenched microstructure is a mixture of α″ martensite and α phase (Fig. 7). Because the alloy was quenched from the α+β two-phase field, there is also β to α″+βresidual transformation at quenching. However, as the transformation happened in the two-phase field, there was already a certain amount of α existing before quenching. Thus, the final microstructure is an α+α″+βresidual mixed structure. With increasing heating temperature and gradually decreasing the amount of α phase, the amount of α″ martensite continues to increase (Fig. 7).
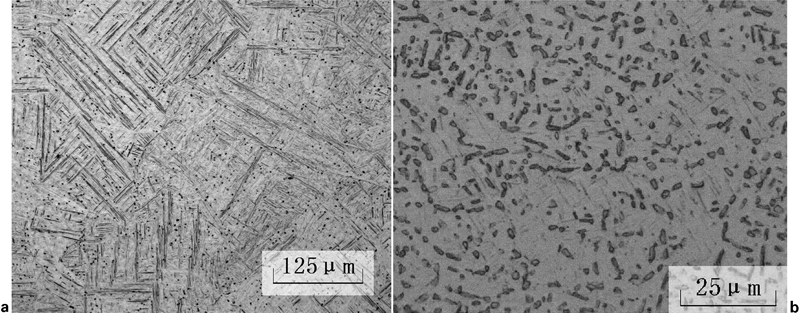
Metallography of BT16 titanium alloy quenched from two-phase field of a 870°C and b 840°C: specimens were held at 870 or 840°C for 2 h before quenching; α phase appears as numerous small dots in a, as it is in shape of particles; its quantity increases in b
Comparing Figs. 6 and 7a, there is no α phase in the microstructure of BT16 titanium alloy quenched at 880°C, but there is a small amount of α phase particles in the alloy microstructure after quenching at 870°C. This is the standard way of measuring the phase transformation temperature of titanium alloys,12 which in this case is determined as 875±5°C for the BT16. Such a β transus temperature may be compared with β transus temperatures of other commercial and experimental titanium alloys, discussed in detail in Ref. 12.
X-ray diffraction cannot detect phases in small quantities, at the level shown in Fig. 7a. If the amount of a phase in the material is less than ∼2, its diffraction peaks cannot be revealed to statistically significant levels. Differential scanning calorimetry, on the other hand, is not a good tool to measure isothermal transformation temperatures. This is because this technique measures phase transformation during continuous heating or cooling. Under continuous heating or cooling, there is always over heating or under cooling, before a transformation happens. Therefore, phase transformation temperatures measured by differential scanning calorimetry are not transformation temperatures under isothermal conditions, but the normal heat treatment of titanium alloys is almost always conducted isothermally.
Statistical analysis of microstructure
In order to better understand the growth process of the α plates during annealing, and provide information for possible future numerical simulation of the deformation process of the BT16 titanium alloy, statistical analysis is required of the probability distribution of microstructural parameters of the α plates in the BT16 titanium alloy under different annealing conditions. At present, two types of models for describing the microstructural evolution of materials during heat treatment are widely used. The first type is the grain growth model and its derivatives. 23 23,24 The second type uses a statistical approach, without considering grain growth mechanisms. 25 25,26 The first type is mainly for describing the steady state grain growth process, but the BT16 titanium alloy has phase transformation during annealing, so only the second type can be used here to describe the α grain growth phenomenon in the BT16 titanium alloy. As this is a statistical approach as against a physical one, it can be used on two-phase alloys.
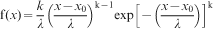
Statistical analysis shows that, in the as received state as well as after different annealing process, the probability distribution function for all microstructural parameters of the α plates in the BT16 titanium alloy follows three-parameter Weibull distribution27
Figures 8 and 9 show the statistical probability distributions and their numerical fitting results of α plate length, width and aspect ratio in as received state and after annealing for 2 h at 780°C respectively. In the horizontal coordinate of these diagrams, the data was normalised, i.e. the plate width was divided by the average value of plate width. The column chart data was fitted by minimising the sum of the squares of the errors (the difference between experimental data and fitting curve), i.e. the method of least squares. A good match can be seen between the measurement data and the numerical fitting curves. In both the as received and the annealed states, all three microstructural parameters of the α plates have non-symmetrical distribution, with the peak position to the left. This confirms the tendency of non-symmetric probability distribution of microstructural parameters in the BT16 titanium alloy. This tendency appears to be the strongest in the case of aspect ratio.
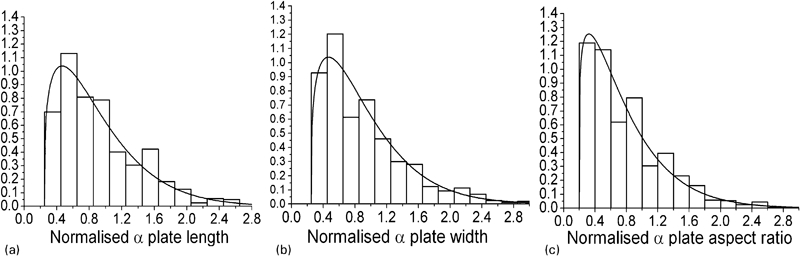
Distributions of α plate in as received state of BT16 titanium alloy
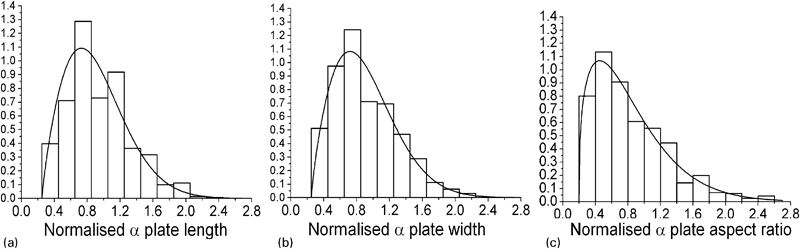
Distributions of α plate in BT16 titanium alloy after annealing for 2 h at 780°C
The microstructural probability distribution in the BT16 titanium alloy shows that, in terms of numerical values, for most plates, their microstructural parameters are smaller than the average. A small fraction of plates has such values higher or even much higher than the average. Such large plates may have deformation incompatibility with other plates, affecting the deformability of the alloy.
Figure 10 shows the effect of annealing temperature on the probability distribution of microstructural parameters of the α plates in the BT16 titanium alloy. As shown in Fig. 10a and b, when annealed at the same temperature, the probability distribution is very similar, for the length and the width of the α plates.
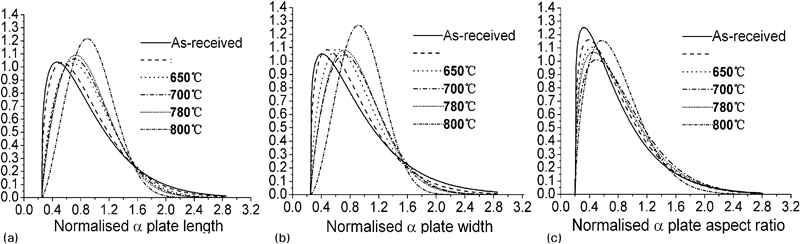
Effect of annealing temperature on distribution of microstructural parameters of BT16 titanium alloy: annealing time is 2 h
A normally distributed α plate size would be beneficial to facilitating a good deformation response, as against a strongly skewed Weibull distribution. Deformation occurs by coordinated movement and shape change of α plates, and good coordination will be easier to achieve when all α plates have similar sizes. In a strongly skewed Weibull distribution, however, the deformation or the movement of a few very large α plates could introduce cracking, which does not help the process. It is unclear at this stage how the distribution becomes more normal/Gaussian with increasing heat treatment temperature and how the heat treatment has removed some of the outliers that skew the data. The finding itself as shown in the measurement data, however, is significant and the study has practical implications.
It may be noted that the method used to determine the α plate dimensions is not a standard testing method (e.g. ASTM or ISO method). It is a new method just provided by the authors.20
Though not used for describing the probability distribution of microstructural parameters of titanium alloys, Weibull distribution has been used in relation to fatigue life properties of titanium alloys. For example, it was found that a simple Weibull distribution describes very well the number to failure statistics in a near-α titanium alloy IMI 834.28 In a separate work, statistical characteristics in simulated life distributions were investigated using Weibull distribution function.29 Other properties, such hardness, are investigated with Weibull statistics. For example, it was found that the nanostructured coating and the conventional coating on titanium alloy substrates exhibit a bimodal distribution of microhardness values, which are analysed via Weibull statistics.30
Conclusions
The microstructural characteristics including the length, width, aspect ratio and size of the α plates in the BT16 titanium alloy have been analysed statistically, to investigate the effect of annealing process on microstructural morphology and parameters. Using solution treatment experiments, the phase transformation temperature of the BT16 titanium alloy have been found. This provides a basis for choosing pre- and post-deformation heat treatment parameters for fastener applications. The main conclusions are as follows.
1. The phase transformation temperature of the BT16 titanium alloy is 875±5°C.
2. The length, width and aspect ratio of α plates in the BT16 titanium alloy all follow the three-parameter Weibull distribution. Increasing annealing temperature causes the probability distribution of the length and width of α plates to tend toward normal distribution.
Footnotes
Acknowledgements
This paper is financially supported by the Program for Cheung Kong Scholar and Innovative Research Team in University from Ministry of Education in China (Grant No. IRT0805) and the Beijing Nova Program (2007B016).