
Abstract
The mechanical properties of aluminium alloys with non-equilibrium microstructures necessary for heat treatment simulation are not available. Therefore, compression tests of undercooled aluminium alloys such as AlSi1MgMn and AlZn4·5Mg1 have been performed in a quenching and deformation dilatometer with varying quenching rates and quenching finish temperatures. The compressive load on quenching finish temperature was applied immediately after quenching. The mechanical properties such as yield strength and strain hardening are strongly dependent on quenching rates and finish temperatures of quenching. Flow curves depending on quenching rates and quenching finish temperatures have been implemented in a quenching simulation by the finite element method. For the cooling process of extrusion profiles in water and in a gas nozzle field, the simulation results are presented.
Introduction
Aluminium alloys achieve their high strength by the heat treatment process of age hardening. Age hardening includes the three steps of solution annealing, quenching and aging. During quenching, a supersaturated solid solution is formed, which is necessary for the following precipitation of strengthening particles during aging. Further, during quenching, thermal gradients occur in components, which can generate residual stresses and distortion. To predict microstructures and properties as well as residual stresses and distortion, heat treatment simulation by the finite element method is a very powerful tool. Therefore, thermophysical properties, precipitation behaviour and mechanical properties of the simulated alloys are required, depending on the temperature and microstructure.1,2 In the case of quenched aluminium alloys, this means properties of undercooled states. The mechanical properties of these non-equilibrium microstructures are not available. Hot tensile tests of aluminium alloys can be performed at relevant temperatures, but their microstructures are near equilibrium and differ from the undercooled state.
Mechanical properties of undercooled aluminium alloys
The precipitation behaviour of aluminium alloys during cooling can be described by continuous cooling precipitation diagrams. These diagrams contain critical cooling rate to suppress all precipitation reactions as well as the temperature range of precipitation and can be recorded by differential scanning calorimetry.3 For the following investigations, the aluminium alloys AlSi1MgMn and AlZn4·5Mg1 have been examined. Table 1 summarises the precipitation behaviour and the dilatometer test parameters.
Precipitation behaviour and dilatometer test parameter of investigated aluminium alloys
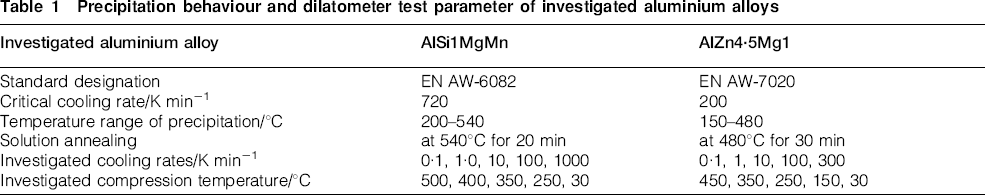
Solution annealing, quenching with different rates on different temperatures and immediate compression testing on quenching finish temperature have been performed in a quenching and deformation dilatometer type Bähr 805 A/D.4 In Table 1, the cooling rates and compression temperatures are given for both alloys. Sample dimensions of Ø5×10 mm, a deformation of 3 mm and a strain rate of 0·1 s−1 have been chosen for these experiments. Except for the lowest cooling rate of 0·1 K min−1, all compression tests have been repeated for a minimum of three times, and their flow curves have been averaged.
Figure 1 shows exemplarily flow curves (true axial stress–log. total strain) of the undercooled aluminium alloys EN AW-6082 and EN AW-7020 for their fastest cooling rate at different quenching finish temperatures. The strength increases with decreasing temperature. In Fig. 2, the flow curves at a quenching finish temperature of 250°C for different cooling rates are given. For the analysed materials, the strength increases with increasing cooling rate. The strength of aluminium alloy EN AW-6082 strongly depends on the cooling rate. Thus, it can be concluded that solid solution strengthening and the possible loss of solute elements during quenching are the main responsible mechanisms. Slower cooling causes a higher loss of solute elements and thereby lower solid solution strengthening.
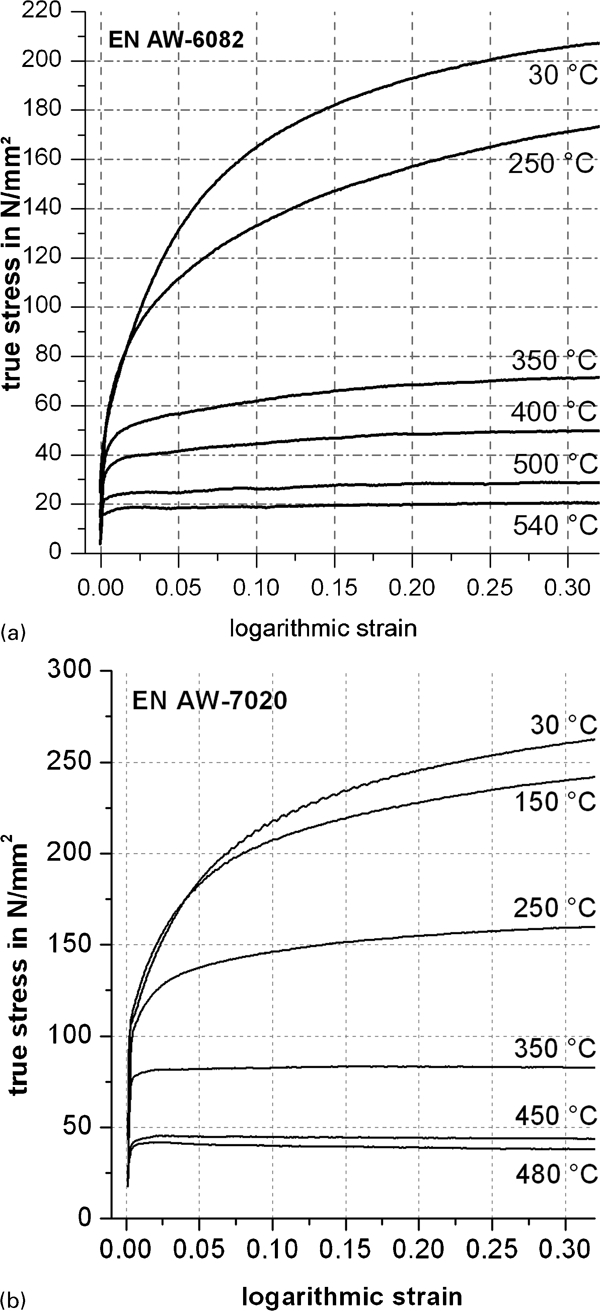
Flow curves at different temperatures:
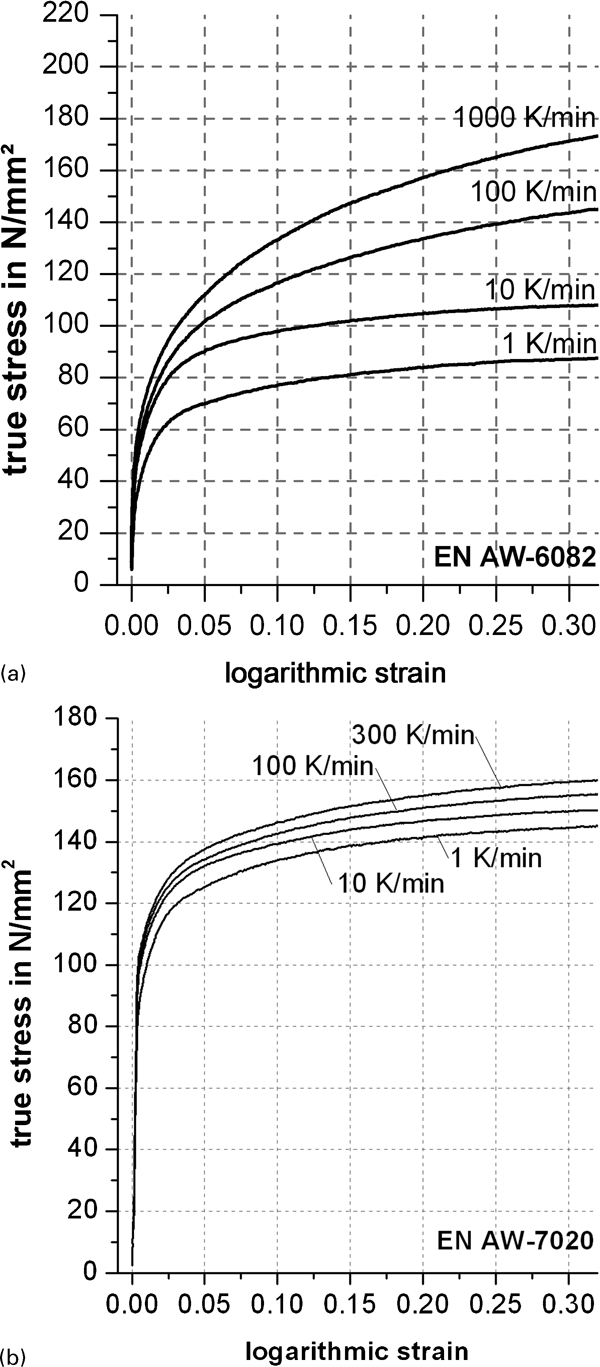
Flow curves for different cooling rates at 250°C
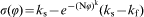
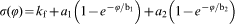
For further evaluation, the yield strength Rp0·2 has been determined depending on the cooling rate and finish temperature of quenching, and the particular elastic deformation has been subtracted from all flow curves. The remaining flow curves (σ = true stress above kf = Rp0·2/φ = log. plastic strain) have been approximated by different mathematical models. The best fit of all different curves for EN AW-6082 has been achieved by the hardening model of Hockett–Sherby
Examples of heat treatment simulation
Two cases, quenching of an L profile of EN AW-6082 in a water bath at 85°C and in a gas nozzle field after solution annealing, are investigated by numerical simulation. The assumed heat transfer coefficients for both cases based on our own experiments with axially symmetric specimens were recorded according to Ref. 5. The numerical simulations are carried out for an L profile consisting of two legs of 2×100 and 24×40 mm in cross-section. The length of the L profile amounted to 400 mm. The simulation of this geometry requires a three-dimensional FE model, which can only use symmetry in axial direction. Therefore, one-half of the L profile length has been simulated. The FE model contains 80 400 solid elements and 25 030 shell elements for boundary conditions. For faster calculation, thermal and mechanical phenomena are decoupled in two simulations using the von Mises yield criteria coupled with an isotropic workhardening.
Results of water quenching
Figure 3a shows the temperature distribution at 0·8 s. This is the moment of maximum temperature difference between two points in the cross-section, i.e. points A and B in the plane of symmetry (Fig. 3b). The difference reaches the temperature of 432°C. The profile needs 9·4 s for complete cooling to 50°C. The highest cooling rate of 3800 K min−1 occurs at 200°C. This is much faster than required and cause needlessly high deformations and thermal stresses. For example residual axial stress values between −150 and 160 MPa and a total deflection of 0·5 mm in the y direction are calculated (Fig. 3c).
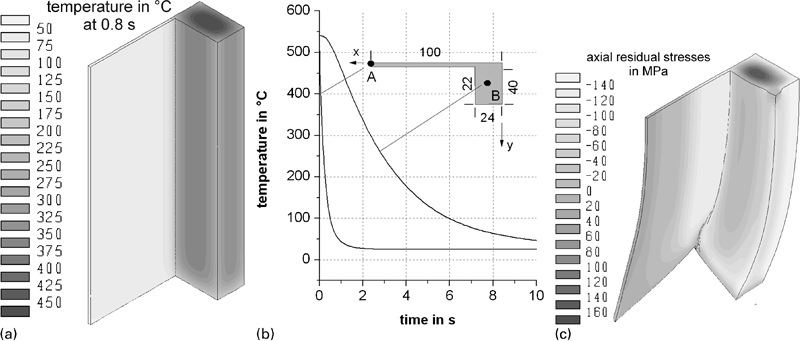
Results of water quenching simulation, one-half of profile length, EN AW-6082
Results of gas quenching
Figure 4 shows the same results of the gas quenching simulation. For this case, the cooling time to 50°C amounts to 58 s, and the maximum temperature difference in the cross-section of 364°C occurs at 6·7 s. Generally, the lower temperature gradient in the thick leg compared to water quenching is obvious. Thus, the deflection of the profile (0·1 mm) and the residual stresses shown in Fig. 4c are smaller. The lowest quenching rate at 200°C is 560 K min−1, point B, and slightly lower than the critical cooling rate of EN AW-6082. However, gas quenching is applicable for thin walled structures made of EN AW-6082.
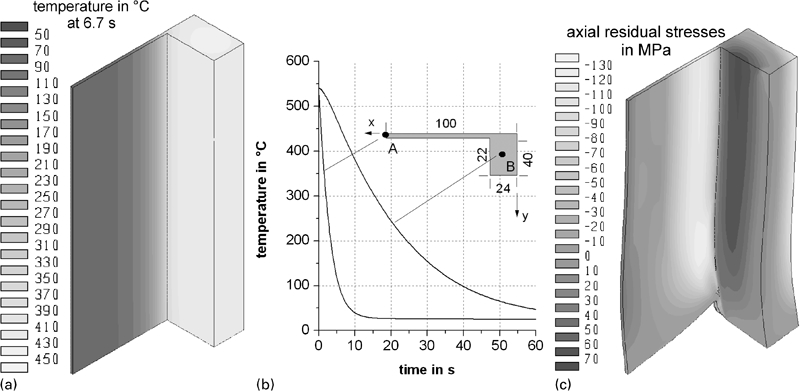
Results of gas quenching simulation, one-half of profile length, EN AW-6082
Conclusions
The quenching and deformation dilatometry have been proven to be a suitable method for the determination of the mechanical properties of undercooled aluminium alloys, depending on cooling rate and temperature. Solid solution strengthening and the possible loss of solute elements during quenching are assumed to be the mainly responsible mechanisms. The dependence of strength on cooling rate is marked for aluminium alloy EN AW-6082. The tests are an expedient basis for the material models used for the calculation of residual stress and distortion by heat treatment simulation.
Footnotes
Acknowledgements
The authors gratefully acknowledge funding of the present work by Deutsche Forschungsgemeinschaft, Forschergruppe 922, project KE616/13-1 as well as funding of the quenching and deformation dilatometer by Deutsche Forschungsgemeinschaft and the State Mecklenburg-Vorpommern (grant no. DFG INST 264/40-1).