
Abstract
The corrosion process of Al–5Zn–0·02In–1Mg–0·05Ti (wt-) alloy was investigated by electrochemical noise. The corroded surfaces of the alloy were observed by scanning electron microscopy. The electrochemical noise data obtained from the corrosion process were analysed using shot noise theory. The pitting and uniform corrosions were confirmed by cumulative probability F [F = (fn)] versus the frequency of events fn. The Weibull probability plots show the three corrosion stages for the alloy: pitting, pitting and dissolution–precipitation and uniform corrosion. The physical model for the corrosion process has been developed.
Introduction
Al–Zn–In–Mg–Ti alloys are gradually becoming popular sacrificial anode materials in industry due to their high current efficiency and easy breakdown of the corrosion product, so the alloys are largely used in cathode protection in seawater.1 The corrosion of aluminium occurs through pitting rather than uniform corrosion. The uniform corrosion is the important target for excellent sacrificial anode materials.2,3 The corrosion behaviour of Al–5Zn–0·02In–1Mg–0·05Ti (wt-) alloy was investigated by electrochemical impedance spectroscopy4 in our previous paper. There exist different corrosion stages of the alloy in 3·5NaCl solution with increasing corrosion time. In the present paper, the corrosion process of the alloy will be investigated by electrochemical noise (EN).
Since the noise data involve information on such stochastic processes as corrosion, they were analysed based upon a stochastic theory: the Weibull probability plot was constructed by fitting the Weibull distribution function to the calculated cumulative probability. Based on shot noise theory, the EN results obtained from the corrosion process were analysed using the Weibull function.
Shot noise theory is based on the assumption that the signals are composed of packets of data departing from a baseline. This theory can be applied to the analysis of EN data in corrosion systems. With the theory, each event q and the frequency of appearance of these events fn can be obtained from the voltage and current noise signals based on the following equations5,6
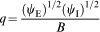

Thus, q gives an indication of the mass of metal lost in the event, while fn provides information about the rate at which these events are happening.7 Therefore, a system undergoing uniform corrosion can have both low chance and high frequency. Localised corrosion, such as pitting, can be characterised by a small number of events and is therefore expected to have low frequency and high chance.8,9
The behaviour of carbon steel immersed in different solutions was studied using EN measurements.10 The solutions employed were intended to provoke different corrosion mechanisms, such as pitting, inhibition and uniform corrosion. In the present paper, shot noise theory has been applied to the analysis of EN signals of Al–5Zn–0·02In–1Mg–0·05Ti (wt-) alloy in NaCl solutions. The systems employed here produced range types of different corrosions, and a physical model for the corrosion of the alloy in NaCl solutions has been developed.
Experimental
Material and specimen preparation
Al–5Zn–0·02In–1Mg–0·05Ti (wt-) alloy was used in the experiment. Samples with the dimension of ¢16×5 mm were washed with acetone and dried. An exposed area of 1 cm2 on the circular surface of the specimen was obtained by covering the rest area with glass glue.
Test methods
The samples of immersion tests were ground with emery paper (grade 400-800-1000-2000) and polished with 2·5 and 1·5 μm diamond pastes. A few samples were immersed in 3·5NaCl solutions in a few beakers at the same time. The samples were taken out from the beakers after immersing in the designed time. The corrosion products of the samples were clean out in a solution of 2CrO3 and 5H3PO4 at 80°C for ∼5 min and then rinsed with ethanol. The corroded surfaces of the samples in 3·5 wtNaCl solution at different immersion times were examined using a JSM-5610LV scanning electron microscope (SEM).
The EN records were obtained using a three-electrode system by a CHI660C electrochemical test system (CHI Company, USA) equipped with EN module. Two identical samples were used as the working electrode, and a saturated calomel electrode was used as the reference electrode respectively.
The EN data of current and voltage were simultaneously recorded for 240 h. Each set of EN records, containing 2048 data points, recorded with a data sampling interval of 0·5 s.
Data analysis
In order to obtain the cumulative probability, the parameter values were sorted in ascending order and derived as n/(N+1), where n is the position of the value in the sorted list, and N is the total number of values (2048 for these experiments). This way of showing the results has been used previously6 and allows one to see clearly the distribution of the values. Hence, the plotted values in this representation can be easily compared.
Results and discussion
Development of corrosion rate of alloy
Figure 1 shows the examples of potential and current records corresponding to the alloy in the 3·5NaCl solution after 72 h of immersion. The EN data analysis in the time domain involves the calculation of the noise resistance Rn. Figure 2 shows the reciprocal of Rn that was proportional to the corrosion rate, which was calculated instantaneously. During the immersion period, the alloy exhibited a higher corrosion rate with larger amplitude fluctuations at the initial stage of immersion, which indicated that the metal surface was undertaking the pit initiation process with high activity. In contrast, the alloy showed a lower corrosion rate with smaller amplitude fluctuations followed by immersion of 10 h and 3 days, which implied low activation.
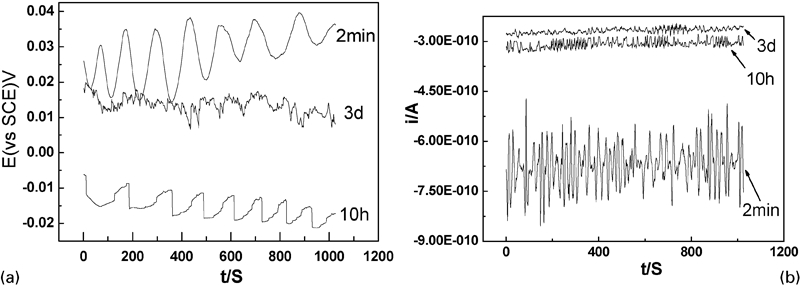
Electrochemical noise pattern of alloy after immersing in 3·5NaCl solutions at different immersion times
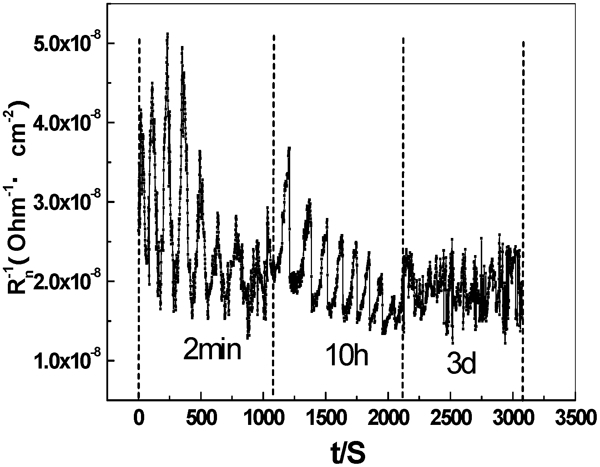
Reciprocal of noise resistance of alloy at different immersion times
Stochastic analysis of EN
Figure 3 presents the cumulative probability plots for fn of the alloy at different immersion times. Some researchers11,12 revealed that fn provided a relatively good discrimination of pitting corrosion, and the distribution of fn shifted to a higher frequency region as the corrosion type changed from pit corrosion to uniform corrosion from the shot noise theory. In Fig. 3, it was observed that the distribution of fn of the alloy at the immersion period shifted to a higher frequency region, indicating that the corrosion type of the material changed from pit corrosion to uniform corrosion.
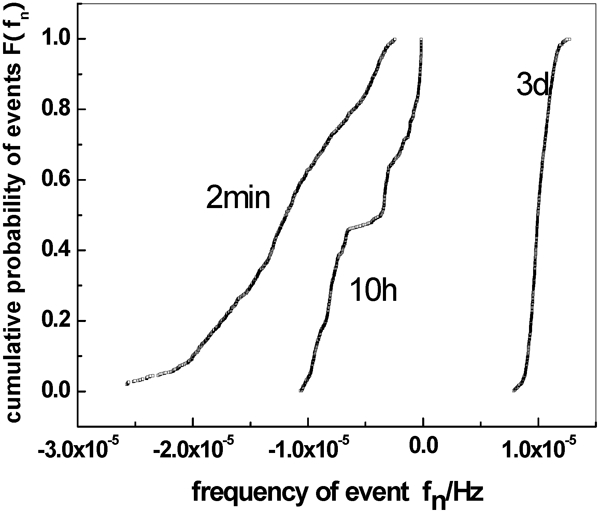
Cumulative probability F(fn) plots for frequency of events fn of alloy at different immersion times
Figure 4 describes the Weibull probability plots  for the alloy at different immersion times. Two straight lines appeared on the plot of the 10 h curve, which indicated the existence of two failure modes. The conditions on the right of the top fitting line were associated with dominant uniform corrosion. On the other hand, the conditions on the left of the bottom fitting line are responsible for the dominant pitting corrosion.

Weibull probability
plots of other alloys at different immersion times
Surface morphology of corroded alloy
The microstructure of the alloy is shown in Fig. 5a. The alloy mainly consisted of the α-Al matrix with precipitates on a continuous or semicontinuous network of grain boundaries. Figure 5b–d shows the typical corroded surface of the alloy at different corrosion times. No corrosion pit can be observed on the original sample in Fig. 5a. After corrosion for 2 min, some pits become distinguishable (Fig. 5b) and originate from the precipitates. After 10 h of immersion (Fig. 5c), special features can be seen, showing a mud structure in the grain due to the dissolution–precipitation of In and Zn ions.4 At up to 3 days of immersion in Fig. 5d, the pits almost spread around the alloy surface, and the mud structure also covers the entire alloy surface.
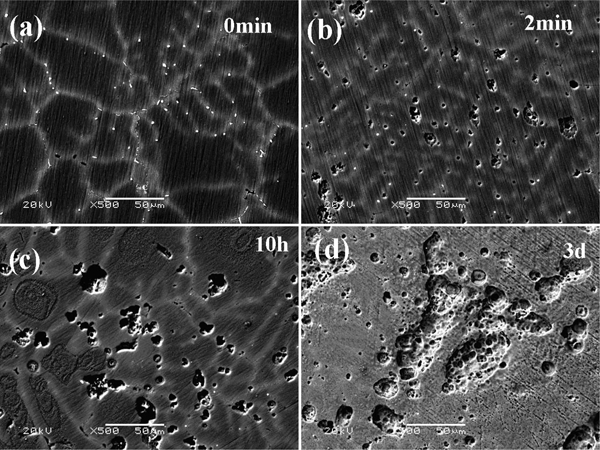
Image (SEM) of Al–5Zn–0·02In–1Mg–0·05Ti (wt-) alloy a before and after immersing in 3·5NaCl solutions for b 2 min, c 10 h and d 3 days
Obviously, the stochastic analysis of EN can be well related to the SEM images (Fig. 5) of the corroded alloys for different immersion times. The corrosion at the initial stage of immersion of the alloy mainly suffered from pitting corrosion. The corrosion type changed from pit corrosion to uniform corrosion with the increase in immersion time.
Corrosion physics model of alloy
From the stochastic analysis of the EN and the examination morphology of corrosion products above, the corrosion process can be partitioned into three stages: pitting, pitting and dissolution–precipitation and uniform corrosion. Based on the corrosion morphology analysis, the pitting that resulted from the precipitate particles mainly predominates the corrosion process at the initial stage of corrosion. Subsequently, the grain dissolves due to the dissolution–precipitation of the In and Zn ions of the alloy. At the later stage of corrosion, the relative uniform corrosion mainly predominates the corrosion process controlled by dissolution–precipitation and pitting.
Thereby, the physical model of the corrosion process of Al–5Zn–0·02In–1Mg–0·05Ti (wt-) alloy in NaCl solution was established in Fig. 6. Figure 6a illustrates the structures on the original sample. Figure 6b incorporates the evolution of local pitting at each particle and the growth of corrosion pit involving interactions with neighbouring particles. Pitting has been shown to initiate at particles, which are either anodic or cathodic relative to the matrix. Then, the mud structure can be seen in the grain, as shown in Fig. 6c. Finally, the mud structure covers all the surfaces of the alloy, and the alloy undergoes uniform corrosion in Fig. 6d. The corrosion model in Fig. 6 reflects the corrosion morphology evolution process of the alloy in Fig. 5: pitting, pitting and dissolution–precipitation and uniform corrosion. With the evolution from pitting to uniform corrosion in Fig. 6, the activity of the alloy decreased gradually in Fig. 2, and the distribution of fn of the alloy shifted to the higher frequency region in Fig. 3. The Weibull probability plots in Fig. 4 also show the three corrosion stages for the alloy, so the model and stochastic analysis have an agreement relationship.
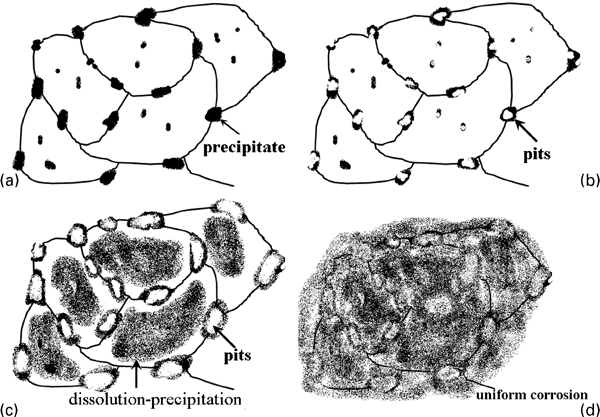
Schematic diagram of corrosion model for Al–5Zn–0·02In–1Mg–0·05Ti alloy
Conclusions
The ENs obtained from Al–5Zn–0·02In–1Mg–0·05Ti (wt-) alloy have been analysed based upon stochastic theory and shot noise theory. The present stochastic analysis of EN differentiates the corrosion stages from the pitting and the uniform corrosion process by the frequency of events. The events in the relatively higher frequency region may be associated with dominant uniform corrosion. On the other hand, the events in the relatively lower frequency regions are responsible for dominant pitting corrosion. The EN and SEM results implied that the alloy has three corrosion stages: pitting, pitting and dissolution–precipitation and uniform corrosion.
Footnotes
Acknowledgements
The present work was supported by the Technology Creative programmer of Henan for Excellent Talents (grant no. 094200510019), the Natural Science Foundation of Henan Province (grant no. 092300410132) and the Young Science Fund of Henan University of Science and Technology (grant no. 2010QN0022).