
Abstract
The crystal plasticity finite element method has been adopted to study the plastic deformation behaviour, such as the slip system activation, the number and magnitude of the actived slip system, the rotation character and the macromechanics response of face centred cubic (fcc) single crystal metal during uniaxial tension. Five typical crystalline orientations, including four types of typical fcc texture orientation: Goss orientation, copper orientation, S orientation and brass texture, have been considered, and its effects to plastic deformation have been studied and compared. The results show that the orientation between crystalline and loading direction will influence the slipping character and the macromechanical response: the S crystalline orientation (60, 32 and 65°) has the least number of active slip system (just only 3); the brass texture (35, 45 and 0°) has the smallest magnitude of crystalline lattice rotation; and the brass texture orientation (35, 45 and 0°) has the highest yield stress value.
Introduction
Metals with face centred cubic (fcc) are widely used for its good plasticity and excellent processability. The plastic deformation mechanism of fcc metal has been widely investigated by numerical method because it is relatively monotonic, i.e. usually just the slipping mechanism needing to be considered. However, it should be noted that the macromechanical properties express obvious variations according to the crystal orientation, loading direction and boundary condition.1–8
Crone et al.4 have studied the orientation dependence of plastic slip near notches in ductile fcc single Cu crystals. Nitta et al.5 paid attention to the effect of plastic anisotropy and latent hardening in three-dimensional single crystals on the formation of shear band. Su et al.7 investigated the texture evolution and non-uniformity in plastic anisotropies of aluminium sheet under tension, compression and shear deformation.
With the development of computing capability and theoretical model, more and more powerful computer simulation methods have been developed and widely used in materials science.9 Recently, a novel method, i.e. crystal plasticity finite element method (CP-FEM), which combines crystallographic slip with the finite element (FE) method, has been developed to investigate the relationship between microscale characteristics (i.e. crystallographic orientation and lattice constants) and macroscale responses (stress, strain field distribution and texture evolution).10
The plastic behaviour and micromechanical response of single crystal fcc metal are very important to study the polycrystalline materials during complex plastic deformation process. As a novel method, CP-FEM is good at solving multiscale problem. In the present paper, the plastic deformation behaviour of fcc metal with five different initial states, including slip system activation, slipping and lattice rotation, macroscale response, stress/strain distribution and crystalline orientation evolution, has been studied by CP-FEM using UMAT11 of ABAQUS software.
The present paper is organised as follows. In the next section, the details of the CP-FEM theory are illustrated. The model set-up, material constants and boundary condition are described in the subsequent section. The simulation results and discussions are presented in the fourth section. The conclusions are drawn in the last section.
General theory of crystal plasticity
The early theory on crystal plastic deformation was studied by Taylor,12 which was mainly based on lattice rotation and slipping. The basic theory was developed and improved by other researchers.13–18
Kinematic equation
In the Cartesian rectangular coordinate system, the deformation at any point can be described by the deformation gradient F, and it can be decomposed into two parts: elastic part Fe and plastic part Fp, as shown in Fig. 1, i.e.


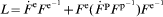
 and
and 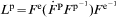 , then

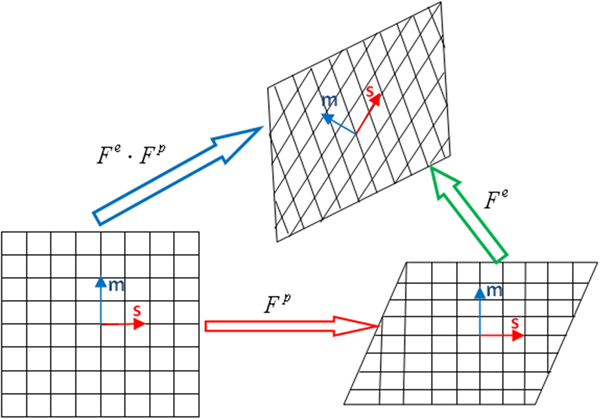
Sketch of elastic–plastic decomposition: plastic slip, rotation and elastic stretch
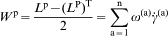
The velocity gradient L can be decomposed into symmetric part D and asymmetric part W


Constitutive law
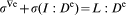
According to Hill and Rice's13 study, when we assume that the crystal's elasticity is unaffected by slipping, the relationship between the elastic deformation rate of lattice De and the Jaumann rate σ∇e of Cauchy stress can be expressed as follows


Hardening model
In the present research, the power law hardening model has been employed. The slipping rate  of the αth slip system in a rate dependent crystalline solid is determined by the corresponding resolved shear stress τ(α) as
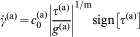
 is the reference strain rate on slip system α, g(a) is a variable that describes the current strain hardening of that slip system and m is the strain rate sensitivity exponent.
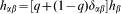
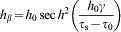
The stain hardening rate is calculated by the following equation

Crystal plasticity FE method and model set-up
Crystal plasticity FE method
In the present work, the crystal plasticity theory described in part 2 has been coded in FORTRAN language and coupled with the commercial FEM software ABAQUS/standard by means of the user subroutines ‘UMAT’.
Materials model and constant
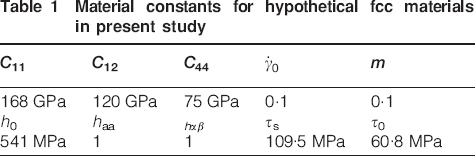
As previously stated, we mainly focus on the crystalline orientation, boundary condition effects, slipping system activation and macromechanical response during the uniaxial tension deforming process, so a hypothetical fcc material that is based on pure copper is introduced in the present work. The material constants of the CP-FEM model are shown in Table 1.19
Material constants for hypothetical fcc materials in present study

ABAQUS/CAE model
A 10×10×10 μm cubic model has been built (Fig. 2). The cubic is meshed by a 2×2×2 grid, and the C3D8R element is adopted. The boundary condition at the bottom surface is as follows: U2 = UR1 = UR3 = 0. The reference point (RP) at (0, 15, 0) position was introduced into the FE model to facilitate load, boundary condition fixing and result analysing. According to the property of different coupling types11 and current studying, the distributing coupling was adopted to connect the RP and FE model. The boundary and load on the RP is U2 = 5 μm and UR1 = UR3 = 0.
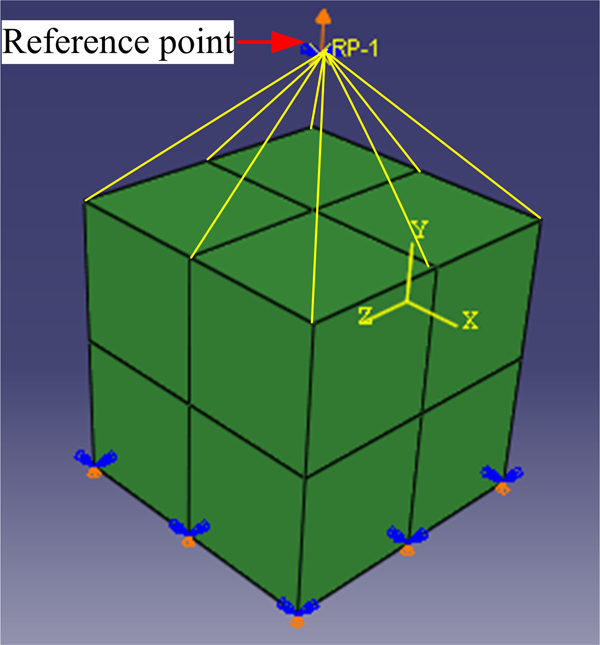
Cubic model in ABAQUS/CAE window
The five types of situations (Goss, copper, S and brass texture orientation) has been built up to study the crystalline orientation effects, as shown in Fig. 3.
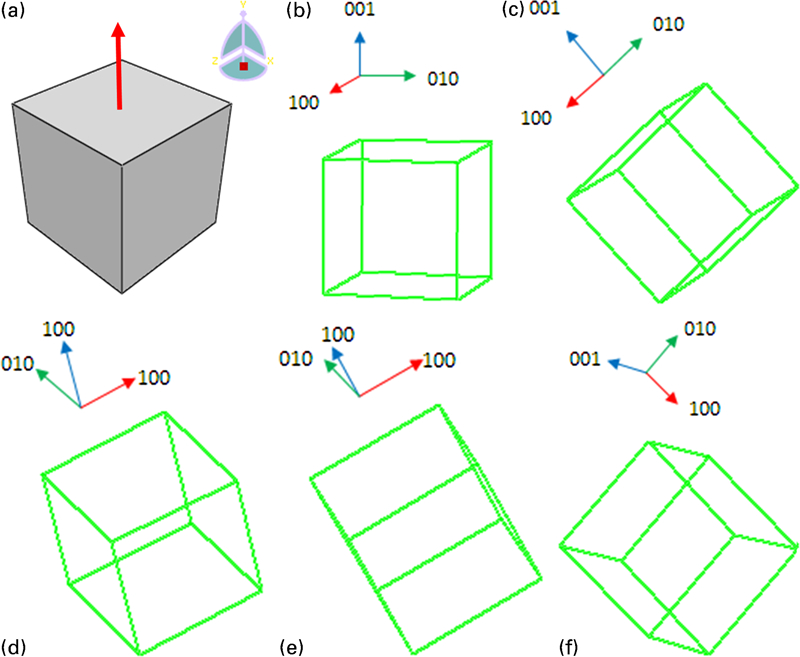
Schematic diagram of relationship between crystal orientation and load direction, represented by Euler angle: a specimen and coordinate, b (0°, 0°, 0°), c (0°, 45°, 0°), d (90°, 35°, 45°), e (60°, 32°, 65°) and f (35°, 45°, 0°)
Results and discussion
Deformation and rotation
According to the crystal plasticity theory in the section on ‘General theory of crystal plasticity’, plastic deformation was based on lattice rotation and slipping. In this presentation, the rotation angle of the cubic model relative to the initial state represents an accumulation of lattice rotation. The rotation angle along the Y axis was calculated by CP-FEM subroutine and exported from the calculation results at RP with 0·5 tensile strains. The shape deformation and rotation angle are shown in Fig. 4. One can see that the pillar-like sample shows not only elongation in the loading direction but also rotation with different angles: 2·76, 6·06, −1·43, −3·68 and −4·68° (anticlockwise denoted by ‘+’).
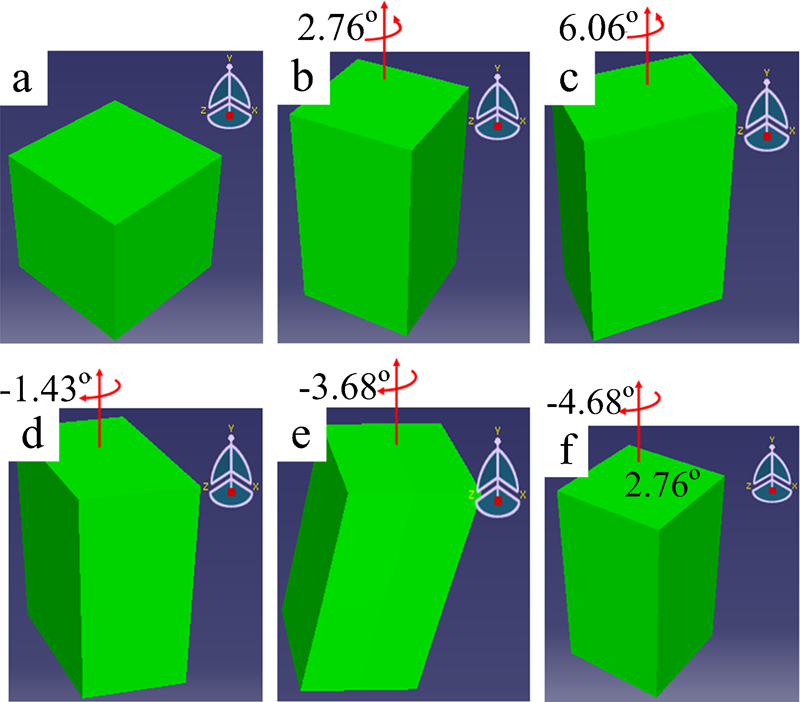
Shape deformation and rotation of cubic model after tensile deformation, strain rate of 0·001 S − 1 and strain of 0·5: a initial state, b (0°, 0°, 0°), c (0°, 45°, 0°), d (90°, 30°, 45°), e (60°, 32°, 65°) and f (35°, 45°, 0°)
The von Mises stress distribution is given in Fig. 5: in situations a, b and c, the stress field is homogeneous although its magnitude is different. However, the stress filed is heterogeneous in the other situation, especially situation d, which keeps the S orientation (φ1 = 60°, φ = 32° and φ2 = 65°) relationship between the crystal orientation and the load direction. The reason will be analysed completely in the later section.
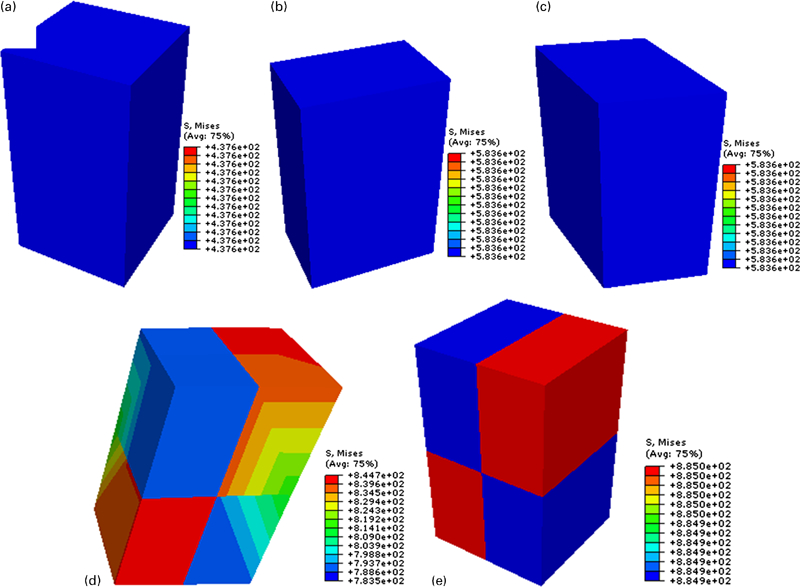
von Mises stress distribution at 0·5 and 0·001 S − 1: a (0°, 0°, 0°), b (0°, 45°, 0°), c (90°, 30°, 45°) homogeneous stress distribution, d (60°, 32°, 65°) and e (35°, 45°, 0°) extremely heterogeneous
The stress–strain curves are plotted in Fig. 6. The curves have the similar shape but different yield stress/strain points. It is worth to paying attention to the yield stress value at different initial situations: when the [001] direction (crystal orientation) is parallel to the Z direction (load direction), seeing Fig. 3b, the yield stress is only 410 MPa; however, for the ‘brass orientation’ relationship, the value of yield stress increases to 855 MPa. The other conditions show the yield stress value between them. Particularly, when they keep the ‘Goss orientation’ and ‘copper orientation’, they have almost the same stress–strain curves.
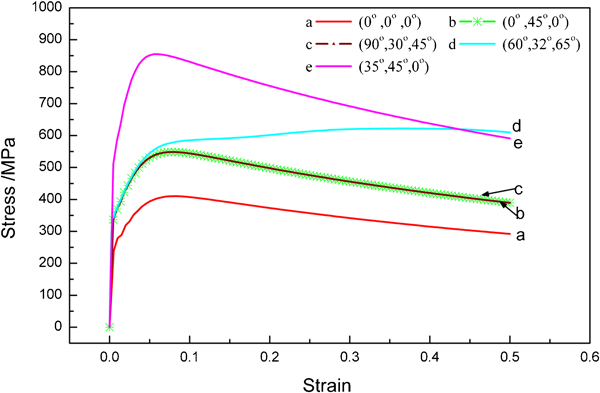
Stress–strain curves with different initial situations: relationship between crystal orientation and load direction
Crystal slip and rotation
In order to describe slip system activation, the shear strains in each slip system with different initial states have been investigated, as shown in Fig. 7.
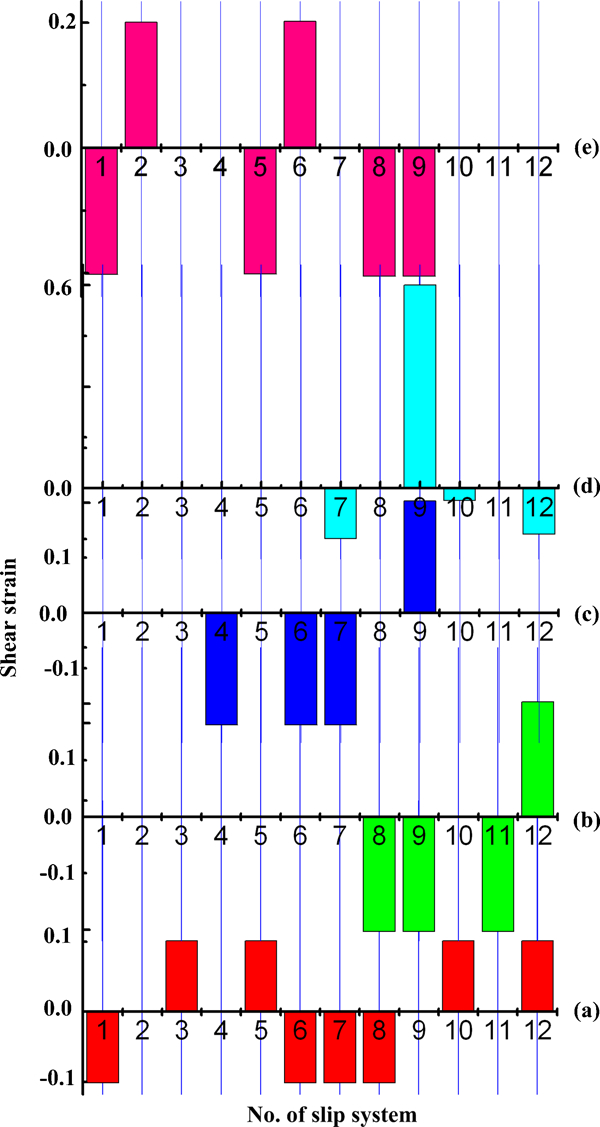
Shear strains in each slip system with different initial states at 0·4 strain: a (0°, 0°, 0°), b (0°, 45°, 0°), c (90°, 30°, 45°), d (60°, 32°, 65°) and e (35°, 45°, 0°). Corresponding slip system in horizontal axes: 1, (1 1 1)[0 −1 1 ]; 2, (1 1 1)[ 1 0 −1 ];3, (1 1 1) [ −1 1 0 ]; 4, (−1 1 1)[1 0 1 ]; 5, (−1 1 1) [1 1 0]; 6, (−1 1 1)[0 −1 1]; 7, (1 −1 1)[0 1 1]; 8, (1 −1 1)[1 1 0]; 9, (1 −1 1) [1 0 −1]; 10 (1 1 −1) [0 1 1]; 11, (1 1 −1) [1 0 1]; 12, (1 1 −1) [−1 1 0]
In situation a, there are eight slip systems that have been actived, and the number of positive and negative directions is just equivalent: 4 and 4.
In situations b and c, they have similar actived slip system results; only four slip systems have been actived in total: three slip systems in the negative direction and one in the positive direction.
In situation d, the shear strain distribution is very special: not only the numbers of slip system with positive and negative directions are different but also the magnitude of the shear strain is various. This may lead to the cubic model large deformation and non-uniform distribution of von Mises stress (Fig. 5d).
The last situation e, obviously, has the character that is contained in situations a, b, c and d. First, the numbers of active slip system are relatively large (the number is 6). Second, the shear strain shows a large magnitude (compared with Fig. 7a) and a homogenous distribution (compared with Fig. 7d). Therefore, as the results shown in Fig. 6, situation e has the highest yield strength.
The crystalline lattice orientation evolution is given in Fig. 8. In situation e, the crystalline direction just rotates with a small angle during the whole plastic deformation process. It means that the crystalline lattice is difficult to rotate when the crystalline direction and load direction keep the brass texture orientation relationship. In addition, it also leads to the highest yield strength.
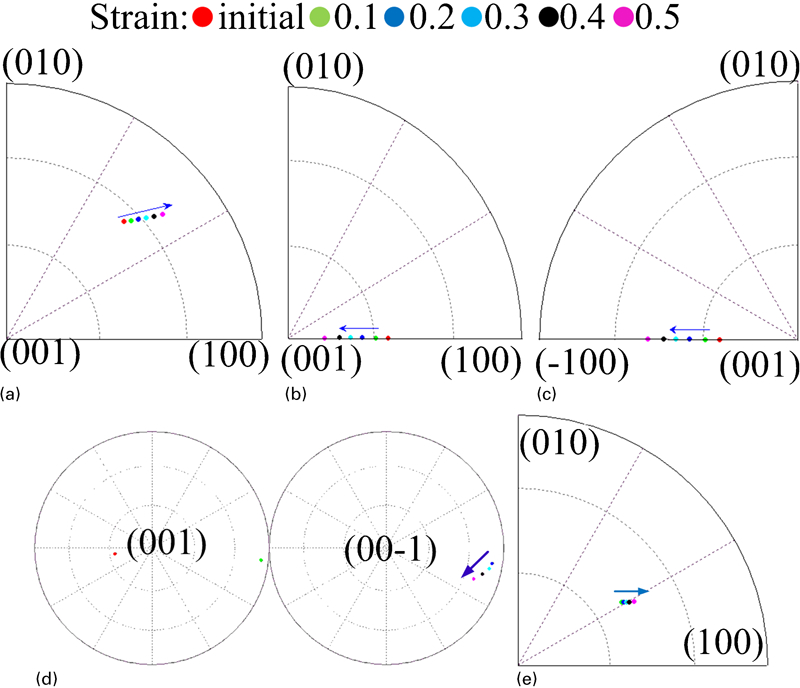
Crystalline direction (111) rotation trace during tensile deformation process under different initial situations: a (0°, 0°, 0°), b (0°, 45°, 0°), c (90°, 30°, 45°), d (60°, 32°, 65°) and e (35°, 45°, 0°)
Conclusions
The slip system activation, the magnitude and direction of shear strain in different slip systems and the crystalline orientation evolution in different situations have been studied. The following conclusions could be drawn.
The orientation relationship between crystalline and load direction will affect the slip system activation situation. It will affect not only the slip system activation time but also the numbers of slip system and degree of slipping.
The orientation relationship between crystalline and load direction will affect the crystalline lattice rotation.
The number of activated slip system will affect the yield stress of crystalline materials.
The extent of slipping system activation and crystalline lattice rotation will affect the yield stress of crystalline materials.