
Abstract
The present paper describes the mathematical development and validation of a comprehensive stochastic model capable of predicting at the mesoscopic level the solidification structure, Laves, and NbC phases in superalloy ingots processed by vacuum arc remelting (VAR) technology. The multiscale modelling approach consists of a coupling between a fully transient deterministic macroscopic code and a stochastic mesoscopic solidification structure code. Predictions from the model were validated against experimental measurements. Multiscale model predictions are compared against a commercial size VAR ingot.
Keywords
Introduction
The main objective of the present work is to develop a multiscale modelling approach to get insight into the effect of processing parameters on the cast micro- and macrostructure in vacuum arc remelting (VAR) processed 718 ingots. The developed model can assist in achieving better control of the ingot solidification structure and establishing trends in the macrosegregation in these ingots. Another objective of the present work is to analyse the effects of production rate and ingot size on the resultant ingot microstructures. This objective was met by first understanding the effects of the full range of processing parameters typically used in the VAR process. Processing parameters such as power input and heat extraction rate significantly influence the ingot liquid pool size and shape as well as the ingot structure, which in turn will greatly impact the final ingot quality.
The capabilities of the developed model include the effects of process parameters, such as casting rate, power input, mould cooling conditions and ingot size, on the ingot structure at both macroscopic and microscopic levels. At the macroscopic level, grain size, grain morphology (dendritic columnar or equiaxed), grain direction and columnar to equiaxed transition (CET) can be predicted. At the microscopic level, the size and amount of secondary phases, such as carbides and Laves phases, can be simulated. Other capabilities of the developed model include the capability to analyse the effects of melt transients typically observed in the VAR process.
Vacuum arc remelting process and multiscale modelling approach description
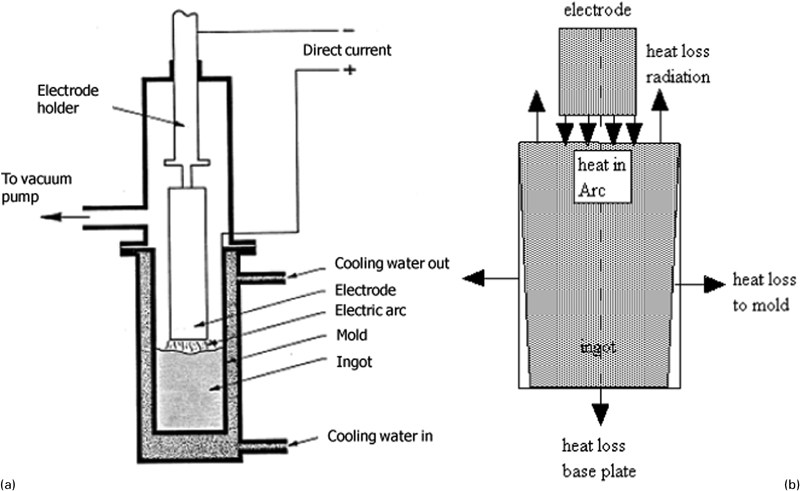
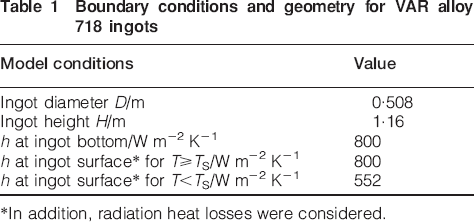
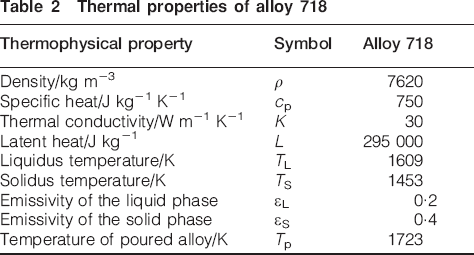
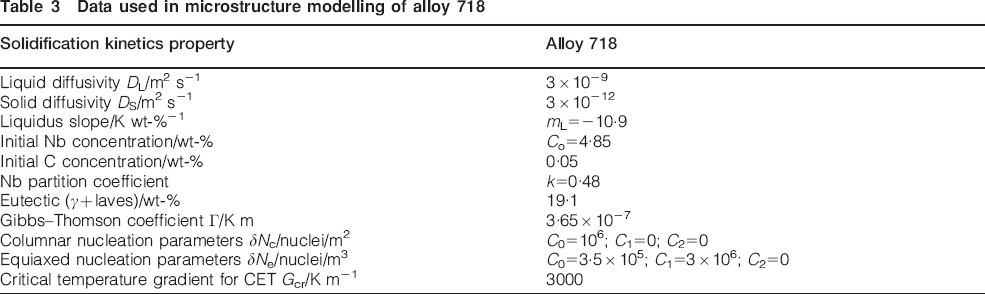
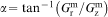
The VAR process is illustrated in Fig. 1a. The longitudinal cross-section of a VAR processed ingot and the heat losses from the ingot are illustrated in Fig. 1b. Figure 2 presents a schematic diagram showing the coupling between the Specialty Metals Processing Consortium (SMPC) deterministic code1,2 and the ingot solidification structure stochastic code called MESOS. Boundary conditions and ingot dimensions are given in Table 1, where h is the heat transfer coefficient. Control parameters of the VAR process, such as power input, melting rate, casting speed and heat flux at the ingot top, are typical for processing 718 ingots. The thermal properties of the materials used in the simulations are presented in Table 2, and the data used in the stochastic model are shown in Table 3. The casting speed Vcast is calculated with 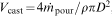 , where
  is the mass melting rate, ρ is the solid density and D is the ingot diameter. The present stochastic mesoscopic approach differs from the classical ‘Cellular Automata’ technique7 in that it uses thermal history results from a macroscopic deterministic model. It is also based upon a Monte Carlo (MC) probabilistic approach required to calculate microscopic quantities.3 A stochastic model for grain structure evolution includes nucleation and growth kinetics as well as the growth anisotropy and grain selection mechanisms (see the model details in Appendix). The required input data for stochastic calculations are provided by the macroscopic model and include the following:
a schematic of VAR process and b longitudinal cross-section through VAR processed ingot
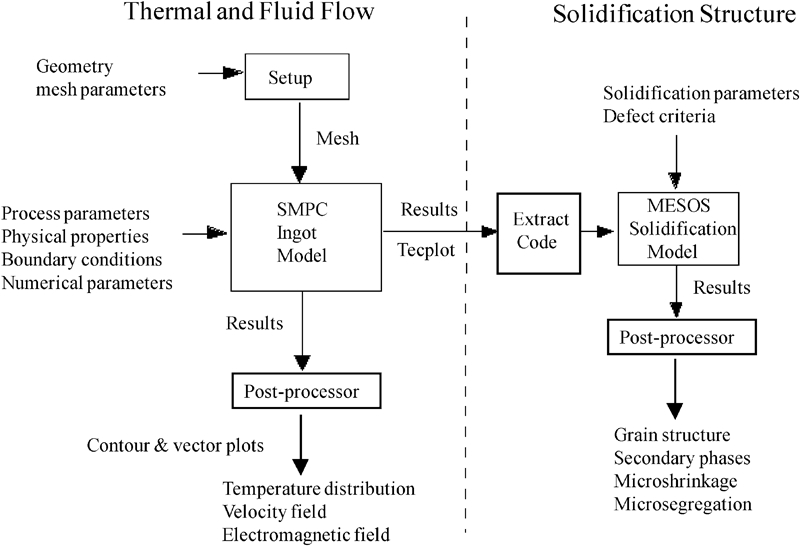
Diagram showing coupling between SMPC and MESOS solidification structure codes
Boundary conditions and geometry for VAR alloy 718 ingots
*In addition, radiation heat losses were considered.
Thermal properties of alloy 718
Data used in microstructure modelling of alloy 718
local cooling rates calculated at the liquidus and solidus temperatures
time dependent temperature gradients in the mushy zone also calculated at the liquidus and solidus temperatures
local solidification start and end time.
Local cooling rates calculated at the liquidus temperature are used to compute the nucleation parameters. Local average cooling rates and time dependent temperature gradients in the mushy zone are used to compute the grain growth parameters.
During solidification of these continuously cast ingots, at least three grain morphologies are encountered: equiaxed grains, columnar grains solidified under a variable G/V ratio and columnar grains solidified under a relatively constant G/V ratio, where G and V are the local temperature gradient and solid/liquid (S/L) interface velocity of the mushy region respectively. All the aforementioned morphologies as well as the CET are driven more or less by the same solidification mechanism, that is, the nucleation and growth competition of various phases in the mushy region.
The stochastic mesoscopic models for equiaxed and columnar grains solidified under a variable G/V ratio are given in Appendix. The columnar structure solidified under a relatively constant G/V ratio, which is perhaps the most common morphology met during primary melting or secondary remelting, is described in the following paragraphs.
The stochastic tracking of the columnar interface at the mesoscopic level, a specially designed capability to model the VAR ingot grain structure, assumes that, at the columnar front, the growth velocity is equal to the interface velocity of the dendrite tip at the same location.3 For a two-dimensional (2D) axisymmetric domain, the position of the columnar front (Zc, Rc) at time t+δt can be iteratively computed by

 . Here, Vc is computed with
 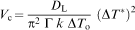 ,
,  and
and  and
and  are the local temperature gradients in the mushy zone in the z and r directions respectively. Here, DL is the liquid diffusivity, Γ is the Gibbs–Thomson coefficient, k is the partition ratio, ΔTo is the solidification interval, ΔT* is the S/L interface undercooling and
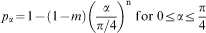
  is the actual cooling rate. Since a square mesh is used in the present stochastic approach, a selective randomisation procedure was developed to impose the primary growth direction α of the columnar grains normal to the S/L interface. This is based on the fact that columnar grains will grow only when the randomly generated number rand (0≤rand≤1) is smaller than the growth direction probability pα defined as
A special ‘extract’ code was developed to make this coupling possible. The extract code computes and transfers all the information needed for the MESOS code, including mushy zone thermal gradients, cooling rates and solidification time. As shown in Fig. 2, the SMPC code performs energy, momentum and electromagnetic computations to obtain temperature, velocity and electromagnetic fields in the VAR ingot. Then, based on the macroscopic temperature and flow distribution computed by the SMPC code, the MESOS code computes the ingot solidification microstructure.
Results and discussion
Figure 3 shows the temperature profile and flow pattern in a 20 in diameter VAR processed 718 ingot that has reached the steady state regime. A comparison between predictions and experimental measurements for secondary dendrite arm spacing (SDAS) is shown in Fig. 4. The predicted SDAS matches the experimental measurements well. The cooling rate  and the SDAS are calculated with the following equations
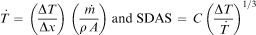
 is the melting rate, ρ is the density, A is the ingot cross-sectional area and C is a material constant.
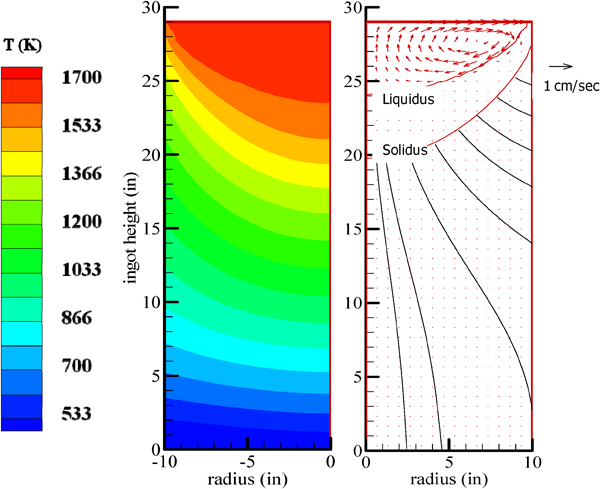
Simulated temperature profile and flow pattern in 20 in 718 VAR ingot (steady state regime): ingot dimensions in inches (×25·4 mm)
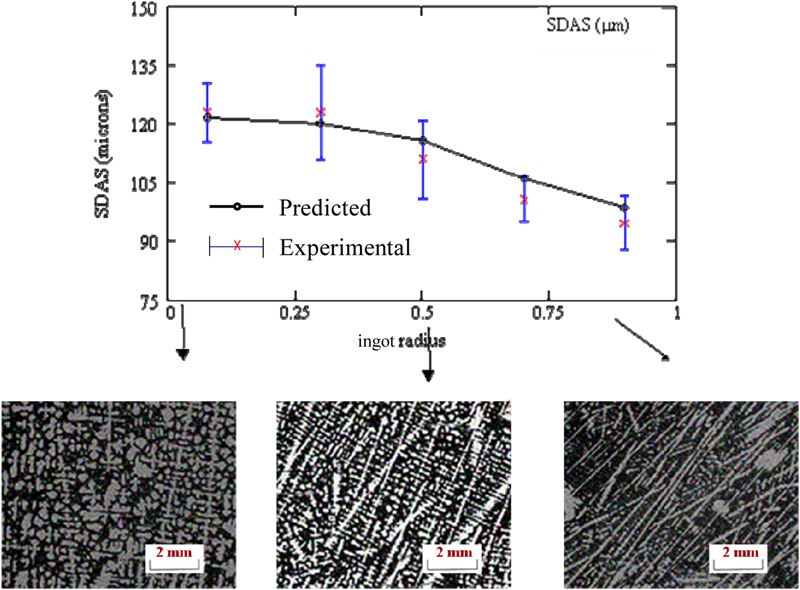
Comparison between numerical predictions and experimental measurements for SDAS in 20 in 718 VAR ingot [x axis is scaled: 0–10 in (254 mm)]
A comparison between the simulated and experimental solidification structures in a 20 in 718 VAR ingot is presented in Fig. 5. The computed columnar grain size and its direction match with the experimental data well. The macrostructures obtained during the standard power-off procedure (e.g. standard hot top) and with a controlled power and melting rate (e.g. improved hot top) cases are presented in Fig. 6a and b respectively. In Fig. 6b, the optimised current and melt rate prevented nucleation and growth of dendrites from the ingot top and the CET formation, and therefore, the last region to solidify was at the ingot top. Thus, the ingot yield was maximised. The simulated macrostructures in Fig. 6b compare favourably well with the experimental macrostructures.
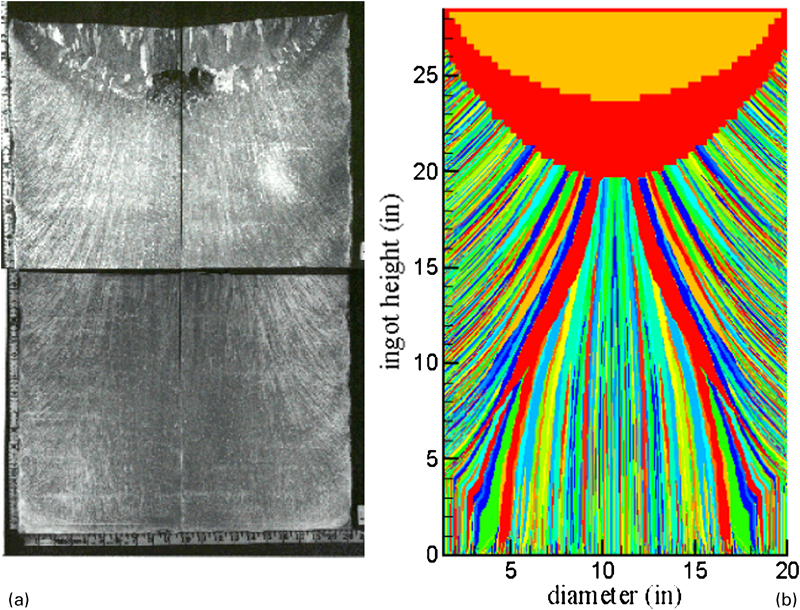
Comparison between simulated and experimental solidification macrostructures in 20 in 718 VAR ingots: ingot dimensions in inches (×25·4 mm)
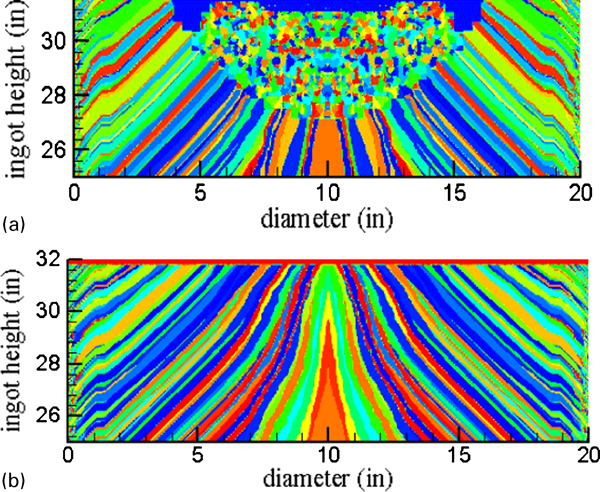
Predicted macrostructures for 20 in 718 VAR ingots: ingot dimensions in inches (×25·4 mm)
A complete representation of the secondary phases (e.g. Laves and NbC phases) in as cast alloy 718, showing their morphology, size, amount and distribution, is presented in Fig. 7. A probabilistic model based on a novel MC technique (see theory in Refs. 3 and 5) was used to predict the microsegregation of Nb at the level of secondary arm spacing (Fig. 7b) and the distribution of secondary phases (Fig. 7c and d). The use of a probabilistic MC technique was required because of both the size and the complexity of the microstructure in Fig. 7a. Both NbC and Laves phases are distributed proximal to the interdendritic region. The simulated results in Fig. 7b–d compared well with the experimental as cast microstructure (Fig. 7a).6
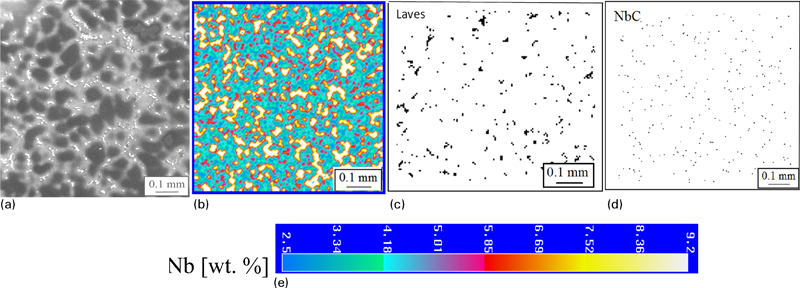
Comparison between simulated and experimental solidification microstructures in as cast alloy 718
Conclusions
A multiscale modelling approach was developed by coupling the SMPC and MESOS codes. The coupled multiscale model was applied to simulate the microstructure evolution during solidification of VAR alloy 718 ingots. The simulated pool profiles and solidification structure reasonably matched the experimental data for VAR 718 ingots. The solidification structure simulation software was then used to optimise the VAR 718 ingot structures during hot top operations and to better control the formation of Laves and NbC phases in alloy 718.
Footnotes
Acknowledgements
The author would like to acknowledge the Carpenter Technology Corporation for sponsoring the present research programme and Dr A. Patel for his useful comments in writing the present article.