
Abstract
The present work is concerned with the ability of the incremental melting and solidification process to be used in a controlled way to produce functionally graded materials in industrial environments. For this purpose, the influence of the main process parameters, namely relative mould/coil rate and melt temperature, is evaluated in relation to the obtained final component chemical composition gradient. Several graded components of Cu–Sn alloys were produced. The effect of the process parameters on the final component gradient was quantified. It was verified that both the melt temperature and the relative mould/coil rate play a similar role in final component chemical composition gradient. Predictive equations for the gradient, namely the extension of chemical composition gradient zones, are proposed based on the two studied variables.
Keywords
Introduction
Functionally graded materials (FGMs) is a promising area. As a fact, there are numerous ‘natural components’ ‘made’ with a graded composition. Bones, tooth, leafs, wood, etc.1 are few examples that demonstrate that many components should have different properties in different parts of the component. Thus, FGMs could be understood as bio inspired materials.1
An example of a possible application of FGMs is engine pistons. The top part of the piston requires high thermal mechanical and fatigue properties, while the piston rings area requires high mechanical and wear resistance properties, and the skirt area requires mainly a high thermal conductivity material.2 Many other engine components such as intake and exhaust valves, turbine blades, etc. are exposed to very different local in service demands, either mechanical, thermal, physical or environmental, requiring then local specific properties.
In an effort to follow these lessons from nature, some different FGM processing methods were developed.3–7 Among those methods is the incremental melting and solidification process (IMSP). The IMSP is a relatively new production technique that is able to produce FGMs in a single step.4–5,7 As well as many other FGM processing techniques, perhaps the main drawback of the processes is the relatively low level of development that makes them expensive and useful only at laboratory level. The purpose of the present paper is to give a step forward on the understanding of the influence of the processing variables of the IMSP in the final component chemical composition gradation. The influence of two important variables (melt temperature and relative mould/coil rate) on the ability to control the chemical composition gradient in Cu–Sn alloys will be evaluated. As explained by Silva,7 the operation principle of the IMSP can be described as follows: different materials are continuously fed to the mould and are melt by induction heating, while at the bottom of the mould, the materials are solidified because this mould region is water cooled.4,5 This procedure originates gradual melting at the top of the casting and solidification at the bottom of the casting. The IMSP proceeds from the bottom to the top of the mould by changing the relative position between the mould and the heating apparatus (induction coil). Some previous studies with this technique were performed by Mazare et al.4,5 A somewhat similar process to produce FGMs was presented by Midson and Browne.8 In Midson and Browne's process, called cant–decant–cast method, there is a sequential addition of different alloys to the mould, with the possibility of obtaining 3D shape components. With some thermal management, it is possible to have some control of the transition zones among different alloys, although this transition control is very limited, and it is restricted to transition zone extension of a few millimetres.
The IMSP seems to be very promising because it allows the possibility of having local controlled properties in a single component with large transition zones. It is known that sharp transitions, on dissimilar material components, may be the source of high thermal induced residual stresses and other mechanical and metallurgical detrimental features that reduce the component performance (for example, the fatigue properties). The IMSP allows the production of components with a smooth chemical composition transition between dissimilar materials. These interface regions or transition zones might have extensions in the order of hundreds of micrometres to tens of millimetres, if necessary. This gradual transition between materials allows for a smoother gradient in either metallurgical or mechanical properties of the materials and consequently produces components with an increased mechanical performance. It is necessary, then, to understand how the process parameters affect the final chemical composition gradient along the component. This is fundamental to control the metallurgical, mechanical and/or other properties evolution throughout the component.
The present paper is concerned with the ability to control gradient zone extension by changing the relative mould/coil rate (from now on in the present paper just referred as mould rate) and/or melt temperature at the new material addition time (from now on in the present paper just referred as melt temperature) in the production of functionally graded Cu–Sn alloys.
It will be shown that the IMSP can produce FGMs in a controllable and reproducible way even for alloys with complex transformations on solidification and on solid state. The process can be well controlled by the correct selection of process parameters.
Materials and methods
Materials
The experimental tests were performed with two different materials: pure copper (99·9 wt-) and Cu–Sn alloy (40 wt-Sn).9 The obtained components will shift from pure copper in one side to a Cu–Sn alloy in the other side (Fig. 1a).
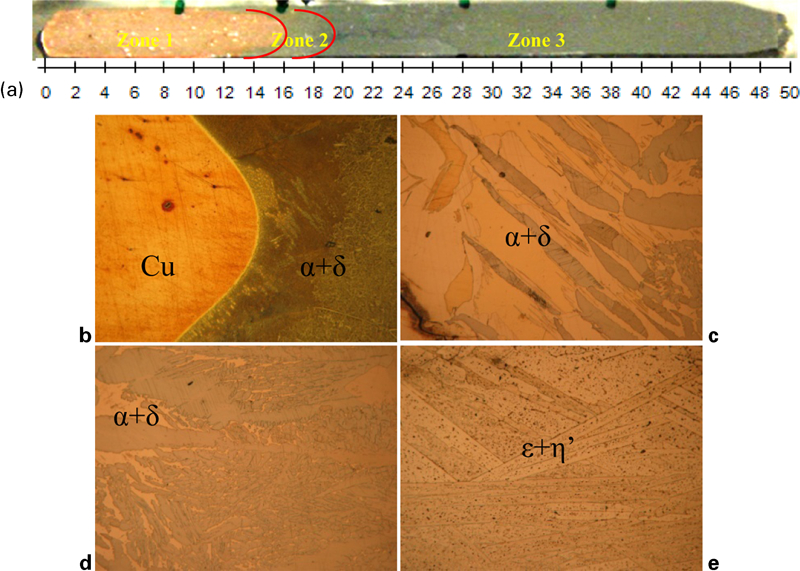
a final aspect of obtained components (experiment no. 7 in Table 1) and b–e details of sequential transition zones and constituents between left part (pure copper) and right part (Sn rich part)
This system with a gradient from Cu to a Cu–Sn alloy was selected intentionally for the present study because it has a complex metallurgical system, with a huge difference on melting temperatures and several solid state transformations (Fig. 2). The aim was to assess the influence of the processing variables on the obtained final gradients on complex systems. Once it works for complex systems, it should work for simpler systems.
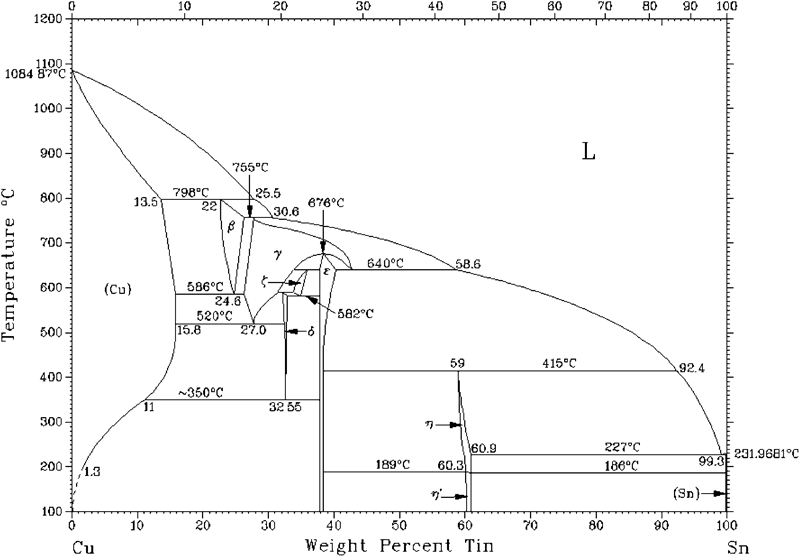
Cu–Sn phase diagram9
The experimental tests were performed using a home developed apparatus for the production of graded components with the IMSP.4,5,7
Methods
The graded material castings were performed in an induction furnace, of 50–450 kHz, 5 kW from Ameritherm, using the IMSP.4,5 This method is schematically shown in Fig. 3: a mould moves inside an induction coil (fixed), with a controlled dislocation rate, and the materials are introduced according to a previously selected sequence in order to produce the intended chemical composition gradient. The bottom of the mould is water cooled in order to promote a substantial temperature gradient between the bottom and the top of the mould. This temperature gradient permits the material inside the mould that is near the bottom to solidify while the material at the top (at the level of the induction coil) is liquid. A thin specimen with 6 mm diameter was used in order to minimise the differences in component radial direction. These differences in radial direction of the specimens may occur due to the current penetration and the magnetic field direction and will not be studied in the present paper.10
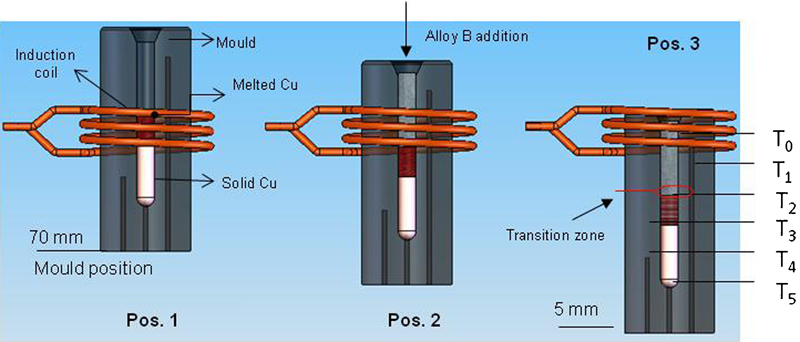
The experiments were conducted in the following way. Solid pure copper (∼8 g) was added to the mould with the induction coil positioned at the bottom level of the mould. Heating was turned on, and when Cu was liquid, the mould started moving downwards (position 1 in Figs. 3 and 4). When a selected melt temperature was reached on position 2 of the mould, ∼8 g of alloy B was added to the melt (position 2 in Fig. 3) (alloy B was added in the liquid state at a temperature a little above its solidus temperature). It must be emphasised that when alloy B was added to the melt, only a portion of the material inside the melt was liquid (the top part). The remaining material was already solid (the bottom part) (Fig. 3). Alloy B will mixed with the liquid at the top part of the mould (pure copper with alloy B), and some diffusion of Sn from the liquid to the solid copper also occurred. Concerning the liquid phase, a complex process of solidification took place according to the equilibrium phase diagram and local process parameters (cooling rate, temperature and chemical composition gradients).
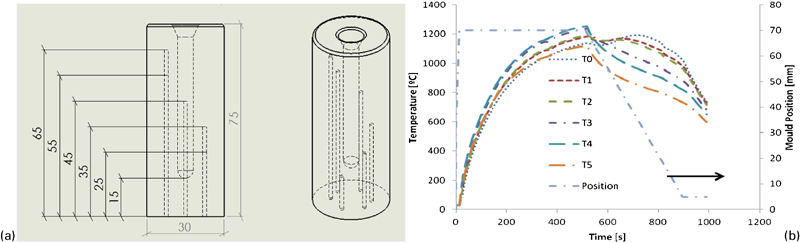
a mould geometry with thermocouple position (in mm) and b typical temperature curves profiles along mould obtained during imposed thermal cycles in one production cycle
The melt temperature when alloy B was poured into the melt is presented in Table 1 for each experiment.
Experimental conditions: mould rate, temperature profile at mould at alloy B addition time*
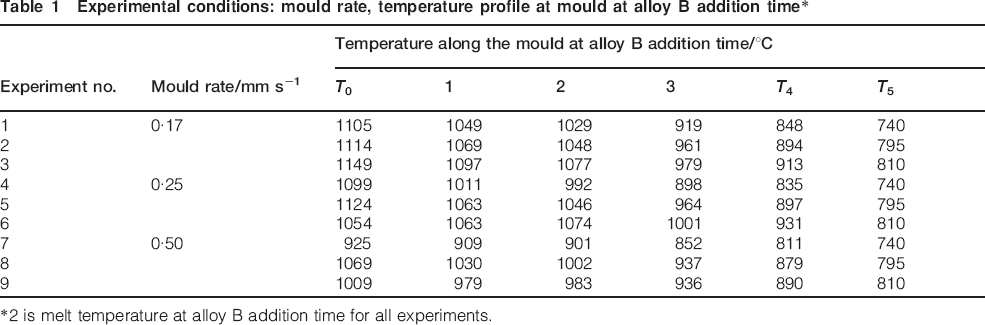
*2 is melt temperature at alloy B addition time for all experiments.
The FGMs were obtained with three different mould rates and three different melt temperatures, of the liquid top part of the mould, for each rate. The tested experimental conditions are presented in Table 1. In each experiment, six thermocouples (Fig. 3b) allow the reading of the temperature along the mould and the control of the addition time/temperature of the new material (alloy B).
The obtained microstructures and chemical composition along the components were determined by scanning electron microscopy/energy dispersive spectroscopy. Local mean chemical composition was determined by energy dispersive spectroscopy.
Results and discussion
In each and all tested conditions, a chemical composition graded component was obtained. The component solidification sequence, using the IMSP, is complex and dependent on the imposed process parameters. In the present work, the mould rate and melt temperature were assessed. The change in the mould rate and/or melt temperature causes a different contact time or stage between alloy B (in the liquid state) and liquid copper (upper part of the initial pure copper piece). This difference changes the element distribution between the two base materials (in liquid or solid/liquid zones), namely the amount of Sn content on the component bottom part is essentially controlled by solid state diffusion; and the amount of copper at the component upper part is determined by the amount of copper left in liquid state part (process stage 2).
Figure 1 shows an example of the final aspect for the obtained components. Three zones can be defined (Fig. 1a): a base of pure copper (zone 1 of the component where there is almost no tin diffusion), a transition zone (zone 2 with a graded distribution of Sn) and a Sn rich zone (zone 3 of the component where a small gradient of Sn content was obtained). These zones were defined according to the chemical composition profile obtained in all the final components (Fig. 5). The length of each zone is dependent on the studied process variables, namely, melt temperature and mould rate.
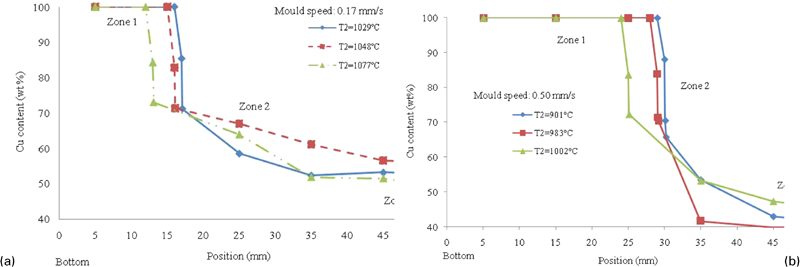
Chemical composition gradients obtained for different temperatures of melt at alloy B addition time for different mould rates
Figure 1 shows an example of one of the obtained specimens and the constituents that can be found from left side of the specimen (pure copper or bottom part of the mould) to the right side of the specimen (Sn rich part or top part of the mould).
Solidification sequence
The constituent sequence obtained along zones 2 and 3 were the following: α, α+δ and ϵ+η′ (see Fig. 2).
The constituent's distribution along the component could be attributed to the following sequence of solidification.
Stage 1: mixing of the initial two liquids (pure copper from top part of melt and added alloy B) with the formation of a thin layer of α phase and constitution of a mushy zone of γ+L phases (Fig. 2). After this first moment, the α phase will grow essentially by the solid state diffusion of Sn through the solid γ phase. The resulting liquid phase chemical composition will be in the zone of the γ+L phases (see Fig. 2).
Stage 2: the solid and liquid phases, in the mushy zone, will tend to separate because of liquid movement (induced by the induction heating) and temperature gradient for the lower and higher component parts respectively. The γ solid phase will transform to the α+δ constituent according to the eutectoid transformation at 520°C with a mean Sn content of 27 wt- (Fig. 2).
Stage 3: The resulting liquid phase (on the component upper part and with a higher Sn content) will solidify in the form of the ϵ+η′ constituent.
This sequence is what is expected from the Cu–Sn phase diagram (Fig. 2) and does not change for all studied processing parameters.
It can be seen that the first phase (α) to form in zone 2, immediately after pure copper, has a chemical composition gradient transition from 0 to 16 wt- of Sn. The second constituent on zone 2 (α+δ) has a gradient of Sn from 16 to 33.
The next zone is zone 3, where an ϵ+η′ constituent is formed. The Sn content at the top end of zone 3 is dependent of the volume of initial liquid copper (determined by the melt temperature and mould rate) that is mixed with the added alloy B. The graded chemical composition on zone 3 is dependent of the local microstructure, namely on the differences on the local phase's distribution and morphology and grain/dendrite size because of the different thermal cycles imposed by the mould rate. Some scatter on the chemical composition gradient in zone 3 (Fig. 5) is attributed to this effect. The gradient in Sn in this zone varies between 33 and 60 wt-, depending on the process parameters.
Effect of processing parameters on obtained chemical composition gradient
Figure 6 presents some selected results in order to show the contribution of the tested process parameters, namely melt temperature and mould rate, on the level of copper transport from the bottom to the top part of the obtained component.
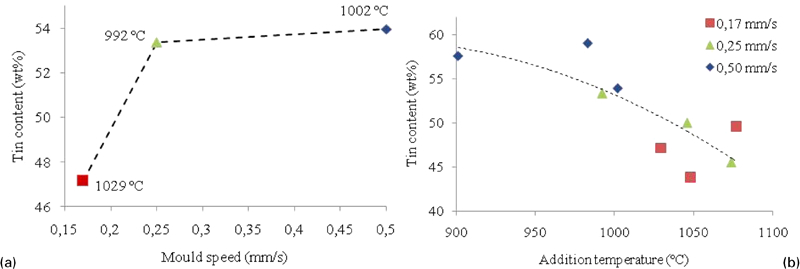
Effect of a relative mould/coil rate (with almost constant alloy B addition temperature) and b alloy B addition temperature on tin content at component top end
Figure 6a shows the influence of rate for an almost constant melt temperature of 1010±18°C. It can be seen that there is a transition of the amount of base copper dissolution when the mould rate changes from 0·17 mm s−1 to higher mould rates. For lower rates (0·17–0·25 mm s−1), there is a substantial increase in copper dissolution. For rates higher than 0·25 mm s−1, the dissolution is almost constant.
Figure 6b shows the influence of temperature of liquid pure copper at alloy B addition time on Sn content on the component top part. It is clear that there is a tendency to an increase in the amount of dissolved copper for the higher addition temperatures. The reason lies mainly on the fact that the higher temperatures allow an increased time for solid copper dissolution into the liquid phase and transport to the top part of the component.
It can be also seen in Fig. 6a and b that there is no direct correlation between chemical composition gradient along the component and any isolated process parameters (mould rate or melt temperature). This means that there is some cross-effect between the tested process parameters and chemical composition gradient. Melt temperature, solidification time, mould rate and time for copper dissolution (the change in liquid chemical composition, after alloy B addition, lowers the liquidus temperature and promotes an increase in copper dissolution) are interdependent, thus giving the obtained chemical composition gradient.
Solidification zone quantification
This complex interaction between the imposed process parameters along with a complex solidification system as in the Cu–Sn system (Fig. 2) imposes that some technological quantified relations are defined.
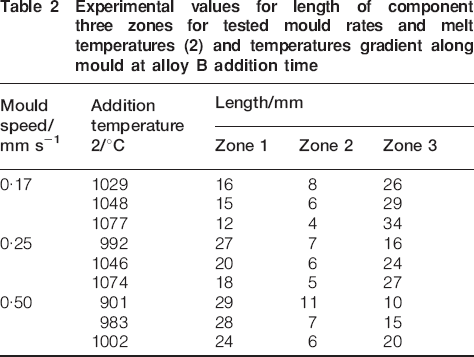
For this purpose, zones 1, 2 and 3 were quantified for the different experimental process conditions.
The obtained results are listed in Table 2 and graphically shown in Fig. 7. Figure 5 shows the chemical composition evolution along the component.
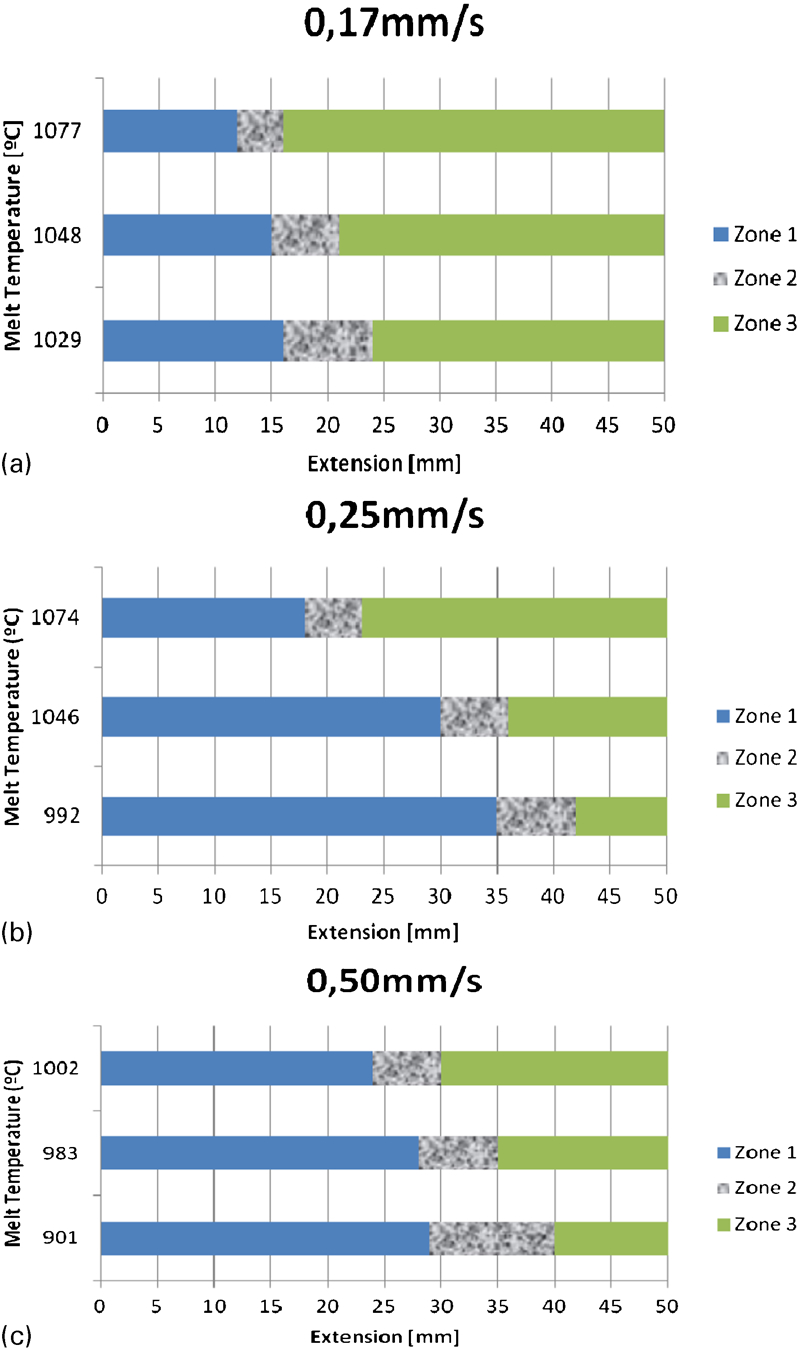
Length/extension of zones 1, 2 and 3 for each obtained FGM component for all tested experimental conditions
Experimental values for length of component three zones for tested mould rates and melt temperatures (2) and temperatures gradient along mould at alloy B addition time
Two types of equations were derived: length of the zones as a function of melt temperature and length of the zones as a function, simultaneously, of both melt temperature and mould rate. These equations are presented in Table 3.
Proposed equations for length of zones obtained in graded components
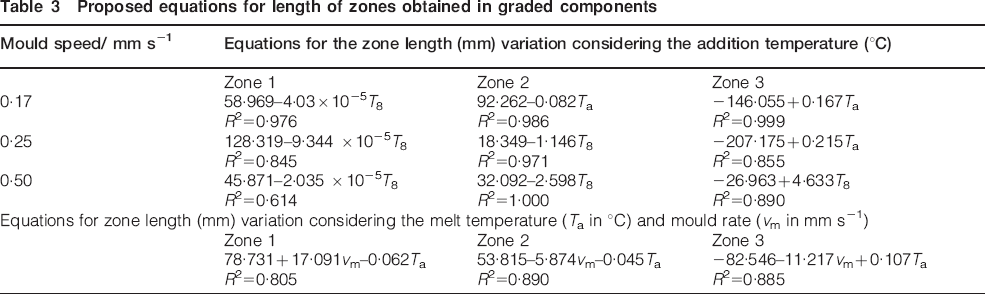
Simple simulations of the obtained equations show that variations on both process variables, namely on rate (0·17 mm s−1<vm<0·5 mm s−1) and on melt temperature (900°C <Ta<1070°C), have an approximate similar effect on zone dimensions. Thus, none of the variables is dominant but both play a relevant role.
Further, it can be concluded that it is possible to quantify/preview the obtained component gradients or zone dimensions/profiles even for complex solidification alloy systems, such as the one studied in the present paper. Thus, although the IMSP is relatively new, it seems that it can be used in a controlled way to produce FGMs in industrial environments.
Conclusions
The obtained results show that it is possible to produce an FGM in a single step by the use of the IMSP technique.
The solidification sequence is maintained for different process parameters.
Although the process is complex, it is possible to control it in a selected range of process parameters and predict the final component characteristics (gradient profile) by knowing the relations between the imposed process parameters.