
Abstract
Fatigue related failures of small bore piping caused by vibration of socket welds often occur at nuclear power plants. The purpose of the present study is to evaluate the integrity of the socket weld in nuclear piping under the condition of vibration testing. The specimens were bolted to the shaker table and shaken simultaneously near their resonant frequencies to produce the desired stress. The test results show that the failures at higher stress tend to originate at the toe, while that for the case of lower stress failures tends to occur at the root. The effects of penetration depth and radial gap were also investigated by finite element method. Results show that the higher penetration depth and radial gap can decline the stress distribution in the weld root, which is beneficial to fatigue life. Further, the desired radial gaps can significantly reduce the von Mises stresses, which decrease from 150·4 to 82·7 MPa with the width of radial gap from 0·1 to 0·4 mm.
Introduction
Fatigue fracture is one of the main failure forms of the small pipe connection in nuclear power plants.1–4 Structural integrity of the bore piping is important for nuclear power plant operation. The damage mechanisms of the piping include stress corrosion, vibration fatigue, design and construction flaws, thermal fatigue, corrosion, erosion–corrosion, flow accelerated corrosion, etc. A key report stated that the failure in the nuclear piping during operation was mainly caused by vibration fatigue.5 In 2002, the Organization for Economic Cooperation and Development issued the Piping Failure Data Exchange project to collect piping data from the plant, which listed 843 fatigue failures among 2399 nuclear piping failure cases during 1970–2001.3,6 Lydell and Riznic reported that 894 of the 3756 nuclear piping failures were due to vibration fatigue failures.7
In the present study, the fatigue life of small bore piping with socket weld is investigated. The use of socket weld is limited to pipes that have size less than the nominal pipe size of 2 in for the American Society of Mechanical Engineers (ASME) class 1 and 2 piping, and less than the nominal pipe size of 4 in for ASME class 2 drain or bypass piping in nuclear power plants.3,8 The Electric Power Research Institute (EPRI) report4,9 had demonstrated that the weld toe and root of the small bore piping were the main failure locations. The effects of weld leg size, residual stress and axial gap on fatigue strength had also been investigated. The reduction of weld leg size could deteriorate the fatigue resistance.2 The ASME code requires that an axial gap of 1/16 in (0·16 cm) be provided between the pipe end and the socket. If there is no axial gap, the piping heated and welded could produce residual stresses in the weld.4 However, Higuchi et al.10 have indicated that the absence of an axial gap is beneficial to fatigue life. Results of previous references indicate that the effects of penetration depth and radial gap located at the weld root on the fatigue life have not been investigated in detail.
Accordingly, in the present paper, the effects of penetration depth and radial gap were analysed, and the S–N curve of the piping joint with socket weld was plotted. The finite element method (FEM) was also used to describe the influences of penetration depth and radial gap.
Experimental
Experimental materials
The test specimen was fabricated by 304L stainless steel (SS) piping and flange, which was machined from 304L SS plate, and welded with 308L weld filler. Their chemical compositions are shown in Table 1. The schematic of the welded specimen is shown in Fig. 1, and the test weld is at the lower end of the specimen between the pipe and the flange and is marked in Fig. 1.
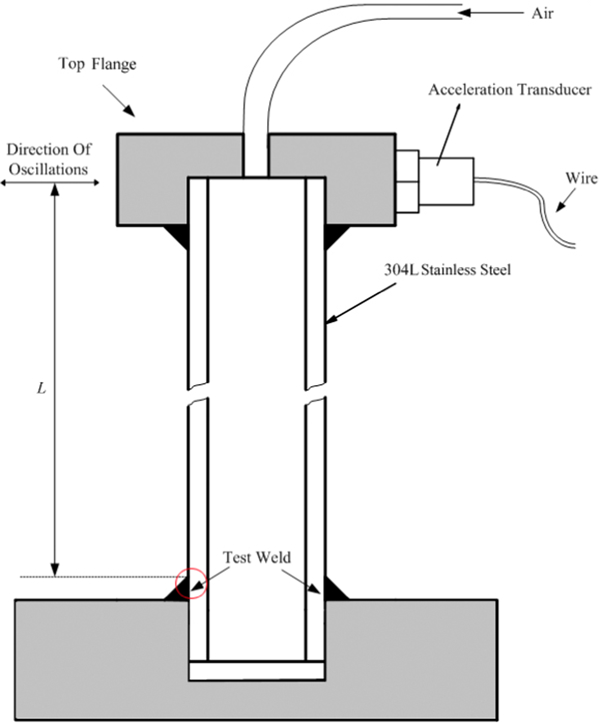
Schematic diagram of test specimen
Chemical composition of 304L SS piping and plate, weld filler/wt-
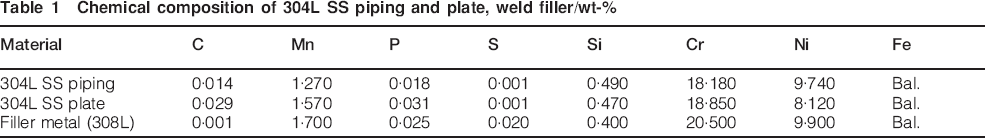
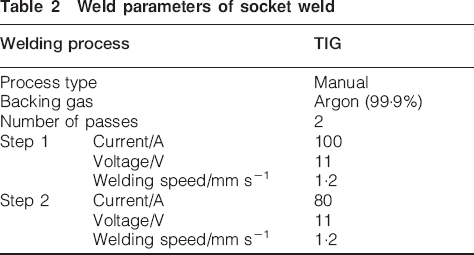
Table 2 shows the welding parameters used in the tungsten inert gas (TIG). The argon backing gas was used to protect the weld pool during welding.
Weld parameters of socket weld
Experimental equipment and approach
The testing was carried out in six groups, with each group containing three specimens that were bolted vertically at the shaker table with harmonic vibration and shaken simultaneously near their natural frequencies to make the specimens swing, resulting in producing desired stresses on the socket weld locations. Figure 2 shows the experimental set-up of vibration tests. Figure 2a shows the whole shaker table equipment, and Fig. 2b presents the tabletop of the shaker table where the specimens are bolted. The response acceleration amplitude of the specimen monitored by the acceleration transducer (see Fig. 1) plays a key role in test stress.
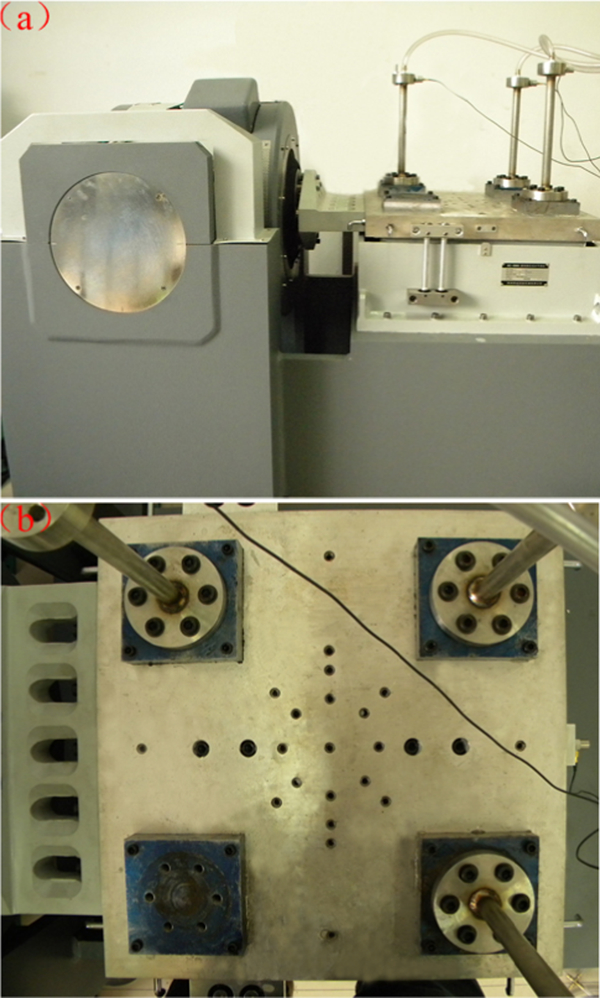
Experimental set-up of vibration tests
The excitation acceleration amplitude and the displacement amplitude of the shaker table are constants during testing, and the response acceleration amplitude and displacement amplitude of the specimen are invariable before crack propagating. Owing to the harmonic vibration of the table, the functions of displacement and acceleration of the table and specimen are sinusoidal. Therefore, the equations of the displacement, acceleration and acceleration amplitude of the shaker table and specimen can be expressed as equations (1)–(4). Equations 5 and 6 present the response and excitation acceleration amplitude
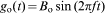


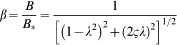
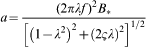
Equation (8) clearly states that the static force migration B*, the frequency ratio λ and the damping ratio ζ can affect the response acceleration amplitude a. The static force migration is related to the excitation acceleration amplitude of the shaker table ao. The damping of a small bore cantilever attachment is usually 0·5–1, and the damping of complex piping systems with pipe supports is generally higher, in the order of 5.4 The frequency ratio is the ratio of the excitation frequency to the natural frequency of the pipe system. The natural frequency is obtained by a sweep of frequency. It is shown in Fig. 3, where the frequency at the fastest acceleration position is the natural frequency. The natural frequencies of the socket weld specimens are usually about 90±2 Hz, and the shaker table typically ran at 85–90 Hz. The response acceleration amplitude can be adjusted by changing the excitation acceleration amplitude and/or the excitation frequency before crack propagation.
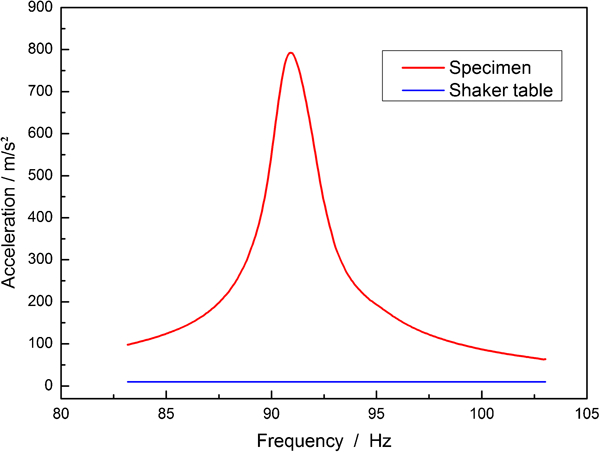
Result of frequency sweep for specimen
During the testing, the propagation of fatigue crack will decrease the natural frequency, resulting in the degradation of the response acceleration and the fatigue crack growth.4,11 However, adding or subtracting screw nuts and washers of top flange can change the natural frequency of specimens to the original level, so the desired stress would be obtained again until the specimens fail.
Figure 4 shows a complete set of monitoring equipment. The air compressor, valve, pressure gauge and tested specimen were connected and sealed by rubber tubes; furthermore, the acceleration transducer was linked to the control computer. Before testing, the specimens were pressurised with air at a moderate pressure of ∼200 kPa. When depressurisation occurred during testing, the pressure gauge would alert, which indicated the failure of a sample. Then, the failure sample should be removed from the shaker table at the stoppage of test.
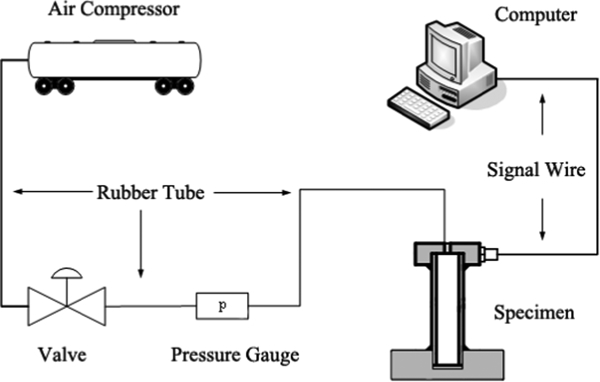
Schematic diagram of test apparatus
Theory of stress calculation on test weld
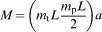
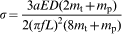
The acceleration of flange, the shaker table frequency and the weights of flange and pipe would be recorded to calculate the stress (σ) of the test weld. The test specimen can be approximately regarded as a cantilevered beam with uniformly distributed load a that is equal to the monitored acceleration amplitude and concentrated stress P, as shown in Fig. 5. The calculation stress (σ) is the highest stress of maximum moment located at the bottom of cantilevered beam. The equation about stress (σ) can be deduced from the equations about displacement, moment and frequency and are shown as follows.
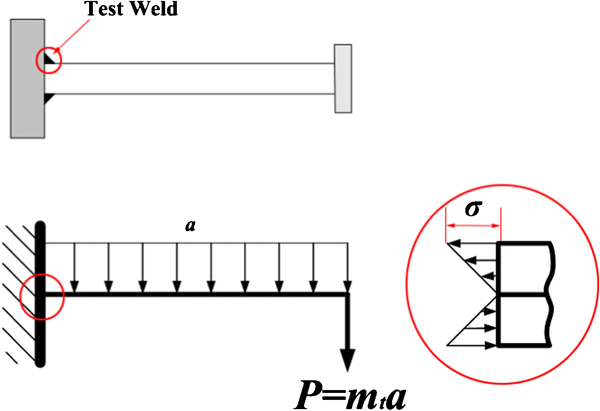
Schematic of specimen for calculating test stress: left down red circle points to location of test stress, and right red circle is amplification graph of cantilevered beam bottom
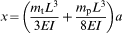
The maximum displacement x of the specimen is expressed as equation (9)


Results
Stress analysis and S–N curve generation
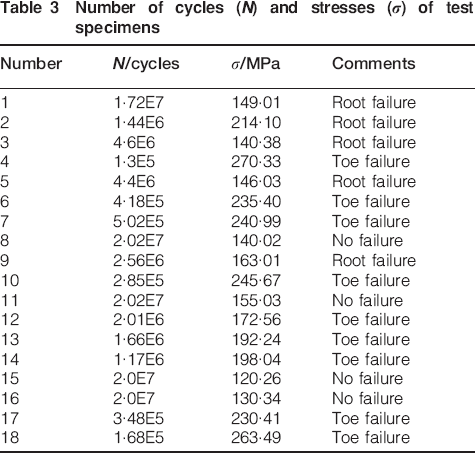
The testing was carried out on 18 specimens that were implemented at desired stress. The outside diameter and length of the pipe and the weights of flange and pipe, etc., were recorded before testing for calculating the stress (σ) by equation (14). The number of cycles (N) is the product of the test time and the excitation frequency of the shaker table. The test results are shown in Table 3. The specimens regarded as cantilevered beam are given the same tension and compression stresses, which means that the typical stress ratio R (min. load/max. load) is −1. The S–N curve of the specimens is shown in Fig. 6, where it is observed that failures at a higher stress tend to originate at the toe, while for the case of lower stress failures, they tend to occur at the root. In the figure, five specimens exhibit root failures, nine specimens are toe failures and the remaining four specimens are runouts that are defined as a test conducted at 2×10⁷ cycles in which no evidence of specimen failure is observed. Figure 7 shows the specimens of toe and root failures. The root failure is that the crack originates at the inside of the weld roots and propagates to the outside surface of the specimen on the socket side of the weld, and the crack of toe failure initiates at the outside surface of the specimen near the pipe side toe of the weld and propagates to the inside surface.4
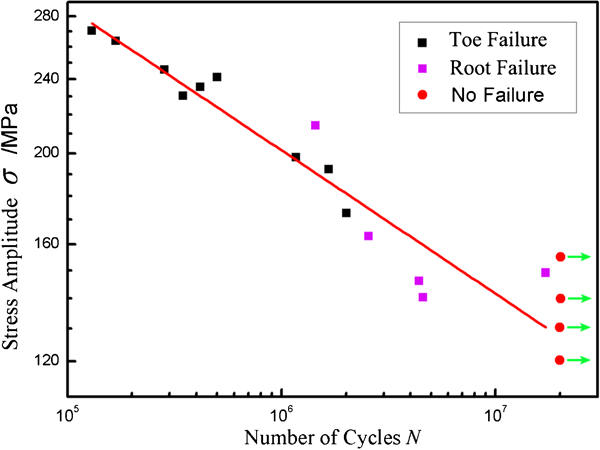
Curve (S–N) of small boring piping with socket weld using vibration fatigue test method
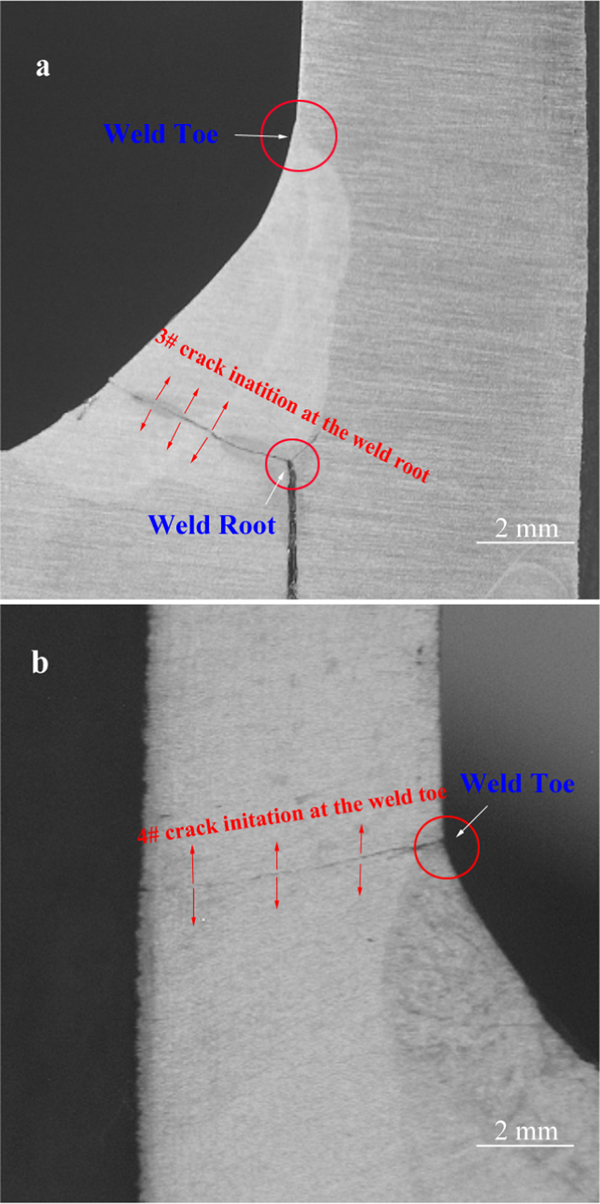
Micrograph of fatigue failure of socket weld
Number of cycles (N) and stresses (σ) of test specimens
Value of penetration depth and radial gap
The results obtained in the present investigation are not consistent with the EPRI report4 that the frequencies of root failures are higher than those of toe failures. Hence, it is important to find the reason that the weld root had good fatigue resistance in the present study. Thus, the specimens were cut to record and analyse the parameters about radial gap and penetration depth of the weld root. The configuration about radial gap and penetration depth is shown in Fig. 8, where ‘h’ and ‘p’ are penetration depth and radial gap respectively, while ‘g’ is the axial gap. The average values of penetration depth and radial gap are presented in Fig. 9. The penetration depths of root failure and toe failure are ∼0·3 and 0·4 mm respectively. However, the penetration depth of runout specimens reaches 0·73 mm, which is higher compared to those of failure specimens. This is because of the higher penetration depth that can reduce the stress of root under the same applied stress and increase the effective throat size, resulting in improving the fatigue resistance. In the EPRI report,4 the current and voltage of root pass and the cap passes are constants, but the weld speed of the root pass is higher than that of the cap pass. However, in the present work, the weld technique shown in Table 2 is that the current of the root pass is higher than that of the cap pass, and the other parameters are constants. Therefore, in the present work, the heat input of the root pass is higher that of the cap pass, which can increase the penetration depth. However, the EPRI is just the reverse. The radial gaps of root failure and toe failure specimens are almost the same as 0·1 mm, which is less than that of the runout specimen that is 0·25 mm. The above results indicate that a higher radial gap can improve the fatigue resistance.
Geometrical diagram of test specimen, where ‘p’ is radial gap, ‘g’ is axial gap and ‘h’ is penetration depth of weld root
Comparison about penetration depth and radial gap on different failure types
Fatigue evaluation of socket weld by FEM
Finite element model for socket weld
The socket weld was evaluated by FEM with the commercial finite element software ABAQUS. The axial gap of model complies with the ASME code. There are seven two-dimensional elastic models to compare with the effect of different penetration depths and radial gaps, and their models are basically same except for the location that is being compared, and this is shown in Fig. 10. Figure 10a shows the overall geometry, and Fig. 10b presents the enlargement of root. Meshing of the model is developed carefully with finer elements near the weld root and toe, and the distance of the finer model node is 0·01 mm. Displacement controlled loading is prescribed at the end of the piping for fatigue response simulation, which means that calculation stress is same. The material properties in the model use the date for 304L SS, but it should be noted that the same properties are used for the heat affected zone and the weld material. The 304L data are taken from Cheng's doctoral thesis.12 The different models with the same displacement loading compare with the stress of the weld root to analyse the effect of penetration depth and radial gap.
Two-dimensional model
Actually, the penetration depths of most specimens are ∼0·3 mm. Therefore, the penetration depths were set to 0·15, 0·25, 0·3 and 0·4 mm, and the radial gap was constantly set to 0·1 mm in the models. The other three models researched the effects of radial gaps. Here, the radial gaps were set to 0·1, 0·2 and 0·4 mm, and the penetration depth was set to 0·3 mm. The weld roots of the different radial gaps are shown in Fig. 11, where the marked points around the semicircle of the weld root are picked up to compare with the effect of penetration depth and radial gap. Figure 11a presents the model with 0·1 mm radial gap, Fig. 11b presents the model with 0·2 mm radial gap and Fig. 11c presents the model with 0·4 mm radial gap.
Geometrical diagrams of weld root with different radial gaps under displacement loading
Effect of penetration depth
According to the above analysis, the penetration depth of the weld root can affect the socket weld integrity. The von Mises stress distributions of the weld root with different penetration depths are shown in Fig. 12, where it can be observed that the highest stress is located at the centre point, and the stress diminishes from the centre to both sides. The highest von Mises stresses of the weld root with 0·15, 0·25, 0·3 and 0·4 mm penetration depths are 156·5, 151·6, 150·4 and 147·7 MPa respectively. It can be seen that the highest stress in the weld root declines as the penetration depth increases from 0·15 to 0·4 mm. As a result, the fatigue life of the specimen is improved because of the degradation in the stress, which is consistent with the tested results.
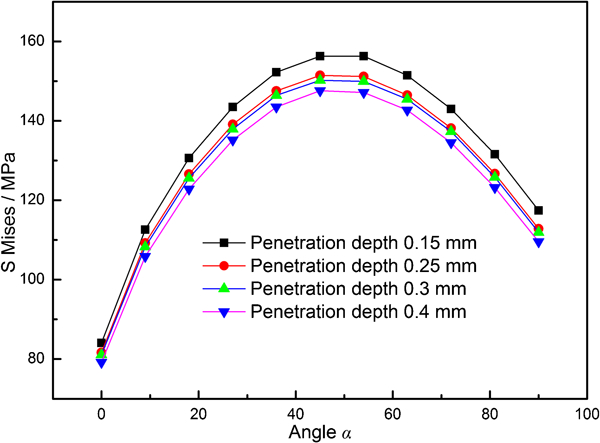
Comparison about effect of penetration depth on von Mises stress
Effect of radial gap
In the present paper, the radial gaps of no failure specimens are highest. However, it is not exactly that the oversized radial gap causes better fatigue resistance, since an oversized radial gap can cause bad appearance of weld root, which can intensify stress to make against the fatigue life. It is observed that specimens with 0·1–0·4 mm radial gaps have good appearance of weld root. The von Mises stresses distributing in the weld root with various radial gaps are shown in Fig. 13. The highest stresses of models with 0·1, 0·2 and 0·4 mm radial gaps are 150·4, 109·5 and 82·7 MPa respectively. The lowest maximum stress in the weld root is located in the radial gap with 0·4 mm. The von Mises stress of the model with 0·4 mm radial gap declines by 45·0 and 24·5 compared with those of models with 0·1 and 0·2 mm radial gaps. It demonstrates that the higher radial gap can increase the radius, resulting in reducing the severity of the notch, where the stress concentration factor in the weld root can be declined under the same applied stress. Therefore, the higher radial gap can improve the fatigue life of the socket weld.
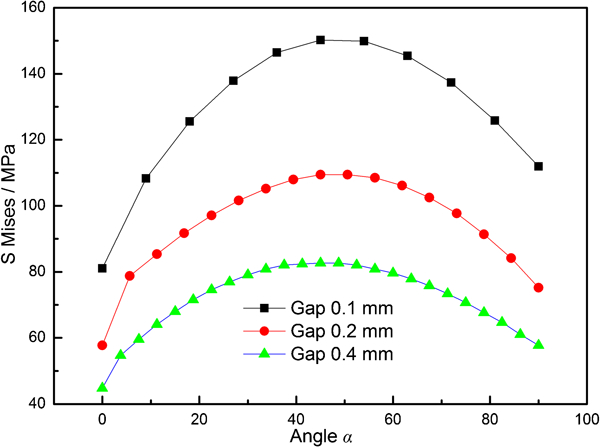
Comparison about effect of radial gap on von Mises stress
Conclusions
In the 18 specimens, nine specimens exhibited toe failures originating from the weld toes and propagating to the inside surface, five specimens exhibited root failures originating at the weld roots and propagating to the outside surface on the socket side of the weld and the remaining four specimens were runouts.
The effects of penetration depth and radial gap were also investigated by FEM. The results show that the higher penetration depth and radial gap can decline the stress distribution in the weld root, which is beneficial to the fatigue life. The von Mises stress of model with 0·4 mm radial gap shows 45·0 and 24·5 decrease compared with those of models with 0·1 and 0·2 mm radial gaps.
Footnotes
Acknowledgements
The present research work was financially supported by the Project of the National Natural Science Foundation of China (grant nos. 50975196 and 50805103), Key Project in the Science & Technology Pillar Program of Tianjin (Grant no. 11ZCKFGX03000) and Research Fund for the Doctoral Program of Higher Education of China (grant no. 20090032110026).