
Abstract
Isothermal compression tests are carried out on 20CrMnTiH steel using a Gleeble-1500 thermal simulator in the temperature range of 1223–1423 K and in the strain rate range of 0·01–10 s−1. The flow behaviours of 20CrMnTiH steel are described, which are based on the analysis of true stress–true strain curves. The effects of hot deformation on the microstructure are investigated. The results show that there is a typical dynamic recrystallisation behaviour during deformation. A constitutive model coupling flow stress with strain, strain rate and temperature to 20CrMnTiH steel is proposed using a hyperbolic sinusoidal type equation. In the constitutive equation, the material constants α, n, ln A and Q are found to be functions of strain. The validity of the constitutive equation is assessed by the correlation coefficient (r), the average absolute relative error and the mean squared error.
Introduction
20CrMnTiH steel is widely used in the fabrication of wearable parts because of its excellent mechanical properties. True stress–true strain data of many materials acquired from isothermal compression tests are usually applied to research deformation behaviour. The data acquired are described on the basis of corresponding constitutive equations that closely correlate flow stress, strain, strain rate and deformation temperature. In the past, various constitutive equations of materials have been developed to represent the flow behaviours of metals and alloys. The sine hyperbolic equation with Arrhenius term is well used to research the hot deformation behaviours of materials.1–4 A new relationship to 9Cr–1Mo steel for the stress multiplies of Garofalo sine hyperbolic equation is obtained to predict the flow stress.5 The hot deformation behaviour of 410 martensitic stainless steel has been analysed using hyperbolic sine constitutive equation and processing map.6 The effects of temperature and strain rate on the deformation behaviours of 9Cr–1Mo steel have been represented by the Zener–Hollomon parameter in an exponent type equation.7
In order to control the microstructure and mechanical properties in hot deformation of materials, the research of dynamic recrystallisation (DRX) is an important process. For the sake of providing experimental data to optimise Aermet100 steel, the DRX kinetics has been established by further analysis of the true stress–true strain curves.8 The DRX behaviour of Nb–Ti microalloyed steel has been investigated by means of hot torsion tests at different deformation temperatures and strain rates.9 A critical strain rate has been carried out, above which DRX becomes unimportant in the hot mechanical behaviour of IF steels.10
The objective of the present paper is to study the hot deformation behaviour of 20CrMnTiH steel by isothermal compression tests and to analyse the DRX behaviour in deformation processing. The experimental data obtained from hot compression tests on a Gleeble-1500 thermal–mechanical simulator are used to resolve a constitutive model in a temperature range from 1223 to 1423 K and a strain rate range from 0·01 to 10 s−1. The reliability of the constitutive equation is also verified by comparison of the predicted and experimental flow stress and load–stroke curve, which are based on the correlation coefficient (r), the average absolute relative error (AARE) and the mean squared error (MSE).
Experimental
A set of sample rods of 20CrMnTiH steel are adopted in the present study. Its chemical composition (wt-) is 0·18–0·23C, 0·80–1·10Mn, 1·00–1·30Cr, 0·04–0·10Ti, 0·17–0·37Si, 0·035P and 0·035S. Figure 1 shows the original microstructure of 20CrMnTiH steel.
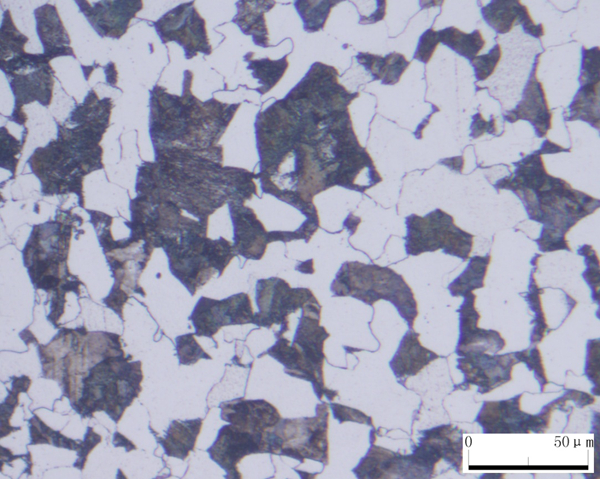
Original microstructure of 20CrMnTiH steel
Cylindrical specimens with 12 mm length and 8 mm diameter are prepared for isothermal hot compression tests conducted on a Gleeble-1500 thermal simulator. Graphite and machine oil are daubed on the surfaces of dies and samples in order to avoid inhomogeneous deformation caused by uneven cooling of the sample's end and friction between sample and die. Before hot compression, the specimens are heated to the deformation temperature and kept for 3 min to ensure uniform temperature distribution in the samples. The tests are performed in the temperature range of 1223–1423 K at an interval of 50 K, and the imposed constant strain rates are 0·01, 0·1, 1 and 10 s−1. The reduction in height is 50 at the end of the compression tests. The true stress–true strain curves are obtained using the load–stroke data acquired from compression tests.
The specimens are quenched with water immediately after deformation to retain the deformed microstructure. The deformed specimens are sectioned along the longitudinal compression axis. Then, the sections are polished in the chemical mordant. The microstructure of 20CrMnTiH steel is analysed by means of an optical microscope.
Results and discussion
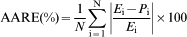
The true stress–true strain curves obtained from the hot compression tests at different temperatures and strain rate are shown in Fig. 2. It can be found that most of the curves exhibit typical DRX characteristic with a single peak stress followed by a gradual fall toward a steady state stress. Moreover, at the lower strain rate of 0·01, 0·1 and 1 s−1, the peak stress increases with increasing strain rate and decreasing deformation temperature at lower strain rate. However, the true stress–strain curves have no apparent peak stress in the whole deformation process at higher strain rate of 10 s−1. That is because strain hardening rate slows down the rate of DRX.

True flow stress–strain curves at a T = 1223 K and b
= 0·1 s−1
It can be seen that flow stress increases noticeably with decreasing deformation temperature for a specific strain rate. On the contrary, for a given deformation temperature, flow stress increases distinctly with increasing strain rate. It is concerned that it has not enough time to provide energy accumulation for DRX feature at higher strain rate and lower deformation temperature.
The microstructures of 20CrMnTiH steel at different deformation temperatures with a strain rate of 0·1 s−1 are shown in Fig. 3a–e. It can be seen that the deformed grain size grows with increasing deforming temperature. This is because that a higher deforming temperature can lead to increase of deformation energy, and the DRX grain growth becomes easier; as a result, the grain size tends to coarsen.
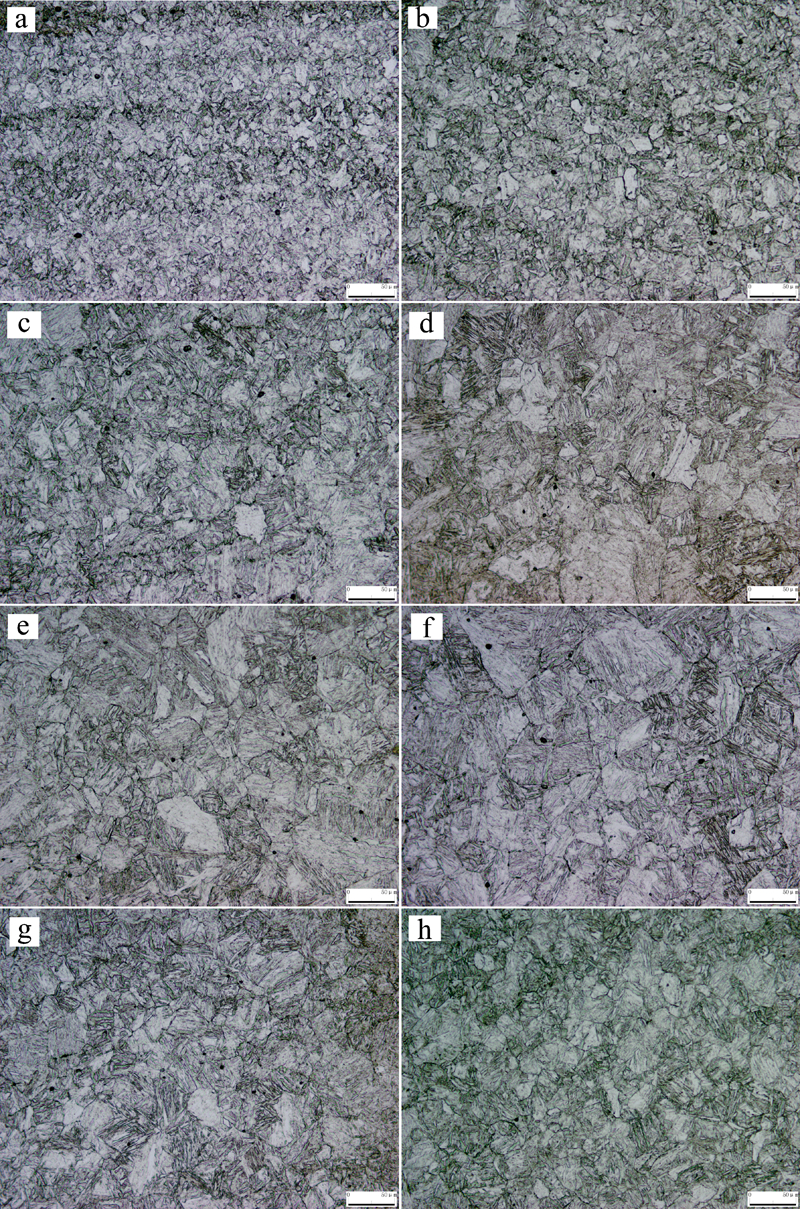
Microstructure of XC45 steel deformed at different deformation conditions
Figure 3d and f–h describes the microstructures of 20CrMnTiH steel at the strain rates of 0·1, 0·01, 1 and 10 s−1 respectively, with a deformation temperature of 1373 K. It can be found that the higher the strain rate, the finer the DRX grain size will be acquired. The major reason is that the dislocation density increases with increasing of strain rate, which can cause increase of recrystallisation nucleation rate. Therefore, the refined grain size is achieved.
Constitutive analysis
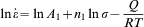
The relationship of temperature, strain rate and flow stress in hot deformation can be described by the Zener–Holloman parameter (Z) as follows11,12
 is the strain rate (s−1), R is the universal gas constant (8·3145 J mol−1 K−1), T is the absolute temperature (K), Q is the apparent activation energy of the deformation process (kJ mol−1) and σ is the flow stress (MPa).
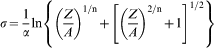
The Z parameter can be described as a function of flow stress. The power function equation of equation (2) is usually used in low stresses. On the contrary, the exponential equation of equation (3) is commonly preferred for high stresses. Nevertheless, the hyperbolic sine equation of equation (4) can be used in all deformation conditions


Determination of material constants
By mathematical conversion between equations (1) and (2) to equation (3), and taking the natural logarithm of these converted equations, the equations can be indicated into the following forms
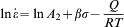
 versus ln σ plot (Fig. 4a) and the ln
  versus σ plot (Fig. 4b) respectively. n1 and β are 6·5455 and 0·072 MPa−1 respectively, which gives the value of α = β/n1 = 0·011 MPa−1.

Plot of a ln
versus ln σ and b ln  versus σ
Substituting f(σ) to equation (4) and taking the logarithm of the two sides of the resulting equations yield

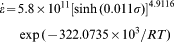
 versus ln [sin h(ασ)] plot (Fig. 5a) is obtained, and the values of the strain rates and flow stresses are substituted into equation (7). The value of n, which is obtained as the mean slope of the ln
  versus ln [sin h(ασ)] plot, is 4·8887. The value of ln A−Q/RT as intercept P, hence


Plot of a ln
versus ln [sin h(ασ)] and b P versus 1/T
Substituting the values of α, n, Q and A into equations (1) and (4), and giving the constitutive equation of 20CrMnTiH steel under the strain of 0·2 during hot compression, the constitutive equation is expressed as
Compensation of strain
It is generally considered that the effect of strain on hot deformation behaviour is insignificant, and strain is not considered in equation (1) for this reason. However, it has been found that material constants (α, n, Q and A) show significant variation with strain. Then, the values of material constants (α, n, Q and A) on the constitutive equation can be calculated under the deformation strains ranging from 0·04 to 0·6 at the interval of 0·04. The relationships between material constants (α, n, Q and A) and the true strain, acquired using polynomial function, are expressed by equation (10)
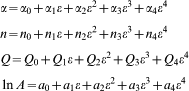
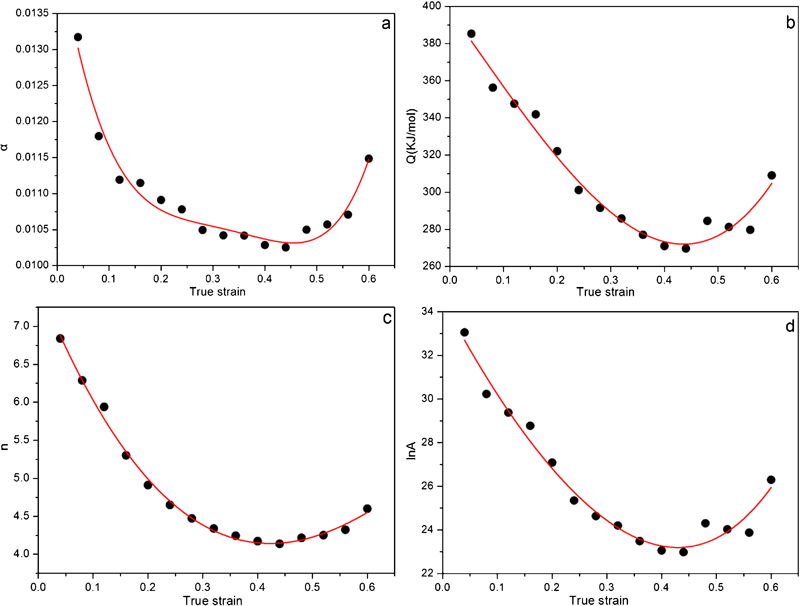
Variations of a α, b Q, c n and d ln A with true strain
Coefficients of polynomial for α, n, Q and ln A
Substituting equation (10) to equation (4), the flow stress at specific strain can be predicted by the following equation
Verification of constitutive equation
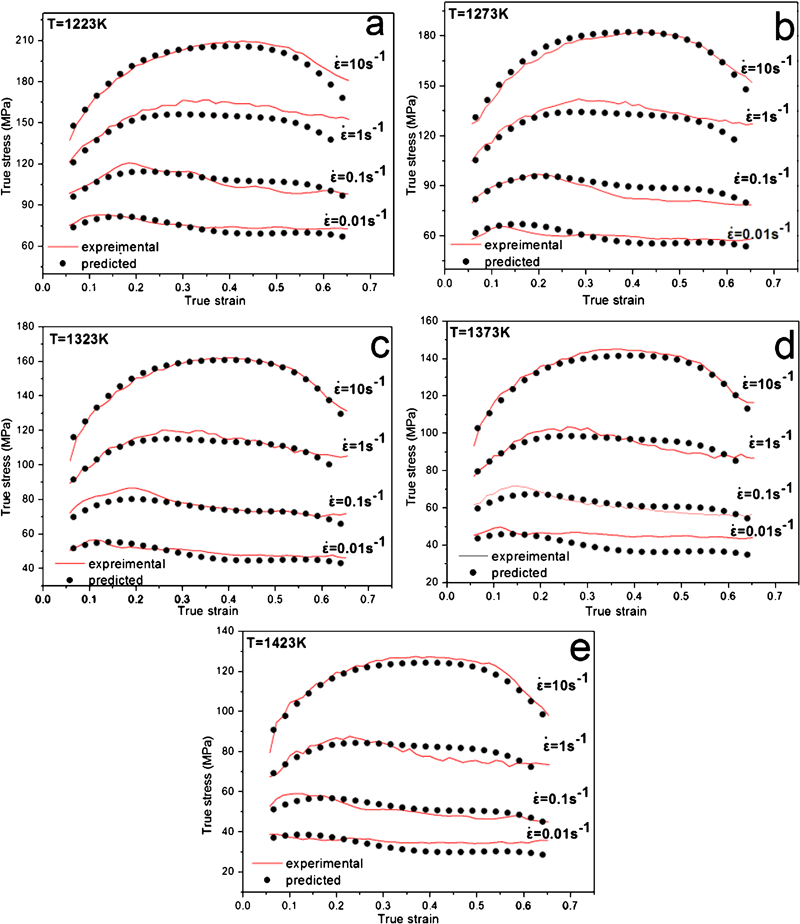
The predictability of the constitutive equation considering compensation of strain can be estimated through the comparisons between the experimental and predicted flow stresses at different deformation conditions. Figure 7 shows that there is a close correlation between the experimental and predicted flow behaviours of 20CrMnTiH steel. The correlation coefficient (r) and AARE are described in order to estimate the accuracy of the constitutive equation as follows
 and
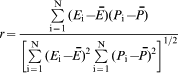
and  are the mean values of E and P respectively. N is the number of data adopted in the present investigation. The correlation coefficient (r) is usually used to show the linear relationship between the predicted and experimental values. However, the AARE is calculated through a one by one comparison of relative error. It can be found that a good coefficient (r = 0·989) is acquired between the experimental and predicted values from Fig. 8. The AARE is calculated to be 4·27 for the whole deformation processing. The results indicate that the constitutive equation can effectively predict the hot deformation behaviour of 20CrMnTiH steel.
Comparison of experimental flow stress and predicted flow stress
Correlation between experimental and predicted flow stresses at different deformation conditions
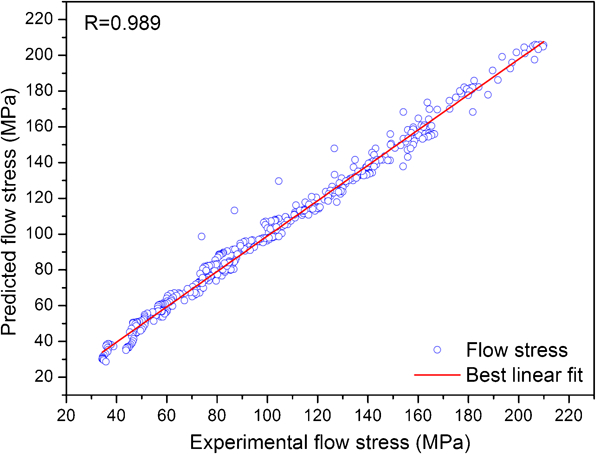
A FEM simulation model of the hot compression tests is built up to calculate the load during the process of tests through the commercial finite element software DEFORM. The load–stroke curves between the experimental and predicted data are obtained from DEFORM, as shown in Fig. 9.
Comparison of experimental and predicted load–stroke curves at strain rate of 1 s−1
The MSE between experimental and predicted data can be calculated by the following expression
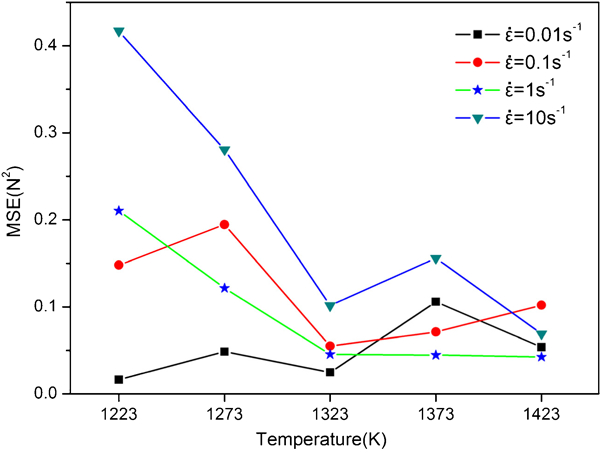
Mean squared errors of predicted loads at different deformation conditions
Conclusions
The hot deformation behaviours of 20CrMnTiH steel have been studied over a range of temperatures and strain rates by means of hot compression tests. The results indicate that flow stress increases with increasing strain rate and decreasing deformation temperature.
The microstructures of 20CrMnTiH steel at different deformation temperatures and strain rates have been researched. The results show that deformed grain size increases with increasing deforming temperature and with decreasing strain rate.
Based on experimental flow stress–strain data, an Arrhenius type constitutive equation considering strain compensation has been developed. By comparing the experimental data with predicted data, the correlation coefficient (r) is 0·989, and the AARE is 4·27. Almost all the MSEs are under 0·25. The results show an excellent predictability of the constitutive equation.
Footnotes
Acknowledgements
The authors gratefully acknowledge the support from Senwei Group Co., Ltd. (Jiangsu, China) for the supply of materials.