
Abstract
Inclusions play a significant role in certain failure processes and material specifications. Therefore, characterising the largest inclusions in a finite volume of metal from observations on polished surfaces is a key problem facing industry and research. Current efforts to predict the largest inclusions expected to occur in a volume based on light microscopy investigations of polished surfaces are dominated by the simple heuristic model developed by Murakami and his collaborators. In the present paper, an alternative and comprehensive statistical model for inclusion characterisation based on block maximum sampling from polished surfaces is presented. The relation between the observations (two-dimensional) and the actual inclusions (three-dimensional) is transparently modelled. Furthermore, similarities and differences with an existing popular model are explored. The presented model offers deeper insight with the convenience of two-dimensional inspections.
List of symbols
distribution parameter
size of a reference area
distribution parameters
expected value of the random (dummy) variable X
probability density function of Sw (w = A, V)
cumulative distribution function of Sw (w = A, V)

approximate cumulative distribution function of ZV (Murakami)
cumulative distribution function of Zw (w = A, V)
area of sectional circles
area of grand circles
return period
some power transformation of Sw (w = A, V)
size of a target volume
size of a reference volume (Murakami)

estimate of (dummy) parameter x
the largest sectional circle on a reference area
the largest grand circle in a target volume
certain percentile
distribution parameter
intensity of observed sectional circles
intensity of grand circles (or spheres)
Introduction
The presence of inclusions in engineering alloys has been related to the initiation of certain failure processes.1,2 In particular, the fatigue strength of a metallic structure appears to be strongly correlated to the largest inclusion located in a high stress region under cyclic loading.3 Moreover, inclusions play an important role in the production of clean steels. With improvements in production techniques, the number and size of inclusions are continuously being reduced to meet customer requirements.4 Therefore, proper characterisation of inclusions expected to occur in a finite volume of a metal is of relevance, whether related to reliability of performance or quality control issues.
Characterisation of inclusions should be based on reasonable statistical models. However, such models require an initial set of sample data in order to estimate the necessary model parameters. Samples are taken from small quantities of material, and then the statistical models are extrapolated to make inference about inclusions expected to occur in significantly larger volumes. Therefore, the practical aspects of data sampling should be considered carefully, since the sampling procedure often determines the characteristics and the practical and industrial applicability, of any statistical model.
The main concern in inclusion characterisation appears to be predicting the largest inclusion expected to occur in a finite volume. Consequently, different branches of asymptotic extreme value theory are often adopted and applied for inclusion characterisation.5–7 Available statistical models tend to neglect the practical aspects of the sampling procedure and assume that sample data are readily available. However, direct sampling of inclusion sizes often involves elaborate, time consuming and costly methods.8
Alternatively, measurements may be performed far more conveniently by means of two-dimensional (2D) light microscopy examination (stereology) of polished surfaces.9 However, only random cross-sections of the inclusions can be observed and measured from polished surfaces, i.e. indirect sampling. Therefore, sample data obtained in this manner require rigorous analysis and statistical modelling.10–14 Unfortunately, most of the models available for this purpose are mathematically complicated, reducing their practical relevance. Consequently, applied efforts for inclusion characterisation are dominated by the simple heuristic model after Murakami and his collaborators,3,15–17 which is based on block maximum sampling from polished surfaces. However, the simplicity of this model comes at the cost of mathematical transparency (black box model).
In the present paper, an alternative and comprehensive statistical model for inclusion characterisation based on block maximum sampling from polished surfaces is presented. Advances in light microscopy measurements allow rapid and automated data sampling. This has many obvious benefits with regard to cost, time consumption and convenience. The drawback is usually the mathematical complexity involved in the analysis and modelling. The presented model aims to improve on that. The scope is: appropriate statistical modelling of block maximum sample data taken from polished surfaces, relating the sample data to the actual inclusion sizes, determining the distribution of the largest inclusion sizes in a finite volume and comparison of the presented model with the work of Murakami and his collaborators.
Model definitions and assumptions
Before proceeding, the problem is idealised by assuming spherical inclusions, and that inclusions of independent and identically distributed (i.i.d.) random sizes are homogeneously distributed in the volume of the material. If the material was cut as shown in Fig. 1a, sectional circles of the spheres would be observed on the cutting plane by the light microscope (see Fig. 1b).
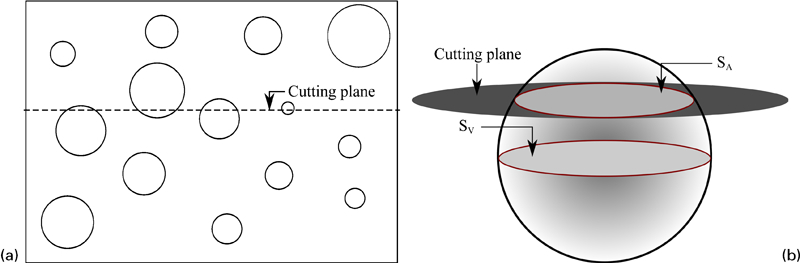
Schematic drawing of a cutting plane and spherical inclusions embedded in material and b single spherical inclusion
Relating the observed sectional circles to the spheres was first accomplished by Wicksell,18 often referred to as Wicksell's corpuscle problem. Significant and recent contributions to the problem were presented, among others, by Takahashi and Sibuya.10–12,19 Thus, some of their results and notation are adopted.
The sizes of the spheres and sectional circles were originally characterised by Wicksell by their diameters. However, characterising them by areas is preferred since it is mathematically more convenient.20
The area of the grand circle, i.e. the projection of the sphere on a plane, is denoted by SV and the area of the sectional circle by SA (see Fig. 1b). The spheres may be assumed to occur unconnected and as a homogenous Poisson process of intensity λV in the volume of the material. Consequently, the sectional circles will also constitute a homogenous Poisson process of intensity λA with similar properties as the spheres. The intensities λV and λA are related in the following way19,21

Moreover, let fw and Fw be the probability density function (PDF) and cumulative distribution function (CDF) of Sw (w = V, A) respectively. The exact relation between SV and SA may be expressed in terms of their PDF and CDF12,18
Statistical modelling of largest inclusions
Analysis and modelling of 2D sample data
The areas of the sectional circles SA are the only observable data. Therefore, it is natural to utilise this variable as the basis for the proposed model. Let {SA1,SA2, …, SAn} be a sequence of all the areas of the sectional circles present on one of many reference areas (i.e. examined surfaces). However, only the largest sectional circle in each reference area is sampled due to block maximum sampling. Therefore, the random variable ZA = max{SA1,SA2, …, SAn} is of interest. Under the i.i.d. and Poisson assumptions, the CDF of ZA may be expressed as22

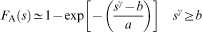
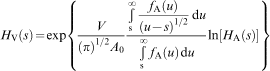
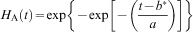
The general solution to the above extreme value problem requires knowledge about which parametric family FA belongs to, which is in most practical cases unknown. Instead, asymptotic extreme value theory will be invoked as an approximation of the distribution of the largest sectional circles; as λAA0→∞, HA approaches one of three possible limiting distribution functions often referred to as type I (Gumbel), type II (Fréchet) or type III (Weibull) extreme value distributions. (Equivalently, it is stated that FA is in the domain of attraction of a type I/type II/type III extreme value distribution). Most of the common distributions are in the domain of attraction of a type I extreme value distribution.22
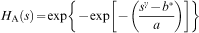
Somewhat simplified, the tail behaviour of FA determines its domain of attraction. In the present paper, it is assumed that the tail of FA is asymptotically exponentially decreasing (type I), and accordingly, the left truncated CDF may be approximated as
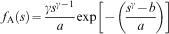
 as the random variable.
From 2D to 3D
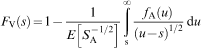
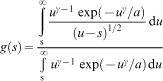
Similar to above, let {SV1,SV2, …, SVm} be a sequence of all the areas of the grand circles present in a target volume (i.e. the volume of a structure of interest) and ZV = max{SV1,SV2, …, SVm}. The core issue is to rationally and consistently determine the CDF of ZV
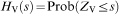
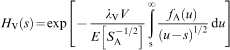
Under the i.i.d. and Poisson assumptions, the CDF of ZV may be expressed as

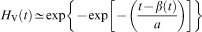
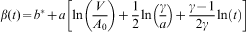
 cancel out. From equation (10), the extreme value distribution of the largest inclusions in a target volume may be expressed as
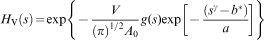
Finally, it may be more practical to express the extreme value distributions in terms of the power transforms 
Parameter estimation
Although γ was introduced as a model parameter, it may be adopted also as a fitting parameter. However, this aspect will not be covered here.
First, determine a suitable γ and transform the sample data  . Then, fit the transformed maxima data to HA and estimate the distribution parameters
  and
and  . Note that HA is basically the Gumbel distribution, and therefore, parameter estimation can be performed easily by means of any suitable method and/or computer software.
The CDF of the largest inclusions in a target volume is obtained by inserting  ,
,  , A0 and V into equations (16) and (17).
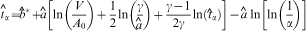
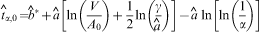
Quantile estimation
Quantile estimation is similar but slightly more complicated than Gumbel distribution. For the quantile HV(t
α
) = α, the estimate may be expressed as
Comparison with Murakami model
Murakami and his collaborators have established a model for the statistical characterisation of inclusions.3 This method also deals with sample data obtained from light microscopy investigation of polished surfaces and may currently be the most popular approach from an application point of view. In that regard, the presented model will be briefly discussed with respect to the Murakami model.
Similarly, the Murakami model utilises extreme value theory and block maximum sampling from polished surfaces. However, the square root of the projected area of the inclusions is utilised, which corresponds to setting γ = 1/2 in the presented model. Furthermore, the complicated mathematics that arises due to the stereological issues is avoided by introducing a key ad hoc assumption:
For γ = 1/2, there exists a reference volume V0 for every reference area A0 such that HV = HA (i.e. HA and HV are parallel in a Gumbel probability plot).
This assumption seems to be based on extensive simulation work.23 The reference volume was defined as
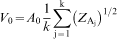
 to avoid confusion with the exact HV.
Inference about the sizes of the largest inclusions expected to occur in a target volume V larger than the reference volume is performed by means of the return period concept.22 The return level is interpreted as some characteristic inclusion size expected to occur in a target volume.
The key differences between these two models may be summarised as follows:
the Murakami model is basing most of its assumptions on subjective evaluation of observations and simulations.23 On the other hand, the presented model is based on sound and reasonable physical assumptions and rigorous mathematical modelling
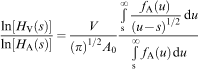
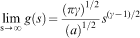
the presented model reveals that HA and HV are generally not parallel in a Gumbel probability plot and thus rendering one of the key assumptions in the Murakami model false in a strict mathematical sense. However, they are asymptotically (s→∞) parallel
the presented model is not limited to γ = 1/2
the presented model can estimate any desired quantile and interval, while the Murakami model is limited to point estimates of the return level.
Application example
The purpose of this section is to demonstrate the application of the presented model. Some of the practical aspects are also discussed with respect to the Murakami model. In that regard, γ = 1/2 was adopted such that these two models are conveniently comparable. The data were obtained from a light microscopy investigation of a modified 20MnCr5 steel alloy performed by Thumser et al.,24,25 where mostly near spherical inclusions were reported. Data points (115) sampled from reference areas of size A0 = 19·1 mm2 were used in this example. The data were areas (μm2) of the sectional circles observed on the microscopy images.
First, the data were power transformed and then fitted to HA (Gumbel distribution) by means of maximum likelihood. The parameters were estimated to be  and
and  , and the data seemed to be reasonably well described by the distribution function. A probability plot of the fit is presented in Fig. 2.
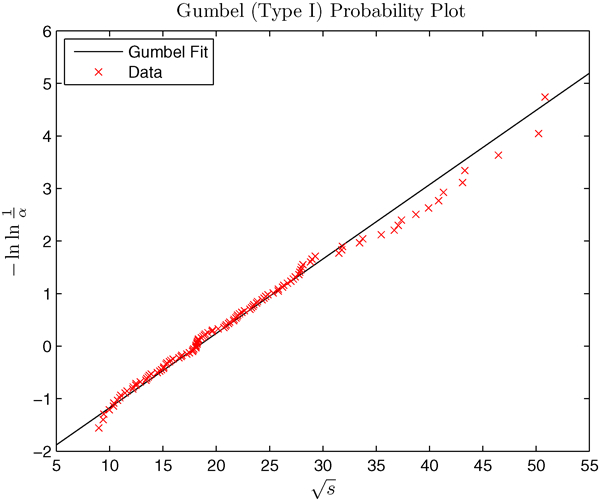
Gumbel probability plot of inclusion data by Thumser et al. fitted to HA
Next, HV may be determined for any desired target volume. In this example, HV was determined for the target volume V = V0. In this manner, the key assumption of the Murakami model may be evaluated for this case. The results are presented in a Gumbel probability plot in Fig. 3.

Plot of HA,
and HV for target volume V = V0
As can be seen from Fig. 3, the models agree to some extent for this particular case. However:
it is apparent that  and HV are not parallel in general and especially in the ‘beginning’
 and HV appears to be asymptotically parallel; this is consistent with earlier discusstions and the results of Takahashi and Sibuya10–12,19
 appears to be more conservative, i.e. predict larger inclusions for the same probability level, than HV. Moreover, the difference stabilises due to the asymptotic parallelism.
The last point is rather curious. Recall that the Murakami model utilises the return period concept to make inference. In fact, the return level corresponds to a point estimate of a certain quantile that asymptotically approaches exp(−1)≈0·368. This quantile may be considered non-conservative when compared with more conventional design rules that utilise the median. However, the distribution function  turns out to be conservative. Thus, the predictions made by means of the Murakami model is a combination of a conservative procedure and a non-conservative procedure, and the final outcome is not apparent.
In order to investigate ‘the actual’ predictions made by the Murakami model, the ratio of the estimated return level and the point estimate in equation (18) (γ = 1/2) for the median (α = 1/2) was plotted against the return period T = V/V_0. The result is presented in Fig. 4.
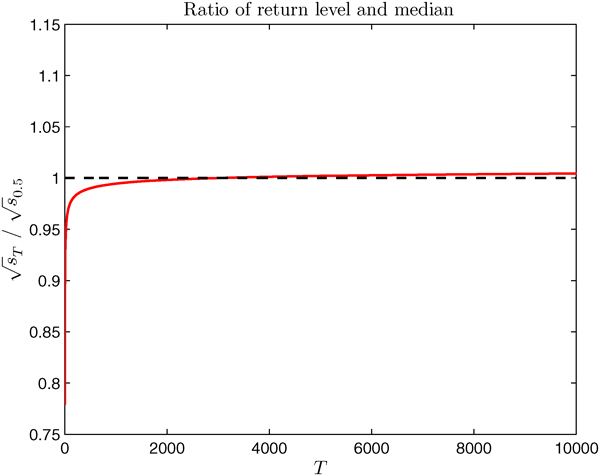
Plot of ratio between return level (sT)1/2 and actual median (s0·5)1/2 against return period
The result is intriguing; it turns out that the return level is in fact approximately a point estimate of the actual median when T is sufficiently high. However, a generalisation of this observation is not yet available.
Discussion
In the present paper, a comprehensive model for extreme value analysis of spherical inclusions in metals based on data obtained from light microscopy is presented. Special attention is paid to adopting proper and consistent mathematics while omitting ad hoc solutions.
An assumption in the presented model is that the inclusions are spherical in shape. This assumption is absolutely necessary to relate the observed sectional circles on a surface to the inclusions in the volume. This is basically due to the need to uniquely identify the shape of a three-dimensional object based on a random cross-section of that object. This is rather trivial for spheres but impossible even for random spheroids,26,27 let alone ‘amoebic’ inclusions. However, there are certain limited cases where a modified version of the presented model may be applicable for non-spherical inclusions. One such case is when a material with spherical inclusions undergoes rolling into a bar and the inclusions are drawn out into prolate spheroids with the same orientation throughout the material. However, the presentation of this modification is left out from this initial paper.
It was implicitly assumed that the inclusions originated from a single population. However, real materials may contain several types of inclusion,28 i.e. mixed population. That said, it is foreseeable that only one type would dominate the largest inclusions in a sufficiently large volume (or area). Thus, the practical importance of considering mixed populations in extreme value problems is limited.
Although the discussion in the present paper was focused on inclusions, the presented model is applicable for any material with spherical defects such as pores and cavities.
Furthermore, asymptotic extreme value theory was utilised in the parametrisation of the distribution function FA presented in equation (4). This requires the reference area A0 to be sufficiently large for the asymptotic approximation to be valid. Whether this requirement is met in practice is always an open question.
Finally, the authors realise that the presented model bears many mathematical similarities with the work of Takahashi and Sibuya.10–13,19 However, there are some principal differences that may be significant in practical applications. For instance, Takahashi and Sibuya developed their model within a parametric framework. That is, they assumed that the areas of the grand circles followed a generalised gamma distribution. In the presented model, assumptions regarding unobserved data are avoided. Instead, the observed data (sectional circles) are assigned a distribution function based on asymptotic extreme value theory. Therefore, the presented theory should be more general.
Conclusions
This paper may be concluded as follows.
An alternative and comprehensive statistical model for inclusion characterisation has been presented.
The presented model offers a transparent procedure in inclusion analysis when data sampling is based on block maximum methods.
The presented model aims at simplifying and clarifying the link between the observations on polished surfaces and the actual material state with respect to inclusions.
The presented model may be considered as an extension to and simplification of current methods and models.
Footnotes
Acknowledgements
The authors would like to acknowledge PhD R. Thumser from the Institute of Materials Research and Testing, Bauhaus-University Weimar, for discussions and making the raw data from light microscopy investigations available.