
Abstract
Undercooled solidification of hypoeutectic Ni–3·3 wt-%B alloy has been studied. The microstructure evolution of Ni–3·3 wt-%B alloy indicates that a transition from regular lamellar eutectic to anomalous eutectic exists with increasing undercooling for eutectic transformation. Here, a new model was proposed to describe the cooling curves of undercooled solidification with two-step transformation. Fits of the present model to the cooling curves after different undercoolings show that the predictions of transformed fractions are compatible with the microstructure observation. Furthermore, for hypoeutectic alloy, the size of the primary phase mainly depends on the undercooling for primary solidification, while the fraction of the primary phase mainly depends on the undercooling for eutectic solidification.
Introduction
As a classical eutectic alloy, Ni–Ni3B alloy acts as an important basis for studying the solidification of multicomponent soft magnetic materials, e.g. FeNiB and FeNiPB alloy.1–4 The phase diagram of Ni–Ni3B alloy is shown in Fig. 1.5 About 50 years ago, Shapiro and Ford studied orientation and interfacial relations for Ni–Ni3B eutectic in the near equilibrium solidification of hypoeutectic and hypereutectic Ni–Ni3B alloys (B<5wt-%).6 In order to study the effect of additions on solidification behaviours, Ajao et al. rapidly quenched several Ni–Ni3B (0<B<5 wt-%) alloys by melt spinning.7,8 Later, Idzikowski and Szajek9 and Ohodnicki et al.10 studied the structure and stability of NiB, Ni2B, Ni3B and Ni23B6 phases, further showing that Ni23B6 is highly unstable at low temperatures. More recently, Kamaeva and Lad'yanov studied the Ni–Ni3B system, where a metastable phase can be formed, provided the maximum rates of 104–103 K s−1 and the boron concentration of 19·9 at-% are guaranteed.11 However, these authors neither studied the rapid solidification of undercooled Ni–Ni3B alloys nor further reported the peculiarity of cooling curve of undercooled solidification, which, as far as we know, plays an important role in analysing quantitatively the solidification.12,13 So far, reports about undercooled solidification of Ni–Ni3B alloys are still rather sparse, and the effects of the undercoolings on the final structure are not clear yet. In the present study, undercooled solidification of hypoeutectic Ni–3·3 wt-%B alloy with different undercoolings will be studied.

Phase diagram of Ni–Ni3B alloy
The study of cooling curves for undercooled bulk melts is of fundamental interest in itself and in better understanding the rapid solidification process. Many studies of cooling curves in undercooled solidification experiments have been reported.14–18 Saleh and Clemente proposed a model for the cooling curves of spherical undercooled liquid metallic samples by which the solidification of a zirconium sample was studied.14 Emadi et al. analysed the cooling curve of Al–Si alloy using the computer aided cooling curve analysis method.15 Gandin et al. predicted the cooling curve for the solidification of Al–Cu alloys with the equiaxed solidification model.16 So far, most of the models describe the cooling process by a differential equation, which needs complex iterative computations.14–18
In fact, the thermal history of solidification can be regarded as a cooling process without transformation plus a transformation process without cooling.13 On this basis, an analytical approach combined with the heat flow equation and the classical Johnson–Mehl–Avrami–Kolmogorov (JMAK) equation is developed, which will be used to describe the two-step transformation such as for hypoeutectic alloy solidification. Here, the model will be testified using the experimental results from the solidification of Ni–3·3 wt-%B alloy.
Experimental
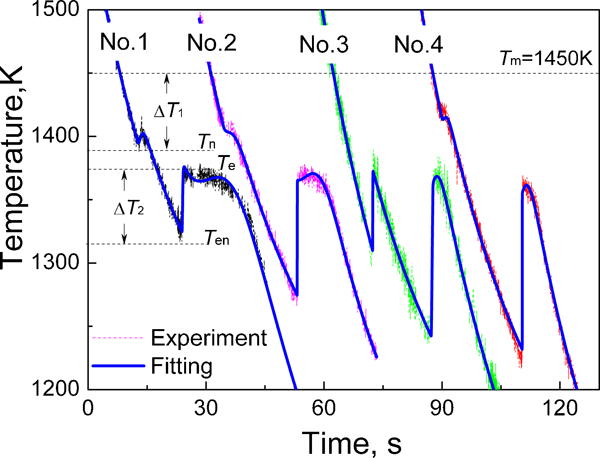
To study the hypoeutectic Ni–Ni3B alloy, high purity Ni (99·98 wt-%) blocks and B (99·999 wt-%) pieces were mixed with the composition of Ni–3·3 wt-%B alloy immersed in the molten B2O3 glass slag in a quartz crucible. The crucible was placed in the middle position of the high frequency induction coil located in a vacuum chamber. After the vacuum chamber was evacuated to 10−6 mbar and backfilled to 600 mbar with high purity Ar gas, the sample was cyclically superheated with a superheating 100–200 K until a desired undercooling was achieved. The thermal history of the sample was monitored by a one colour pyrometer with a constant emissivity of 0·85. The relative accuracy and response time are 10 K and 10 ms respectively. A calibration was thus required to calculate the actual temperature T using the equation 1/T = (1/Tpyr)+(1/Tm)−(1/ ), where Tpyr is the temperature recorded by the pyrometer,
  is the melting point measured by the pyrometer and Tm is the melting point read on the phase diagram.16 A solution consisting of 5 g FeCl3, 10 mL HCl and 50 mL H2O was used to etch the as solidified specimens for morphology observation.
Mathematical formulation
Description of heat flow
To describe the cooling curves of a given specimen, the following hypotheses are made:
specimen undergoing solidification is spherical
values of specific heat in the solid and liquid phases are taken to be constant and equal
solidification in the present study is assumed to be completed within a short freezing range, where the rate of heat extraction can be considered as constant
contribution from radiation is neglected
temperature gradient inside the particle is neglected during cooling.
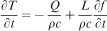
On this basis, the thermal history can be calculated by solving the differential heat flow equation13

For multitransformation, such as hypoeutectic alloy solidification, equation (2) can be rewritten as
Description of cooling curve
In order to make the non-isothermal solidification process compatible with the JMAK equation,18–20 some basic assumptions are made:
isothermal transformation and hard impingement (due to random nuclei dispersion) are assumed, where the solid fraction depends only on the time
once nucleated, the positions of the grains remain fixed (the role of fluid flow is ignored)
the growth rate is constant
both dendritic and eutectic grains are assumed to be equiaxed and enveloped within a sphere
coalescence and dissolution of the growing grains are ignored.
For the primary solidification, the primary grains often have similar sizes, and the corresponding growth rate often depends on the diffusion coefficient,18,20 so that site saturation nucleation and three-dimensional diffusion controlled growth are assumed, i.e. n = 1·5.18 Thus, the transformed fraction of the primary phase can be given as13
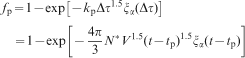
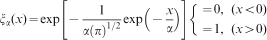
For eutectic transformation, the limited process is expected to be diffusion at the growth front, and thus, the interface controlled growth mode can be assumed, corresponding to a JMAK exponent 3.19 In combination with the assumption of site saturation nucleation, the transformed fraction of eutectic phase can be expressed as
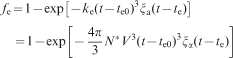
As is known, the cooling curve without transformation can be described by Φ = (T0−Text)exp [−hext(CpR/3)−1(t−t0)]+TG = Aexp (−Bt)+TG (see Ref. 16). From equation (2), for a cooling curve of hypoeutectic alloy, the part of primary solidification can be expressed as


Description of total transformed fraction
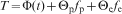
The total transformed fraction reflects the total solid fraction in solidification. Recently, a baseline method has been proposed to predict the total transformed fraction directly from the cooling curve.12 Now, with the present method, the cooling curve T(t) has been described by equation (3) or (9), and then the expression of transformed fraction for multitransformation can be approximated as

For the cooling curves of the hypoeutectic alloy in Fig. 2, the baseline can be expressed as12

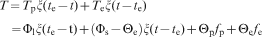
Cooling curves of experiments and fitting results for Ni–3·3 wt-%B alloy
Thus, the problem of describing the transformed fraction of multitransformation can be solved by the present method.
Results and discussion
Cooling curves and cross-sectional microstructures
Since the nucleation undercooling is affected by the glass fluxing degree, different fluxing degrees will result in different cooling curves and microstructures. Cooling curves and as solidified micrographs corresponding to different undercoolings of Ni–3·3 wt-%B are shown in Figs. 2 and 3 (where the dark phase is α-Ni solid solution, and the bright phase is Ni3B compound) respectively. The undercooling for primary solidification ΔT1 is equal to the difference between the melting point Tm (about 1450 K here) and the initial nucleation point Tn (Fig. 2). The undercooling for eutectic solidification ΔT2 is equal to the difference between the equilibrium eutectic temperature Te (about 1366 K here, Fig. 1) and the start temperature for eutectic transformation Ten (Fig. 2).
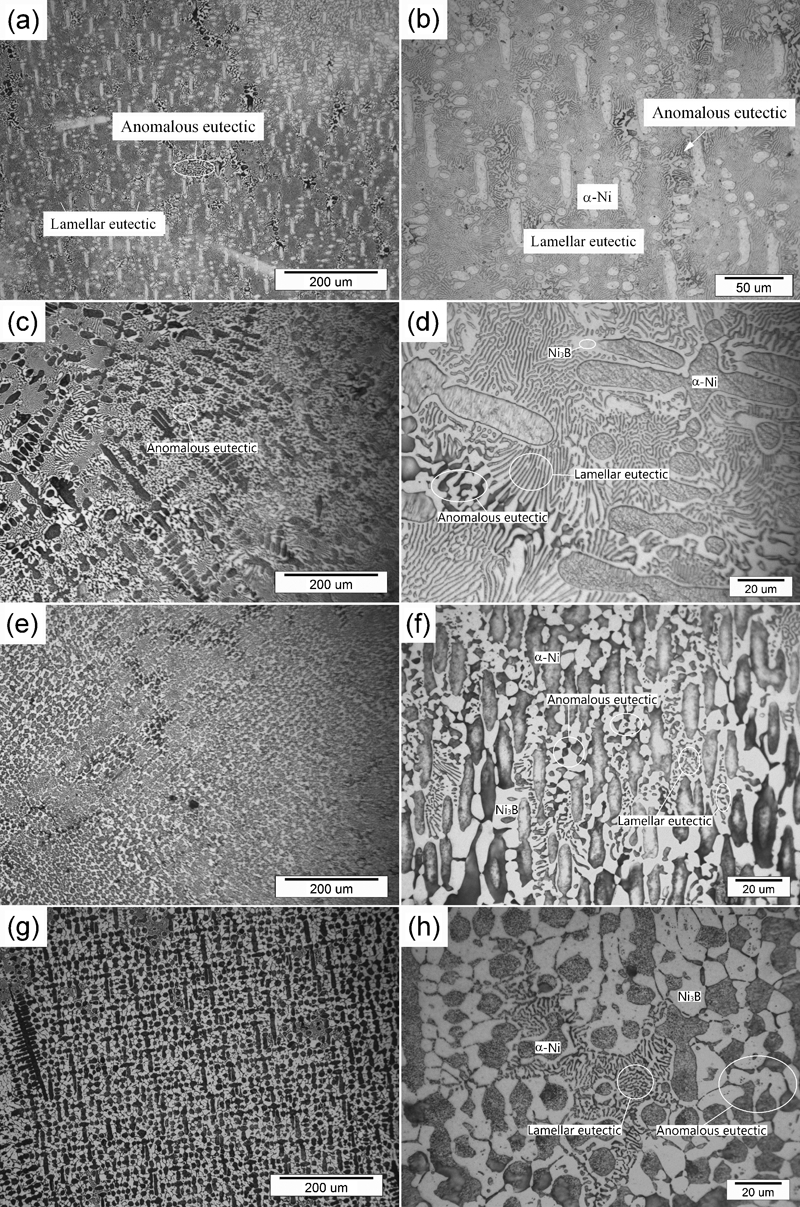
Cross-sectional micrographs of Ni–3·3 wt-%B alloy samples
From the cooling curve of sample 1, primary solidification occurs at ΔT1≈60 K (1450−1390 K), where the α-Ni primary phase forms according to the phase diagram (Fig. 1).5 The eutectic solidification is initiated at ΔT2≈50 K (1366−1316 K), where the Ni–Ni3B eutectic forms according to the phase diagram (Fig. 1). Therefore, the microstructure consists of α-Ni dendritic phase, regular lamellar eutectic (Ni–Ni3B) and trace of anomalous eutectic (see Fig. 3a and b).
From the cooling curve of sample 2 (Fig. 2), where ΔT1 changes few, but ΔT2 is substantially enhanced, ΔT1 = 40 K and ΔT2 = 103 K. Accordingly, the fractions of α-Ni dendritic phase and anomalous eutectic increase, in contrast with a decreased fraction of the regular lamellar eutectic (Ni–Ni3B) (see Fig. 3c and d). For sample 3, ΔT1 = 150 K and ΔT2 = 138 K, the fractions of α-Ni and anomalous eutectic further increase, in contrast with a decreased fraction of lamellar eutectic (see Fig. 3e and f). For sample 4, ΔT1 = 32 K and ΔT2 = 150 K (Fig. 2), the microstructure is prevailed by the dendritic phase (α-Ni), the granular grains (Ni3B, which is a part of anomalous eutectic) and the lamellar eutectic (see Fig. 3g and h).
The quantity image analysis software ImageTool 3·0 (http://www.bio-soft.net/draw/ImageTool.htm) was used to obtain area fraction measurements from the micrographs. This measurement is made based on the gray value of the pixels to differentiate between the bright Ni3B and the dark α-Ni phases (the details can be found in Ref. 12). As such, the fractions of the primary phase (α-Ni) for samples 1–4 (Fig. 3a–h) are measured to be 23–29, 32–40, 45–52 and 45–55% respectively.
Combining the results of microstructures and the cooling curves of Ni–3·3 wt-%B alloy, sizes and fractions of various phases are connected with the values of ΔT1 and ΔT2.
For the primary solidification, ΔT1 varies following a tendency as sample 4<sample 2<sample 1<sample 3. The sizes of the primary phase decrease with the increase in ΔT1, but the fractions (primary phase α-Ni) do not follow this order (Fig. 3). From the measurement, the fraction increases with the increase in ΔT2. Probably, after the first recalescence, the growth of the primary phase does not stop until the eutectic reaction starts.
For the eutectic transformation, ΔT2 varies following a tendency as sample 1<sample 2<sample 3<sample 4. The fraction of regular lamellar eutectic decreases following this order in contrast with an increased fraction of anomalous eutectic (Fig. 3). It indicates that the formation of the anomalous eutectic is mainly dependent on ΔT2.
When ΔT2 is <138 K, the anomalous eutectic contacts each other to form a network (Fig. 3a–f). When ΔT2 reaches about 150 K, the anomalous eutectic appears as granular of α-Ni and Ni3B, which seem independent of each other. Since the microstructure evolution for Ni–3·3 wt-%B alloy is similar to that of Ni–Sn eutectic alloy,21 the growth kinetics of anomalous eutectic can be analogously explained as follows: α-Ni phase forms in the first recalescence, then Ni3B nucleates and grows in the second rapid recalescence, while α-Ni phase is remelted and leads to the morphology of anomalous eutectic network.
Cooling curve description
To describe the cooling curves by equations (7)–(9), with sample 3 taken as an example, the fitting process is explained through Fig. 4:
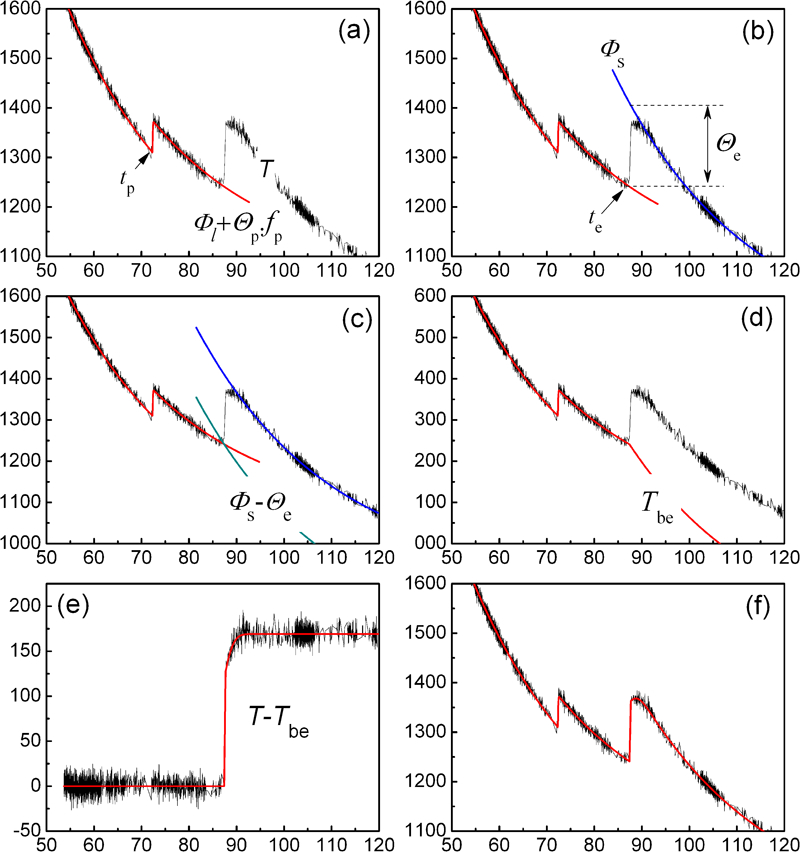
Fitting process of cooling curve for Ni–3·3 wt-%B alloy (sample 3)
fitting the primary solidification (the first recalescence of cooling curve, Fig. 4a) with equation (7), the values of Al, Bl, TGl, kp and Θp are determined13
fitting the solid state of the cooling curve by equation (8b) (Fig. 4b), the values of As, Bs and TGs are obtained
elongating Φs to t = te, the value of Θ e [ = Φs(te)−Tp(te)] can be determined (Fig. 4c)
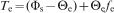
moving the curve Φs down Θe, the baseline (cooling curve without transformation) for eutectic transformation can be obtained, Tbe = Φlξ (te−t)+Θpfp+(Φs−Θe)ξ(t−te) (Fig. 4d)
subtracting the baseline Tbe from the original cooling curve T, the eutectic transformation without cooling Θefe ( = T−Tbe) is obtained (Fig. 4e)
fitting the curve of eutectic transformation in Fig. 4e by the expression of Θefe (equation (8)), the parameters ke and te0 can be determined. Then, by substituting all the parameters into equation (9), the expression of the cooling curve is obtained (Fig. 4f). Note that all the fitting parameters should be kept positive, which ensures the unique value for the result.
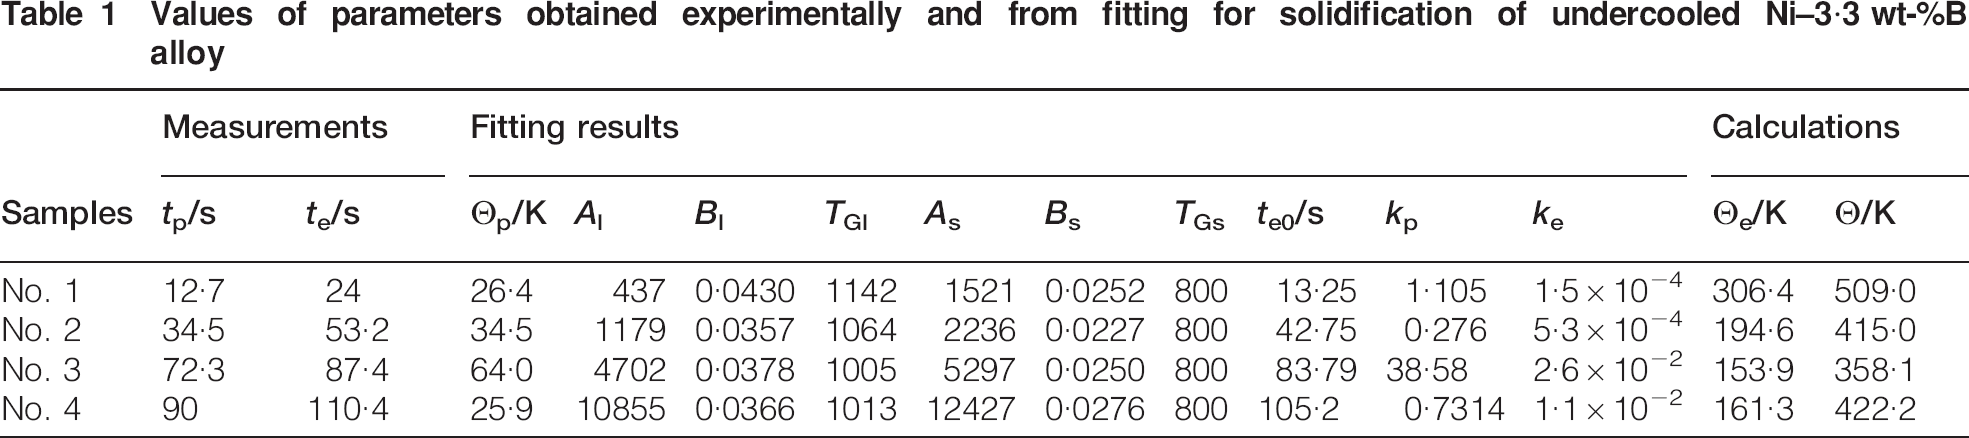
As shown in Fig. 2, all the cooling curves of the Ni–3·3 wt-%B alloy samples are fitted well by the present model. From the fitting results in Table 1, we can find that the parameters of the model vary with the undercooling. The constants Al, Bl, TGl, As, Bs and TGs do not need to be discussed as they are just associated with the onset of record times or the cooling rates (for the present experiment, the cooling rates do not change obviously for different samples). It can be seen that the values of both kp and ke increase with the increase in the corresponding undercooling, which coincides with the fact that the transformed rate increases with undercooling. If the growth rate is known from the measurement, the amount of (pre-existing) nuclei per unit volume can be determined from equation (4) with the value of kp. In addition, the value of Θe decreases with the increase in ΔT2. One of the reasons is that the specific heat, ρc, increases with the increase in ΔT2;22 another one is that the fraction of residual liquid for eutectic transformation depends on the fraction of the primary phase, i.e. the more primary phase, the smaller Θe. Figure 5a and b shows the fitting results of the transformed fractions for the primary and eutectic phases by equations (7c) and (8c) respectively. It is obvious that the transformed rate increases with the increase in ΔT1 (Fig. 5a). Compared with the microstructures in Fig. 3, it suggests that with ΔT1 increasing, both the transformed rate and the remelted faction of the primary phase will increase,23 so the size of the primary α-Ni decreases until the shape of that becomes equiaxed.
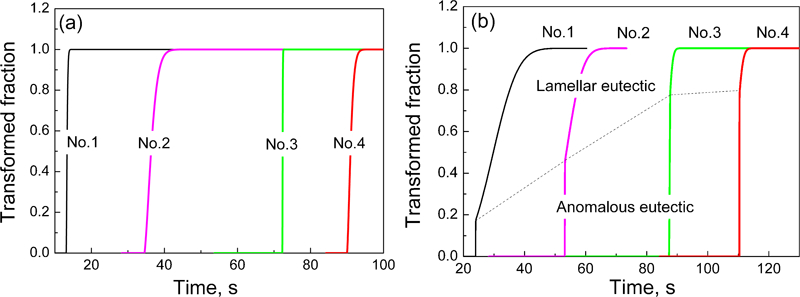
Transformed fraction upon undercooled solidification of Ni–3·3 wt-%B alloy subjected to different undercoolings
Values of parameters obtained experimentally and from fitting for solidification of undercooled Ni–3·3 wt-%B alloy
For the eutectic transformation, since many studies have confirmed that an anomalous eutectic forms at the rapid recalescence stage,21–26 the larger ΔT2, the more anomalous eutectic will be obtained. As shown in Fig. 5b, the fitting result of the present model also shows that the fraction of regular eutectic decreases with the increase in ΔT2, while the anomalous eutectic increases.
Total transformed fraction
The total solid fractions calculated from equation (10) are shown in Fig. 6a, where the predicted fractions for the primary phase are 39, 50, 56 and 60%, for the anomalous eutectic are 12, 26, 36 and 30% and for the regular lamellar eutectic are 49, 24, 8 and 10%, for samples 1–4 respectively. From the predicted results, both the fraction of primary phase and the value of ΔT2 increase gradually from samples 1 to 4, so the fraction of the primary phase is mainly dependent on ΔT2.
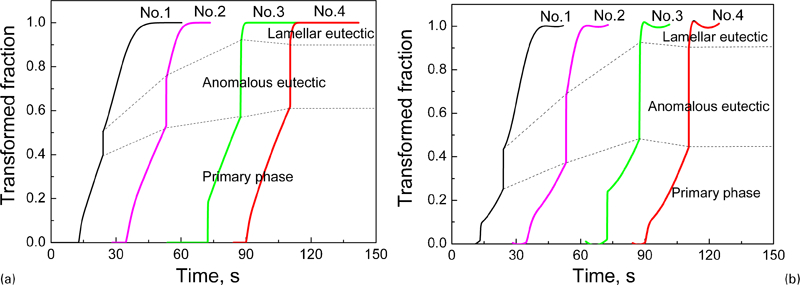
Estimation of total transformed fraction upon undercooled solidification of Ni–3·3 wt-%B alloy subjected to different undercoolings
As a comparison, the linear baseline in Ref. 12 is used for the present calculation
The calculated results from equation (12) are shown in Fig. 6b, where the predicted fractions for primary phase are 25, 38, 48 and 45%, for the anomalous eutectic are 19, 21, 44 and 46% and for the regular lamellar eutectic are 56, 31, 8 and 9%, for samples 1–4 respectively. It can be found that the fraction of the primary phase from equation (12) is smaller than that from equation (10). From the microstructure in Fig. 3, the results from equation (12) are much closer to the experiment results. It is mainly because equation (12) takes the effect of the solid fraction into account. Except for ignoring the effect of solid fraction, the result from equation (10) with a larger error may also be due to the relatively larger range of the parameters (A, B and TG) for the baseline description.
Although the phase fractions predicted from equations (10) and (12) are different, the changing tendencies of fractions for the primary phase, the lamellar eutectic and the anomalous eutectic with undercooling, predicted from both equations (10) and (12), are in agreement with the microstructure evolution (Fig. 3). Therefore, the solidification process of hypoeutectic Ni–3·3 wt-%B alloy can be described approximately by equations (7)–(9). The phase fractions can be estimated by equation (10), and the more accurate results can be obtained by equation (12).
Conclusions
Microstructure evolution of hypoeutectic Ni–3·3 wt-%B alloy shows that a transition from regular lamellar eutectic to anomalous eutectic exists with the increase in ΔT2. An analytical model for describing the cooling curves of the hypoeutectic alloy (with two-step transformation) is established. Applying the model to the solidification of Ni–3·3 wt-%B alloy, the cooling curves can be fitted well, and the transformed fractions can be predicted; the estimated phase fractions of the primary and eutectic phases and the changing tendencies of these phases are broadly consistent with the microstructure observation. The result also indicates that the fraction of the primary phase mainly depends on ΔT2, while the size of the primary phase mainly depends on ΔT1.
Footnotes
Acknowledgements
The authors are grateful for the financial support of the Free Research Fund of State Key Laboratory of Solidification Processing (grant nos. 09-QZ-2008 and 24-TZ-2009), the 111 Project (project no. B08040), the Natural Science Foundation of China (grant nos. 50901059, 51071127 and 51134011), the China National Funds for Distinguished Young Scientists (grant no. 51125002) and the National Basic Research Program of China (973 Program) (grant no. 2011CB610403). J. F. Xu expresses thanks to D. Zhang and Z. C. Pu for their help in the present work.