
Abstract
The degradation of the fracture toughness of high strength low alloy steels is attributed to the formation of ‘local brittle zones’ in the welded joint. These local brittle zones are mainly located within the coarse grained heat affected zone (CGHAZ) and the intercritically reheated CGHAZ (ICCGHAZ). Cracking and debonding of M-A constituents from the surrounding matrix are generally accepted as initiation events of fracture in the ICCGHAZ. In the present work, the low temperature fracture toughness of X80 pipeline steel was examined. The main purposes were (i) to evaluate possible crack initiation sites of cleavage fracture and (ii) to identify the mechanism by which M-A constituents deteriorate the ICCGHAZ toughness. The results revealed that the microstructure of ICCGHAZ contained blocky M-A constituents along prior austenite grain boundaries. Finally, it was shown that fracture initiation occurred preferentially at M-A constituents by a debonding mechanism rather than cracking of the M-A constituents.
Keywords
Introduction
High strength low alloy (HSLA) steels with yield strength higher than 550 MPa have been increasingly used for high pressure pipeline operation and offshore structural installation. The installation of pipelines used for transporting oil and gas is sometimes taking place in severe environments, such as in the arctic region, where the pipelines must have low temperature toughness.1 Thus, the major motivation for the improvement of HSLA steels has been provided by the demand for higher strength as well as improved toughness, ductility and weldability at low temperatures.2,3
The HSLA steels combine excellent tensile strength and ductile to brittle transition properties. However, the balance of high strength and toughness can be deteriorated by welding thermal cycles, producing local poor toughness in the welded joints.4 The heat affected zone (HAZ) is in many cases considered to be the most critical part of a weld.5
The region of lowest toughness after single pass welding is the coarse grained HAZ (CGHAZ). The main reason for this is attributed to the formation of unfavourable microstructures, such as coarse ferrite side plates (upper bainite and widmanstätten ferrite).6 During multipass welding, the intercritically reheated CGHAZ (ICCGHAZ) is formed by reheating the CGHAZ into the mixed austenite and ferrite region (between Ac1 and Ac3). Thus, parts of the microstructure were transformed into austenite, which nucleated and grew preferentially along the prior austenite grain boundaries and bainite lath boundaries.7 These austenite islands became enriched in carbon due to the high diffusivity of carbon in ferrite and its high solubility in austenite, and they transformed to hard and brittle M-A constituents during the subsequent cooling stage,5 leaving a necklace type of M-A distribution along prior austenite grain boundaries.8
The ICCGHAZ formed during multipass welding may have even lower toughness than the CGHAZ. It seems that the formation of M-A constituents along prior austenite grain boundaries is the most important reason for the loss in toughness.5,9,10
With respect to the shape of the M-A constituents, they can be classified into two main types: (i) elongated (or stringer like) M-A constituents with L/W>3, and (ii) massive (or blocky) M-A constituents with L/W<3 (L: length, W: width). It has been reported that massive M-A constituents deteriorate the low temperature toughness of ICCGHAZ seriously.11,12
Four possible fracture mechanisms have been proposed in the literature to explain cleavage initiated by M-A constituents.7,9,13
M-A constituent is brittle phase and cracks readily: This microcrack initiates cleavage in ferrite matrix
Previous works have shown that the M-A constituents can act as initiation sites for cracks and also promote their propagation.4,14 At low temperatures, the blocky M-A constituents increase the matrix stresses close to the interface between the M-A constituents and the matrix and may cause cleavage crack initiation.15 Stringer type M-A constituents have been shown to crack readily and provide no effective obstacle to crack propagation.6
Transformation induced residual tensile stresses are produced in surrounding ferrite matrix, assisting cleavage fracture
Austenite forms at prior austenite grain boundaries and transforms to M-A constituents during cooling. The volume expansion related to this transformation results in elastic and plastic stress concentrations in the surrounding matrix, assisting cleavage fracture. In the case of the closely spaced blocky M-A constituents, the stress and strain concentrations will be magnified because the transformation induced stress fields overlap.
M-A has higher hardness than surrounding ferrite and causes stress concentration in neighbouring ferrite matrix: This stress concentration assists cleavage fracture
The hardness of the M-A constituents is significantly higher than that of the surrounding matrix, and during deformation, the stress concentration increases due to this hardness difference. During loading, the matrix will start to deform plastically, and an internal stress can be generated in the matrix close to the M-A constituents. A large stress will develop across the interface and may cause the M-A constituents to debond from the matrix.7,13,14 In addition, it has been suggested that the M-A constituent/matrix interface may be weakened by carbon segregation.16
Microcrack that is formed at M-A/matrix interface through interface decohesion can initiate fracture through interfacial decohesion that propagates either in brittle manner or via linking with other debonded regions
The main purpose of the present paper is to reveal the mechanism by which M-A constituents deteriorate the HAZ toughness. Brittle fracture crack initiation and propagation in the ICCGHAZ of the arctic steel X80 are examined. By analysing the fracture mechanisms, the effect of M-A constituents on the fracture toughness will be investigated.
Experimental
A commercial grade API X80 pipeline steel with the chemical composition given in Table 1 was selected for the present study.
Chemical composition of steel*/mass-
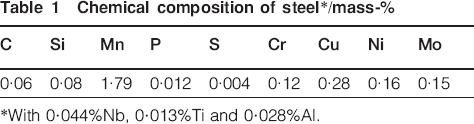
*With 0·044Nb, 0·013Ti and 0·028Al.
To simulate ICCGHAZ microstructures, specimens of dimensions 11×11×100 mm were cut with the longest dimension along the rolling direction and subjected to thermal cycles simulating double pass welding, applying a Smitweld TCS1405 weld simulator.
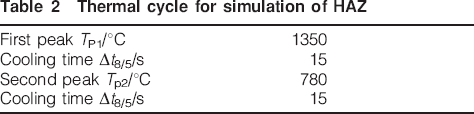
During the first cycle, the specimen was heated to 1350°C followed by cooling at a rate corresponding to a cooling time between 800 and 500°C (Δt8/5) of 15 s. The second heating cycle had a peak temperature Tp2 of 780°C, and the cooling rate was the same as during the first cycle (Table 2).
Thermal cycle for simulation of HAZ
After the HAZ simulation, crack tip opening displacement (CTOD) specimens were machined with a 5 mm deep through width notch cut into the sample and subjected to CTOD testing at 0, −30, −60 and −90°C. The microstructures of the ICCGHAZ were examined by optical microscopy with a Leica MEF4M and by scanning electron microscopy. Samples for light microscopy were mechanically prepared by conventional grinding and polishing techniques and etched by a Lepera solution [mixture of 4 Picral and 1 g Sodiumtiosulphate (Na2S2O3) in 100 mL distilled water in a 1∶1 ratio],17 which make the M-A constituents appear white. A Zeiss Supra 55VP low vacuum field emission scanning electron microscope (FE SEM) was used to observe the fracture surfaces and microstructures (operated at 20 kV, 82 μA and 30 μm aperture size). In order to obtain information about the chemical composition of second phase particles, energy dispersive X-ray spectroscopy (EDS) was performed with an EDAX Genesis spectrometer interfaced with the SEM microscope. In addition, the carbon concentration of the blocky M-A constituents was studied by wavelength dispersive spectroscopy in a JEOL JXA-8500 electron probe microanalyser (EPMA), operated at 10 kV, 50 nA in spot mode. A LDE6H crystal was used for this measurement.
For detailed analysis of the microstructure, transmission electron microscopy (TEM) was carried out on thin samples from the ICCGHAZ region. The thin samples were prepared from the fractured CTOD specimens using the focus ion beam (FIB) technique, applying a HELIOS NANOLAB 600 from FEI. The FIB thinning process of the sample included two steps: (i) thinning with ion beams (30 kV), starting with high currents, 460 pA, which successively was reduced to 50 pA, and (ii) final thinning with a box pattern with ions at 5 kV and 16 pA (∼1·5 min at each side) to eliminate all damage produced by FIB. The TEM observations were performed in a conventional JEOL-JEM 2010 microscope at 200 kV operating voltage.
The hardness of the M-A constituents and the neighbouring base metal was measured by a nanoindentation technique applying a Hysitron TI 750 UbiTM instrument with a performechTM control unit scanning nanoindentation system. The measurements were performed within the ICCGHAZ region (80×80 μm) of the sample after polishing and etching by Lepera solution, the step size being 4 μm. The Vickers microhardness was also measured using 5 gf (gram force) load in a Leica VMHTMOT instrument. In both cases, the indents were small enough (∼4 μm in diameter in the Leica) to predominantly sample either the M-A constituent or the matrix.
Results and discussion
Microstructure evaluation
The microstructures of the base metal and the simulated ICCGHAZ are shown in Figs. 1 and 2 respectively. The acicular ferritic microstructure of the base metal had transformed to upper bainite with a large prior austenite grain size during the weld thermal cycles. In Fig. 2, the prior austenite grain boundaries are decorated by a white phase that is also seen within the grains as smaller particles. The upper bainite is not revealed due to the special colour etchant (Lepera) that was used.
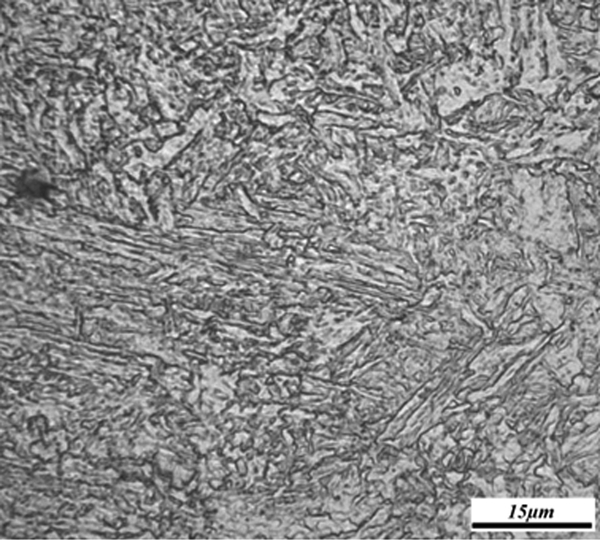
Microstructure of base metal
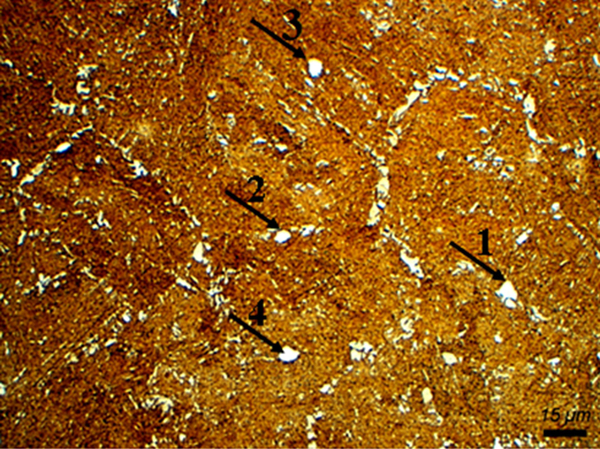
Optical microstructure of ICCGHAZ, M-A constituents indicated by arrow, Lepera etchant
As mentioned in the section on ‘Experimental’, the blocky-like M-A constituents can be revealed as a white phase using the Lepera solution as an etchant.17 Davis and King have also observed a case where the M-A constituents of the steel were shown as a white phase using the Lepera etchant.13 In the present work, blocky white particles can be seen in the microstructure of the simulated ICCGHAZ after etching by Lepera solution. These particles are shown in Fig. 2, indicated by arrows. It is seen that they are formed either along prior austenite grain boundaries (arrow numbers 1 and 2) or inside the grains (arrow numbers 3 and 4). According to earlier observations reported in the literature,13 it is reasonable to assume that these white particles are M-A constituents. They will therefore be called M-A constituents in the continuation of the present work.
The microstructure of the ICCGHAZ was also examined by FE SEM (see Fig. 3). The prior austenite grain boundaries can be observed clearly in this figure. Two main types of M-A constituents are identified in Fig. 3a–c. The blocky M-A constituents that are located at the prior austenite grain boundaries (arrow numbers 1 and 2) or inside the grains (arrow number 3) have a diameter of 3–5 μm, while the elongated M-A stringers (arrow number 4), formed between bainite and martensite laths, are ∼0·2–1 μm in width and 5–10 μm in length. In Fig. 3d, the blocky M-A constituents form a necklace-like structure that is located at prior austenite grain boundaries in a nearly connected network (arrow numbers 5 and 6). Li and Baker have also observed a case where the M-A constituents along the prior austenite grain boundaries were connected or nearly connected.7
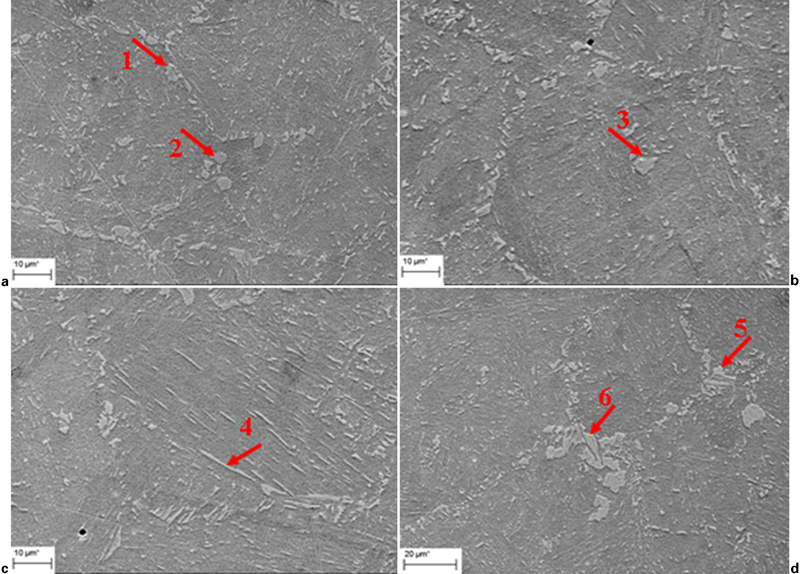
Images (FE SEM) from weld simulated ICCGHAZ region
The obtained fracture toughness (CTOD) values as a function of test temperature are presented in Fig. 4. It can be seen that the CTOD value increases with increasing test temperature; the lower and upper parts are associated with brittle and ductile fractures respectively.
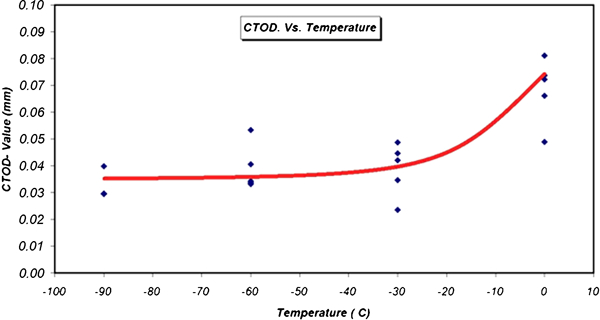
Variation of CTOD value with test temperature
Hardness and EPMA analysis
The mechanical properties of steel are highly related to its microstructure, the matrix phase and the distribution of secondary phases or particles therein. Nanomechanical testing has been increasingly used to provide a simple quantitative characterisation of such phases. One of the first and reliable applications of this method has been to measure local hardness variations within microstructure features. Figure 5 shows an SEM image of the area within the ICCGHAZ that was selected to measure local hardness variations by nanomechanical testing. The corresponding hardness mapping (Fig. 5b) shows that the hardness values of the M-A constituents are significantly higher than those of the neighbouring matrix. It can be seen that the hardness values of the blocky M-A constituents and the matrix were in the ranges 600–1200 HV (pink and white areas (view colour image in the online version)) and 300–500 HV (black area) respectively.
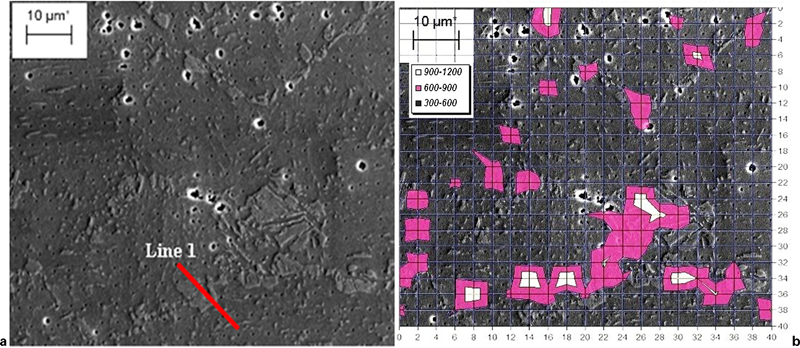
a image (SEM) of grid of nanoindents superimposed on M-A constituent in ICCGHAZ and b corresponding hardness mapping indicates that M-A constituents are locally harder than matrix
In addition, the hardness of 50 M-A constituents within ICCGHAZ was measured by the Vickers microhardness method with a 5 gf (gram force) load. The obtained hardness values are given in Table 3.
Vickers microhardness values of M-A constituent in ICCGHAZ/HV
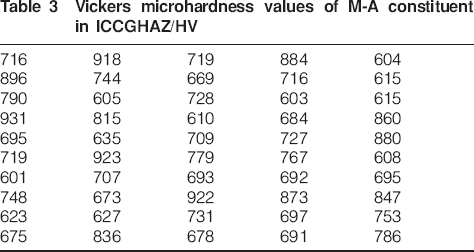
The hardness values of blocky and elongated M-A constituents have earlier been reported to be in the ranges 800–1200 and 600–800 HV respectively.16 The hardness values obtained in the present investigation (Table 3) are at a similar level (600–1000 HV). It can be seen that, in general, the blocky M-A constituents have significantly higher hardness values than the bainite matrix, indicating that they have high carbon content.
The strength and hardness of M-A constituents have earlier been shown to be related to their carbon content in a nearly linear manner,16 with carbon content within the range of 0·6–1·1 wt-.15,18 In the present work, the carbon concentration of M-A constituents was measured by EPMA linescan analysis (1 μm step length), choosing particles from the same area as that analysed by nanoindentation (Fig. 5a). An example of a linescan analysis along line 1 in Fig. 5a is illustrated in Fig. 6. This figure shows that the level of carbon is divided into three regions along this line. Region numbers 1 and 3 illustrate the carbon content in the matrix of this steel that contains 0·06 (Table 1). The carbon content of the M-A constituent was measured relative to the matrix (region 2). It can be seen that the carbon content in the M-A constituent was significantly higher than in the matrix and was identified to be ∼0·75 wt-. It can be concluded that the higher hardness values and the higher carbon content of the particles strongly strengthen the assumption that they really are M-A constituents.
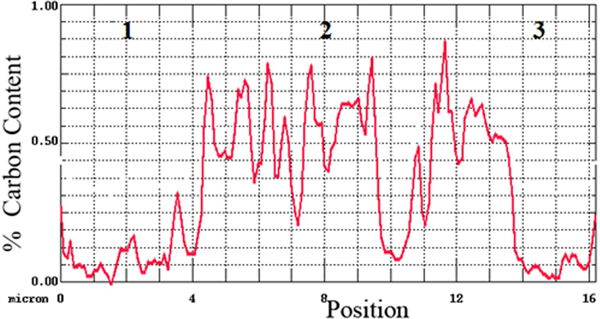
Linescan analysis (EMPA) from M-A constituent in ICCGHAZ
Fractography
Detailed fractographic examination was carried out on the CTOD samples with the purpose of classifying and evaluating possible cleavage crack initiation sites and microstructural features in the vicinity of these. An example of a cleavage initiation site is shown in Fig. 7 for test temperatures of 0°C (Fig. 7a and b) and −90°C (Fig. 7c and d). It can be seen that the particles have the smooth and blocky appearance typical of M-A constituents. These particles also correspond in morphology and size to M-A constituents. The typical river line patterns indicate that these particles are the initiation points of the cleavage cracks (Fig. 7a–c, arrows 1 and 3). The matching fracture surfaces show holes corresponding to the locations where the particles have been located and pulled out (Fig. 7b–d, arrows 2 and 4). These features are identical to those reported by Davis and King.13
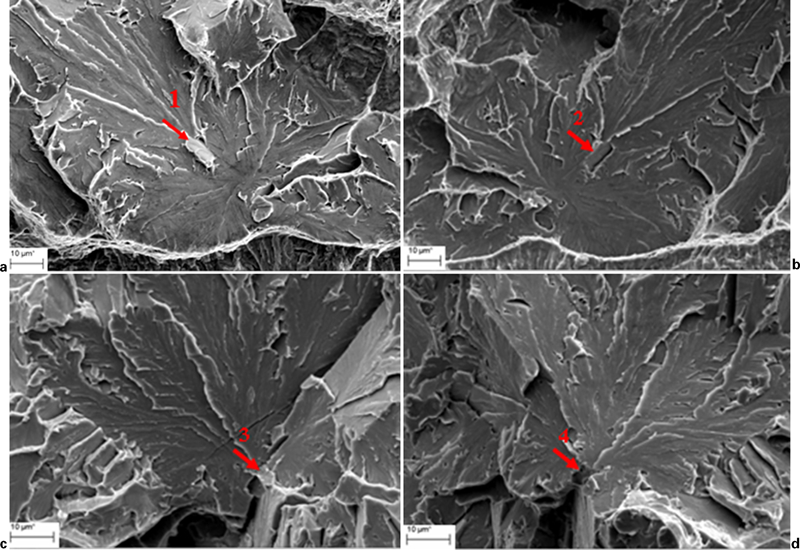
Fracture surfaces of specimens tested at different temperatures
The results of EDS analyses from the matrix and the particles are presented in Fig. 8 (same test conditions). As can be seen, there was no detectable compositional difference between these blocky features on the fracture surface and the matrix, which clearly indicates that they are not inclusions. In accordance with other published works,3 these observations demonstrate that the brittle fracture initiation occurs at blocky M-A constituents formed on prior austenite grain boundaries during the second thermal cycle. The fracture mechanism appears to be debonding between the M-A particle and the surrounding bainite matrix.
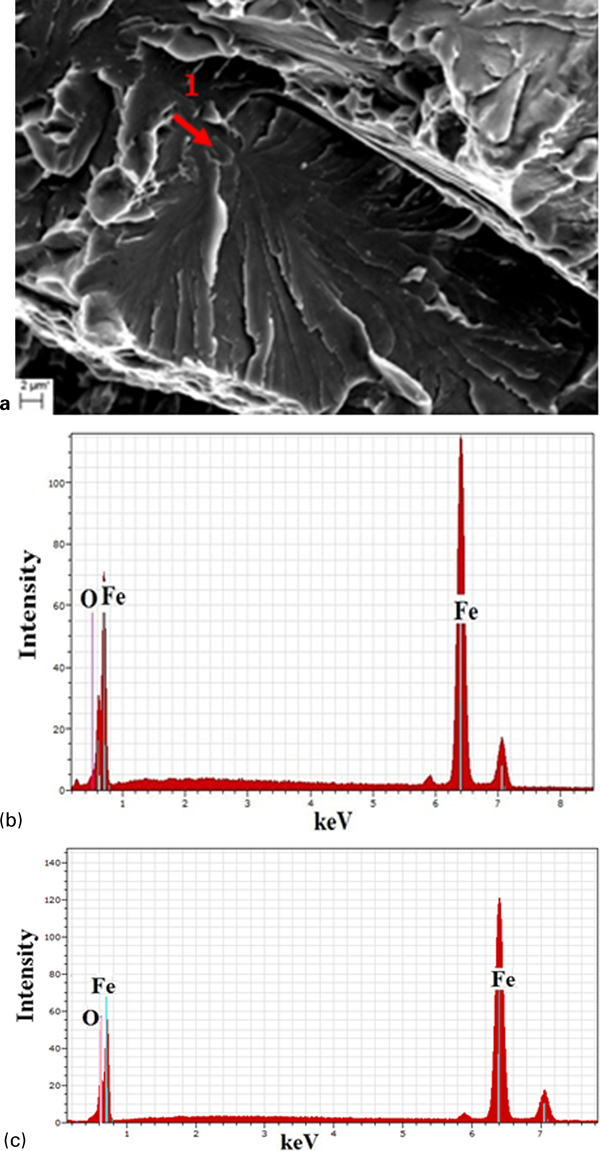
a fracture surface of specimen at −30°C, b EDS analysis of particle and c EDS analysis of matrix
In general, the initiation sites are found from the river line pattern radiating from each single initiation point. However, in some cases, mainly in the lath-like microstructure, the river pattern was rather diffuse, thus making identification of the initiation site difficult. A cleavage crack can be initiated from the area between two nearby M-A constituents. Davis and King observed a case where a necklace distribution of M-A constituents along prior austenite grain boundaries was associated with low impact toughness.13 They argued that the overlap of residual phase transformation stresses and the stress concentrations due to debonding of M-A constituents are of importance for brittle fracture initiation. In the present work, Fig. 9 shows a similar case in the fracture surface of the sample tested at −60°C. The figure shows an example of reinitiation occurring in the region between several blocky M-A constituents, indicated by arrows 2, 3 and 4. The region between the debonded M-A constituents has probably been constrained due to high local stresses, which can cause a microcrack to form. This microcrack has then propagated through the grain.
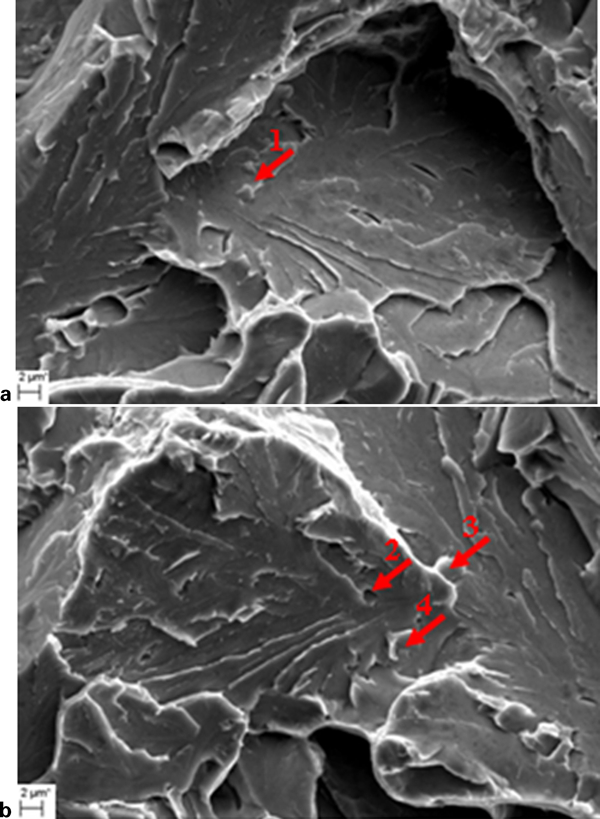
Opposite fracture surfaces of specimen CTOD tested at −60°C
A more detailed examination of the fracture surfaces revealed also the existence of non-metallic inclusions within same cleavage facets. As can be seen in Fig. 10, the particle indicated by arrow 1 may have acted as an initiation site (CTOD sample tested at −60°C). Energy dispersive X-ray spectroscopy point analysis revealed that the inclusion is an aluminium oxide (Fig. 10b).
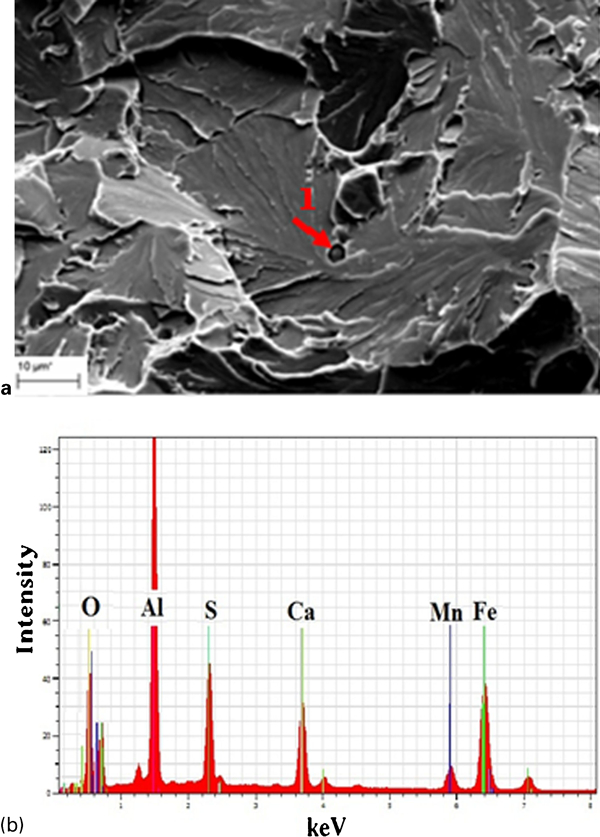
a fracture surface of specimen tested at −60°C and b EDS analysis of inclusion
In the present investigation, TEM was also employed to identify these particles. Figure 11 shows bright field and dark field images of the particle that is marked with an arrow in Fig. 7a. The bright field image in Fig. 11a shows that the particle is composed of twinned martensite. A selected area diffraction pattern from a volume including this twinned martensite region is shown in Fig. 11d. These two spots indexed 110t1 and 200t2 are from the two twin orientations respectively. The dark field images in Fig. 11b and c were recorded from twin spots 110t1 and 200t2 respectively. As can be seen, these images show opposite twin contrast. Twinned martensite is generally associated with high carbon martensite due to a significant enrichment of carbon in austenite. In total, this TEM observation, together with the previous results, proves that the particles located at cleavage crack initiation sites are M-A constituents.
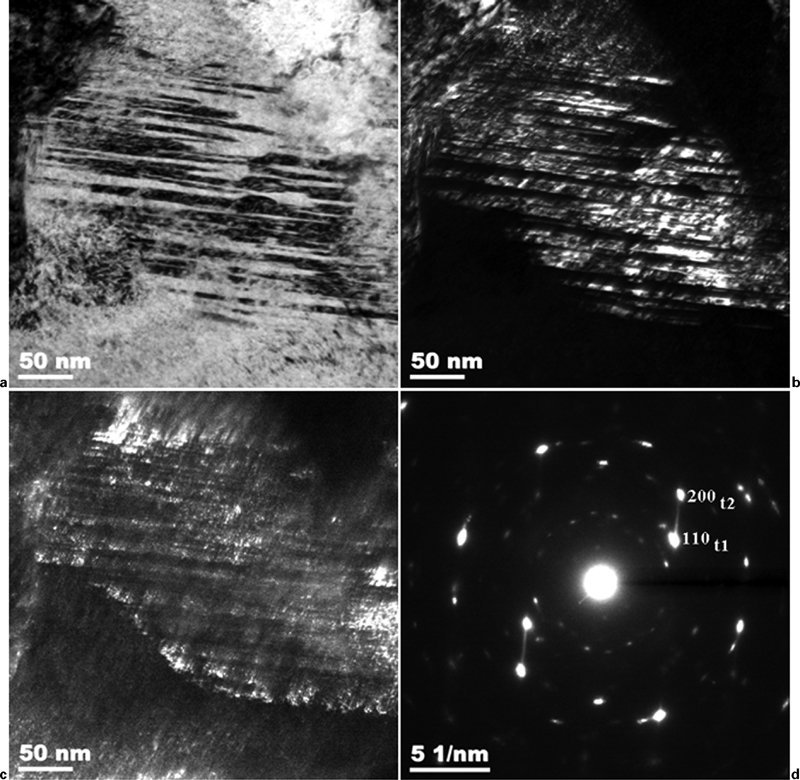
a–c bright field and dark field micrographs of twinned martensite and d selected area diffraction pattern of twin region: dark field image was obtained using indexed spots marked t1 and t2 in SAD pattern c
The mechanisms of crack initiation caused by the presence of M-A constituents are generally proposed to be the concentration and triaxiality of internal stresses close to the interface between the M-A constituents and the matrix. Two main different initiation sites of fracture in HSLA steels subjected to ICCGHAZ weld simulation have been reported: (i) debonding of the M-A constituent/matrix interface, and (ii) cracking of the M-A constituent.15,18 However, in the majority of cases, fracture facets had initiated preferentially from the M-A constituents that debonded rather than cracked. During the present investigation, the blocky M-A constituents were not observed to crack, and this was also the case in the work of Davis and King.13,19 The main reason for that might be autotempering of the M-A constituents during cooling from the intercritical peak temperature and by that a recovering of the steel toughness.7 Instead, debonding occurs, increasing the matrix stresses due to stress concentration effects in regions between closely spaced M-A constituents, assisting cleavage fracture.
In the present work, Fig. 5 (hardness mapping) shows a high level of local hardness in the M-A constituents with respect to that in the surrounding matrix. Therefore, an excessive internal stress could have developed in the matrix close to the M-A constituents and across the interface between the M-A constituents and the matrix. These stress concentrations may have caused the M-A constituents to debond from the neighbouring matrix.
Figure 7 gives an example of debonding of M-A constituent from the surrounding matrix, initiating a cleavage fracture. Figure 9 shows a similar case where the stress and strain concentrations probably have magnified because the transformation induced stress fields have overlapped. The crack seems to have initiated in the volume between the closely spaced M-A constituents and has propagated through the grain.
In summary, for cracks initiated from M-A constituents, mechanisms 2 and 3 of the introductory section, i.e. transformation induced residual tensile stress and debonding, seem to have been the dominating initiation mechanisms in the present investigation. The detrimental effect of the stress build-up depends on the presence of two or more M-A constituents in close proximity.
Conclusions
In the present investigation, the embrittlement mechanisms of M-A constituents formed in the weld HAZ in arctic steel have been examined using CTOD testing of weld thermally simulated ICCGHAZ samples. The main results are the following.
Two main types of M-A constituents were identified by SEM: blocky M-A constituents formed along prior austenite grain boundaries, and elongated stringers, developed between bainite and martensite laths. The specific situations of connected or nearly connected M-A constituents were also observed.
Hardness measurements performed by Vickers indentation and nanoindentation showed that the hardness of the M-A constituents was significantly higher than that of the matrix. The hardness value of the M-A constituents was in the range of 600–1000 HV.
The carbon concentration of the M-A constituents was measured by EPMA quantitative analysis. The results from the EPMA analysis showed that the carbon content of the M-A constituents was significantly higher than the carbon content in the matrix (within the range of 0·6–1·1).
Detailed TEM analysis revealed the presence of twinned martensite inside particles that are located at initiation sites of cleavage facets, proving that they are M-A constituents, and thus that M-A constituents are potential initiation sites for cleavage cracks.
In the present investigation, cracks initiated either from debonded M-A constituents or from the region between two or more closely separated blocky M-A constituents.
Footnotes
Acknowledgements
The authors wish to thank the Research Council of Norway for funding through the Petromaks Programme. The financial support from ENI, Statoil, Total, Scana Steel Stavanger, JFE Steel Corporation, Nippon Steel Corporation, Brück Pipeconnections, Miras Grotnes, Bredero Shaw, Trelleborg, GE Oil and Gas, Aker Solutions and Technip is also acknowledged.