
Abstract
With the introduction of novel fuels, which may contain high levels of trace impurities including sulphur and alkali metals, industrial gas turbines are operating with increasingly corrosive combustion environments. To investigate the effect that this, coupled with the higher combustion gas temperatures needed to increase power plant efficiency, has on current state-of-the-art gas turbine component materials, three burner rig exposure tests have been run. The tests evaluated the effects of fly ash, gas moisture and gas temperatures on the alkali sulphate induced hot corrosion of CM247LC, Haynes 230, IN939 and IN728LC. Type I (sulphidation and internal damage), type II (pitting) and mixed mode hot corrosion were observed under different test conditions; however, the presence of fly ash appeared to reduce the levels of hot corrosion. CM247LC, with its high Al content improving oxidation resistance, showed less resistance to hot corrosion than the other, higher Cr content, alloys.
Introduction
The power generation industry is under pressure to generate electricity both more efficiently and with lower CO2 emissions.1 Combined cycle power systems, fired on natural gas and using electricity generated from both steam and gas turbines, offer one route to achieving this compared to traditional pulverised coal fired power systems.2 However, the future higher cost and potentially limited/unreliable supply of natural gas are issues that are driving interest in producing fuel gases for such systems from other routes. Gasification of solid fuels, such as coal and biomass, offer alternative sources of fuel gases (or syngases) for combined cycle power systems (integrated gasification combine cycle systems – IGCCs).3 However, these syngases have different compositions (with lower calorific values) than the traditional natural gas fuel, and can also contain much higher contaminant levels, depending on the specification and performance of the gas clean-up systems.4–7 Advanced IGCC systems also offer the potential to integrate CO2 removal processes into the hot pressurised syngas path, in the form of ‘precombustion’ CO2 capture systems, and so generate syngases with higher H2 contents.8
For the gas turbines in IGCC systems, materials are required that can cope with the potentially corrosive environments that can be generated in their hot gas paths, as well as the mechanical and thermal demands that are present in natural gas fired systems. In the first generation of IGCC plants, gas turbines were derated relative to natural gas operations and materials degradation was observed to be more severe than that in natural gas fired power plants.8 It is anticipated that the environments produced in gas turbines in advanced IGCC systems will have higher moisture and SOx contents, together with deposits containing alkali sulphates/chlorides (and other trace metal compounds) and potentially erosive particles, depending on the operating of the gas clean-up systems.9 Thus, materials degradation issues that may be life limiting for hot gas paths include: oxidation, hot corrosion, CMAS (CaO-MgO-Al2O3-SiO2) corrosion, erosion, thermal cycling, creep and fatigue damage.10 To ensure gas turbine reliability, both corrosion resistant coatings and thermal barrier coatings are required that can withstand the environments generated in these systems.
One study investigating this topic forms part of a UK–US Collaboration on ‘Fossil energy research and development: advanced materials’; which was established between the UK Department of Energy and Climate Change and the US Department of Energy under a UK–US Memorandum of Understanding.11 Topics being addressed within this activity include: potential new environments produced by syngases; and, the effects that these will have on the materials for hot gas path components, such as blades, vanes and combustor cans.12 The first phase of this work included a series of four burner rig trials to assess the performance of a range of state-of-the-art materials under different exposure environments.12
This paper reports results of the performance of four uncoated materials (CM247LC, Haynes 230, IN939 and IN738LC) in three burner rig trials targeted at investigating different specific conditions. The performances of the materials have been investigated using dimensional metrology processes to determine alloy performance in terms of metal loss distributions, as well as characterisation using scanning electron microscopy (SEM) and energy dispersive X-ray (EDX) analysis. Together with other data generated during the course of these tests, these data are being compiled into a database of materials performance and used to develop improved models of materials performance in gas turbine environments.
Experimental
Test details
This work was carried out using a fully automated, large scale burner rig operating at atmospheric pressure (Fig. 1). The burner rig is fired using natural gas andhas a capacity of 1·4 MWth, but was operated at ∼0·5 MWth for the purposes of these tests. Within the hot gas path of this rig, air cooled samples were exposed to three specific combusted gas environments in 1000 h tests.
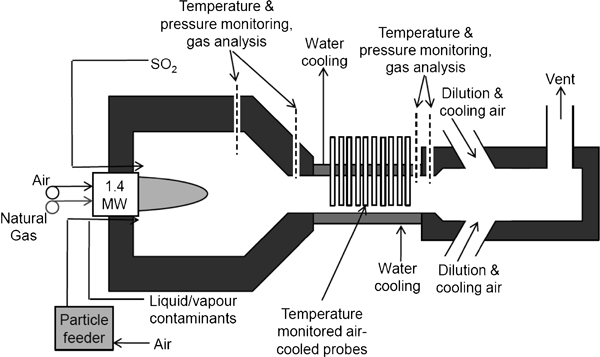
Burner rig schematic (modified from Ref. 9)
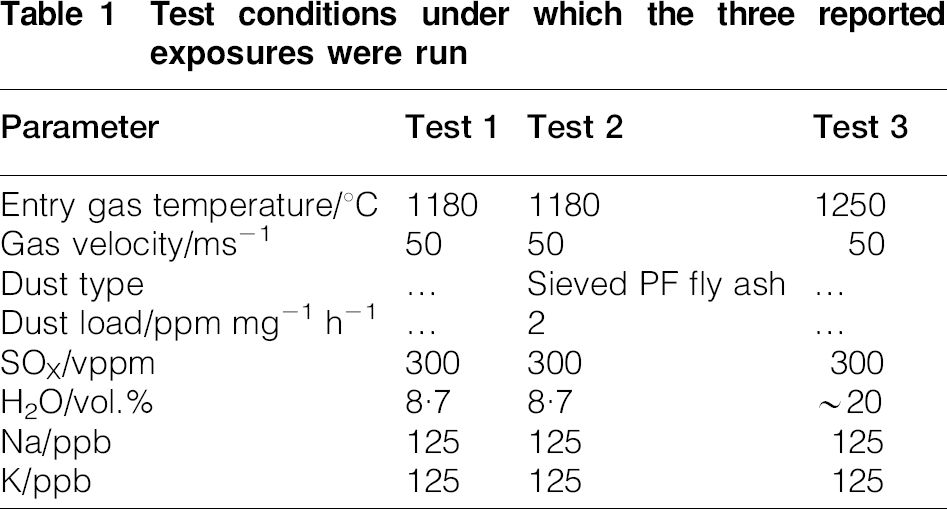
These different environments were created through the injection of various impurities (alkali metals, SO2, steam, fly ash) into the burning natural gas flame, and were designed to simulate the combustion gas environments produced in various power systems. Test 1 was targeted at diesel oil at the limit of alkali metal contamination; test 2 at IGCC syngas including the presence of fly ash; and test 3 at high H2 IGCC syngas, which would result in higher moisture content. Further details are given in Table 1.
Test conditions under which the three reported exposures were run
Fuel contaminant limits were scaled relative to those for natural gas using the different fuels’ calorific values (e.g. for syngas a reduction in contaminant levels by about ×10).4,5 MTDATA was used to calculate the equivalent values for contaminants’ concentrations that were needed to maintain the same alkali species deposits at atmospheric pressure.13
To create a gas stream with alkali species to match the modified fuel upper contamination limits (with pressure compensation), alkali metals were introduced to the burner rig through a Concept pump (operating at 280 cm3 h−1). This supplied a solution of 0·28 g L−1 NaOH+0·31 g L−1 KOH. Before use, the pulverised coal fly ash was sieved, removing large particles, and then dried. The ash was introduced into the combusted natural gas stream via a Palas RBG 1000 particle doser (with a feedrate of 12·8 mg min−1). SO2 feedrates (from bottled gas) were controlled using a Brookes Instrument's mass flow controller. Gas compositions and temperatures were monitored throughout the tests for comparison to the target concentrations.
Individual samples were machined from cast bars to produce cylinders (∼14 mm outer diameter and ∼34 mm long) capable of interlocking. These samples were then inserted onto spring loaded probes, each capable of taking three samples, and sealed together using a high temperature adhesive, Autostic FC4. Burner rig runs could include 36 probes per exposure. These exposures lasted for 1000 h, with some samples removed at 700 h and fresh samples inserted for the remaining 300 h.
The individual metal temperatures of the exposed samples were maintained, at a fixed value in the range of 715–955°C, by flowing cooling air along an annulus inside each probe, which was then ejected into the main gas flow. The cooling air exit temperatures were logged using K-type thermocouples and, via comparison to calibration probes, the samples’ metal temperatures calculated. The combusted gas temperatures were controlled to be either 1180 or 1250°C, depending on the test. This data was recorded every 60 s by a Solartron 3530 Orion data logger and National Instruments’ Labview system.
Sample analysis
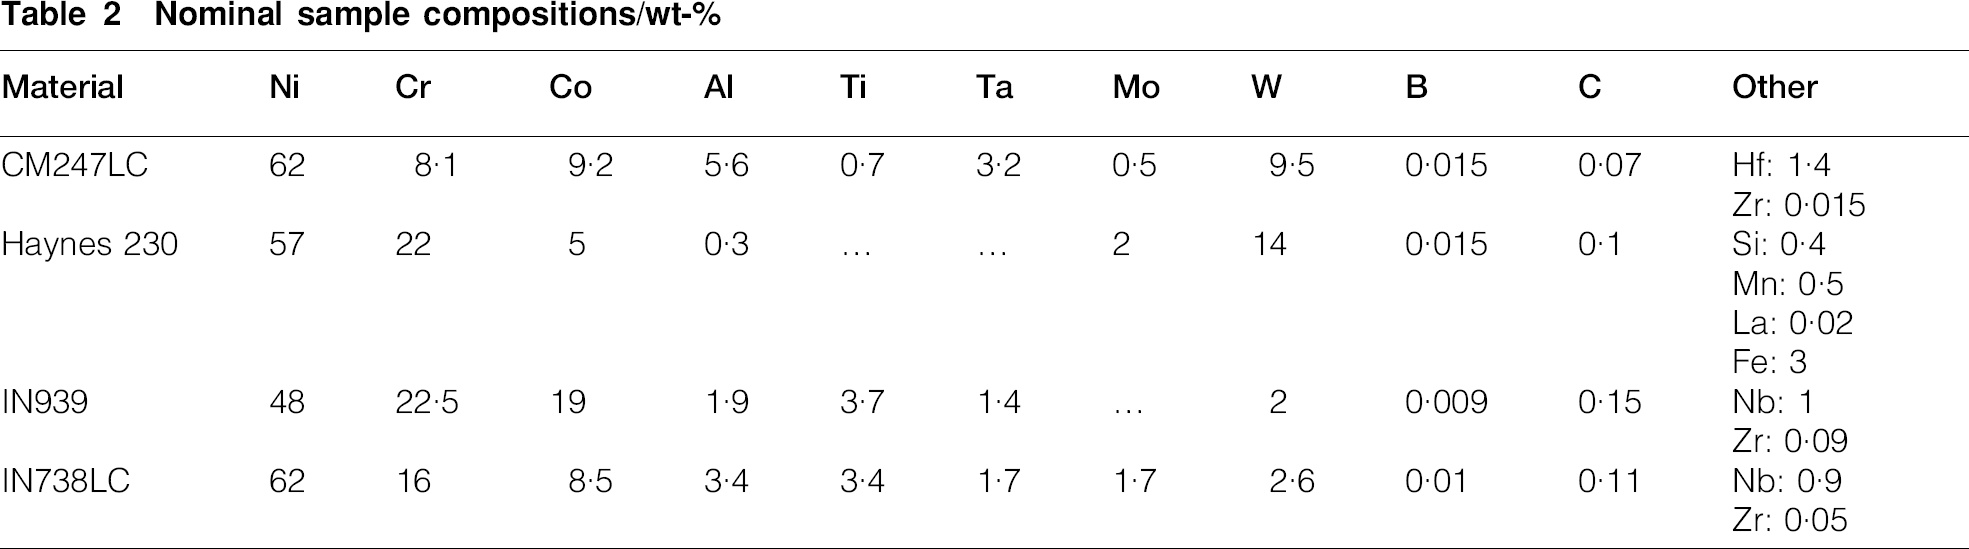
Before exposure, the diameters of all samples were measured at eight points by a micrometer (with a resolution of ±1 μm) using a notch machined during their production for angular reference. This notch also acted to locate the samples in the burner rig in the event that uneven deposition resulted in uneven sample corrosion (the notch was loaded to face ‘downstream’). Of the samples reported in this paper, CM247LC was exposed at two metal temperatures, 755 and 955°C; Haynes 230 at 955°C; IN939 and IN738LC at 930°C (temperatures accurate to ±10°C). The nominal compositions for the four alloys are given in Table 2.
Nominal sample compositions/wt-
Post-exposure, the samples were cold mounted (to prevent damage to the deposits and corrosion product) in a 50∶50 mixture of Struers’ Epofix low shrinkage resin and ballotini (glass spheres with diameters of about 40–70 μm, introduced to further reduce shrinkage of the mount during hardening). Samples were carefully cross-sectioned, perpendicular to their axis, and then polished for analysis. Cutting, grinding and polishing were conducted using oil based lubricants to prevent salts present in the deposit from dissolving.
Sample cross-sections were analysed using SEM and image analysis (IA). The IA was conducted using a commercial image analyser with bespoke measurement routines. Using these measurement routines, the central point of a sample was determined and 30 evenly spaced radii computed from this (12° separation). By selecting the points where these radii intersected with the sample's external diameter and internal damage, statistical data on the degree of corrosion could be collected (Fig. 2). By comparison to the pre-exposure micrometer data (and using an unexposed reference sample to account for calibration errors) the changes in sample dimensions could be calculated. This produced graphs recording the change in good metal (ΔGM) as a function of cumulative probability (ΔGM = −GML (good metal loss) = (metal loss+internal damage)). Analysis using SEM was conducted using a Philips XL30 environmental SEM and a Philips LX30 SFEG, both operated in a backscattered electron (BSE) mode at 20 keV, and using EDX. Maps of EDX were collected with a resolution of 128×96 pixels, typically collecting 100–400 frames. The EDX maps show areas of high damage, not necessarily representative of the sample as a whole.
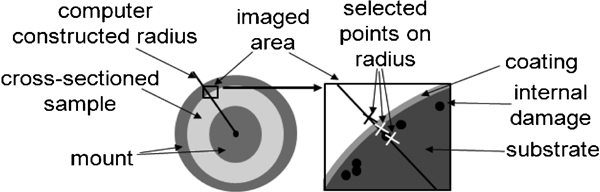
Image analyser takes images from 30 evenly spaced locations around sample's cross-section and plots radius from calculated centre; measurements are taken along this radius corresponding to the edge of the metal and any internal damage
Results
Development of corrosion over time for high and low temperatures
While samples suffered hot corrosion under the test conditions, this was frequently non-uniform in distribution, especially at higher temperatures (Fig. 3a). The non-uniformity of the damage necessitated statistical investigation, conducted here using IA data from 30 locations around the sample. Figure 3b shows the cumulative probability graph for ΔGM of CM247LC samples exposed to test 2 conditions (IGCC syngas) at high temperatures (955°C) for 300, 7000 and 1000 h. The data collected at 300 h give a relatively flat line; however, the samples corroded for 700 and 1000 h both show a sharp transition between a steep slope at low cumulative probabilities and a section with a low slope at higher cumulative probabilities. This transition occurs at ∼50 cumulative probability.
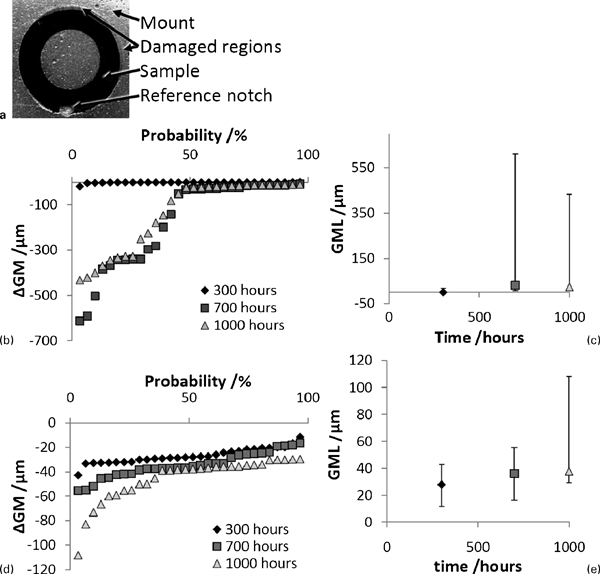
Data of IA for CM247LC samples exposed to test 2 conditions
Regions in the cumulative probability plots that are effectively flat correspond to evenly distributed GML. When this flat region corresponds to about zero GML, then these areas of the sample can be assumed to still be in the incubation stage of hot corrosion. The steep section of the plot, by contrast, shows that in certain areas the sample has suffered significant damage, though of various depths. Figure 3c attempts to summarise these data by plotting a central point, which represents 50 probability (median) of GML, and range bars which report maximum and minimum recorded GML. Owing to the divide between flat and sloped gradients in the cumulative probability plot; however, the median value is low, only truly representative of the sample as a whole for the 300 h exposure (as indicated by the symmetric range bars). For the 700 and 1000 h exposures with sharp transitions, this results in highly asymmetric range bars.
At lower temperatures (755°C; Fig. 3d), the gradients, while mostly flat, are not zero GML. Thus, a fairly constant GML around the sample may be assumed. Sharp transitions in gradient are not apparent in the cumulative probability plots; however, at 1000 h, the gradient steepens for lower cumulative probabilities. This leads to an asymmetric range bar for this sample in the summarised data (Fig. 3e).
As exposure time increases from 300 to 700 h, Fig. 3c and e shows an increase in both the GML median (about 0–31 μm at high temperatures; about 28–36 μm at low temperatures) and range (about 20–06 μm at high temperatures; about 31–39 μm at low temperatures). However, owing to the variation in GML around the samples, additional increases are less clear between 700 and 1000 h, especially for the higher temperature exposure. (At higher temperatures, there is a reduction in median GML to ∼24 μm and GML range to ∼422 μm, while at lower temperatures, the median GML increases to ∼32 μm and the range to ∼79 μm). The cumulative probability plots for the 700 and 1000 h samples exposed at 955°C (Fig. 3b) also show the similarities plotted in Fig. 3c.
Mapping (955°C; Fig. 4) of the samples by EDX show the development of corrosion damage at short times (300 h exposure). The damage often contains Hf rich centres and Cr and Al oxides. Both the deepest extent of the damage and the undamaged surface show an Al rich oxide above an Al and Cr depleted layer. In the case of damaged regions, the layer below is slightly Ni rich, and contains S. With increasing time (700 and 1000 h), these damaged regions become increasingly large (oxidation/sulphidation damage depths of ∼200 μm at 700 h, cf. ∼40 μm at 300 h), with regions of Cr and Al oxides contained within, and a Cr depleted area rich in S and Ni below. Ultimately these regions spread laterally and join together.
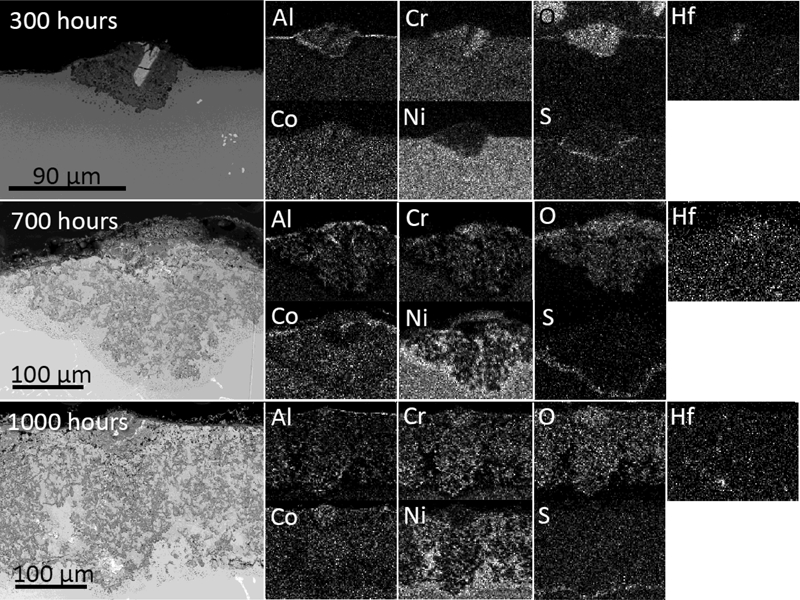
Images (SEM BSE) with EDX maps showing evolution of corrosion in CM247LC under test 2 conditions at 955°C after 300, 700 and 1000 h
Effect of test on corrosion
The IA data given in Fig. 5 show the responses of CM247LC samples exposed for 1000 h to the three different test conditions. At higher temperatures (Fig. 5a) the sample exposed to test 2 conditions and, to a lesser degree, the sample exposed to test 1 conditions, show a change in gradient indicating regions suffering corrosion propagation and regions showing little damage (i.e. still in incubation). At lower temperatures (Fig. 5b) the existence of a transition is less clear, though still present. This reflects data from Fig. 3b and d.
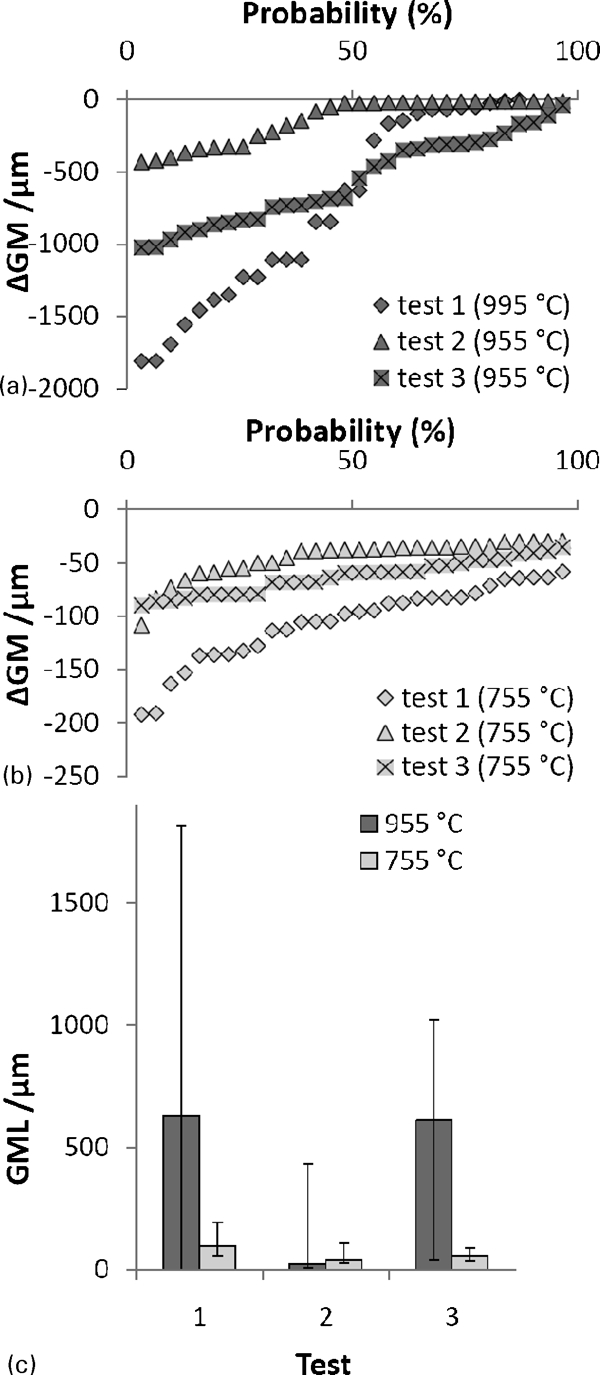
Data of IA for CM247LC samples exposed for 1000 h under test 1, 2 and 3 conditions
As in the previous section, the ΔGM data from the cumulative probability plots (Fig. 5a and b) can be summarised as median, maximum and minimum GML (Fig. 5c). Figure 5c demonstrates larger median GML for samples exposed at 955°C compared to samples exposed at 755°C under test 1 conditions (contaminated diesel conditions; ∼628 μm cf. ∼97 μm) and test 3 conditions (H2 rich IGCC conditions; ∼611 μm cf. ∼59 μm). Under test 2 conditions (IGCC) the median GML at 755°C is greater, as described in the section on ‘Development of corrosion over time for high and low temperatures’. The range in GML is greater for samples exposed at 955°C for all three tests (Fig. 5c).
For both higher and lower metal temperature exposures, test 2 conditions (IGCC) show the smallest median GML and low spreads in GML (Fig. 5c). Test 1 (contaminated diesel) and 3 (H2 rich IGCC) show comparable median GML, although test 1 shows a greater spread.
Comparison to other materials
Figure 6 shows IA data for CM247LC, Haynes 230, IN738LC and IN393 samples exposed for 1000 h under test 3 conditions (H2 rich IGCC) at high temperatures (930°C for IN939 and IN738LC; 955°C for CM247LC and Haynes 230). The cumulative probability plots for all four materials show a single gradient (Fig. 6a) which is steepest for CM247LC and shallowest for IN939. Figure 6b shows that both the median GML and spread in GML for CM247LC (about 610 and 984 μm respectively) are significantly greater than those of the other alloys. IN939 in particular shows low median GML and spread in GML data (about 26 and 66 μm respectively). Haynes 230 and IN738LC responded similarly (median GMLs of about 112 and 101 μm; ranges of about 118 and 102 μm respectively.)
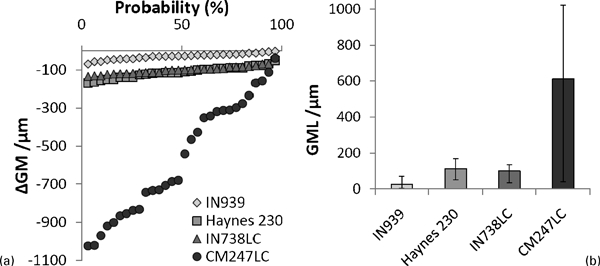
Data of IA showing response of different alloys to 1000 h, high temperature (930–955°C) exposure to test 3 conditions
The SEM EDX maps in Fig. 7 show areas of extreme damage in each alloy and confirm variations in the hot corrosion mechanisms. CM247LC produces a thick oxide rich in Al, Co, Cr and Ni and with a S rich region at the base. A similar S rich layer at the base of the oxidation is present in all bare alloys. However, the oxide formed above can be significantly different. Haynes 230 forms an oxide rich in Cr and with a thin Fe and Ni rich layer on the surface. IN738LC has a Ni rich surface oxide, followed by an Al-rich oxide, then a Cr rich oxide containing some Al. Lastly, IN939, the alloy showing least GML, forms a Ti rich layer over ‘pit-like’ features containing Cr rich oxide and finally an Al rich layer at a similar level to the high concentration in S.

Images (SEM BSE) with EDX maps showing response of different alloys to 1000 h, high temperature (930–955°C) exposure under test 3 conditions
Discussion
Development of corrosion over time for high and low temperatures
Several differences exist in the development of corrosion over time for the two temperatures studied. The 755°C IA data presented in Fig. 3d shows the expected monotonic increase in median GML with time; and an increase in the range of damage under the same conditions, as the species depositing from the test's combusted gas have greater time to inflict damage. At 955°C, however, the 1000 h exposure shows less GML (median and range) than the 700 h sample. This may be partially due to statistical variation in the degree of hot corrosion damage at the locations measured around the samples and partially a reflection of the far lower rate of change in GM between 700 and 1000 h than there is earlier on in the corrosion.
Median GML is lower for samples exposed at higher temperatures as compared to the samples collected at 755°C, and is partly an artefact of the data represented in Fig. 3b and d. While 50 of the locations measures around the samples showed less GML at higher temperatures than lower temperatures, the maximum corrosion depths obtained at higher temperatures are significantly larger: in the sections of the burner rig sample that do corrode, the higher temperatures lead to significantly higher levels of damage.
The damage development is influenced by several factors:
The hot corrosion of CM247LC and other samples requires the deposition of volatile impurities from the combusted gas stream onto the sample surface. For this to occur the sample's surface temperature must be below the dew point of the volatile component, thus enabling condensation.
However, once the relevant component has condensed on the sample surface, the temperature will also influence the rate of hot corrosion and the hot corrosion mode. (Type I hot corrosion peaks at ∼900°C, while type II hot corrosion peaks at ∼700°C.)14
The directional flow of the gas stream will influence the distribution of the deposition of corrosive species.15
Two corrosion regimes, incubation and propagation, exist for both types I and II hot corrosion modes and different sample locations will experience incubation for different lengths of time depending on the points above. The transitions between these regimes are indicated by a change in gradient in the cumulative probability plots (more noticeable for high temperature exposures than low).
The sharp transition in Fig. 3b for the 700 and 1000 h samples (955°C) may be explained as depicting regions where the sample's ΔGM data comes from hot corrosion incubation and regions undergoing propagation. Such transitions are particularly sharp for type I hot corrosion, whereby small regions of damage to a protective scale during incubation leads to the rapid propagation of oxides and sulphides into the metal substrate. As such, large sections of apparently uncorroded metal (still undergoing incubation) can be seen, while neighbouring areas show significant internal oxidation and sulphidation as the corrosion propagates. Indeed, the SEM data (Fig. 4) show the approximate development of type I hot corrosion damage with time on the CM247LC samples at 955°C. All corroded areas show that both internal oxidation and sulphidation are present, while the surrounding sample surface is apparently protected by an Al rich oxide, most probably α-Al2O3. The rate of propagation has been observed to remain approximately fixed for constant temperature or corrosive deposit flux.16 The transition between incubation and propagation however, is less fixed, often varying between similar samples and locations on the same sample.
At 300 h, EDX mapping shows Type I hot corrosion in small regions (Fig. 4). The smaller areas of corrosion frequently contain regions rich in Hf, and it is possible that the damage may nucleate around the Hf rich precipitates found in the base alloy where they intersect the sample surface, potentially disrupting the more protective α-Al2O3. Ultimately the regions of corrosion connect and penetrate deeper into the sample. By comparison to the IA data (Fig. 3b), it is apparent that ∼50 of these samples’ surfaces are still in incubation even after 1000 h. This corresponds to the visible damage seen in Fig. 3a.
The lack of transition for the 300 h 755°C exposure (Fig. 3d) suggests that all areas of the sample are in incubation, though with a higher rate of GML than for the incubation regions of 955°C exposures. The 1000 h sample shows an incubation to propagation transition, but with a propagation rate lower than that seen at 955°C. The 700 h sample appears to be mostly in incubation; however, it is possible that there is a transition to an increased gradient at ∼30, possibly indicating some minor propagation.
The higher incubation and lower propagation rates seen at 755°C cf. 955°C are representative of type II hot corrosion.16 While at 955°C, α-Al2O3 can be formed, inhibiting the incubation of hot corrosion, at 755°C, α-Al2O3 is not stable, and as the alloy contains insufficient Cr to form a protective Cr2O3 layer, the formation of mixed oxides and spinels with low protective capabilities is likely.17 This means that even in incubation, significant GML occurs.
Effect of test on corrosion
Temperature affects both the median GML and maximum GML, which are generally greater for samples exposed at 955°C under all test conditions. As reported in the section on ‘Development of corrosion over time for high and low temperatures’, at high exposure temperatures (955°C), a transition in the cumulative probability plots can often be seen (Fig. 5a) indicating the existence of regions which may be either significantly damaged (propagation) or relatively undamaged (incubation).
All three tests show significant metal losses. After just 1000 h exposure to a combusted gas environment in the burner rig, the maximum GML for CM247LC ranges from ∼90 μm (test 3 conditions at 755°C) to ∼1810 μm (test 1 conditions at 955°C). This high rate of GML may be due to the low fraction of the corrosion inhibiting element, Cr, in the alloy (8·1 wt-). 18 18,19
The lowest median GML at both temperatures is found under test 2 (IGCC fly ash) conditions. It is possible that the presence of fly ash, which was introduced to mimic the potential effects of an entrained flow gasifier system with a leaky hot gas filter, might have a beneficial influence stronger than any erosive qualities. One possible mechanism is that the fly ash acts to erode the corrosive deposits from the surface.
Comparison to other materials
Under burner rig exposure, the samples can undergo various hot corrosion degradation mechanisms as discussed earlier. CM247LC has an Al composition of 5·6 wt-, far higher than that of the other alloys (Table 2), which should provide protection against high temperature oxidation via the formation of a stable α-Al2O3 oxide.17 The existence of an Al rich surface layer can be seen in the EDX maps in Fig. 4. However, CM247LC exposed at 955°C for 1000 h to test 3 conditions does not show any remaining incubation region, so it is probable that the entire of the sample surface is in propagation, indicating that the oxide providing protection has broken down by this time. In contrast, the other alloys which have lower Al contents, all exhibit greater hot corrosion resistance. As such, the fraction of Cr (required to form Cr2O3 or mixed (Cr,Al)2O3) becomes relevant. With 8·1 wt-Cr, CM247LC has the lowest Cr content out of the four tested alloys. (IN738LC has the next lowest Cr fraction with 16 wt-). Figure 7 clearly shows the presence of Cr rich oxides in Haynes 230, IN738LC and IN939. The degree of hot corrosion resistance shown by an alloy appears inversely related to its Cr content.
Consequences of pressure compensation
The large good metal losses (up to 1800 μm over 1000 h) observed in this study are unrepresentative of the smaller degree of good metal loss in standard gas turbine (GT) operation. This acceleration partially results from simulating fuels with the maximum allowable impurity levels, in addition to the burner rig being operated at atmospheric pressure rather than at pressures up to 1·8 MPa, leading to compensation of the alkali levels to maintain dew point temperature.20
The corrosion rate is increased because, to assess the corrosion of hot gas path components in GTs, the burner rig samples needed not just the same metal temperature as the components they represent, but to be in combustion gas where the volatile species would condense at the same temperature (have the same dew point) as in an operating GT. If the various dew points were not identical, some samples would suffer corrosion mechanisms unrepresentative of their GT component as required volatile species failed to condense (or species which should not condense, did). To achieve the match in dew points in the lower pressure burner rig, the vapour pressure of individual components was increased in the combusted gas stream.15 This led to an increased deposition flux at temperatures below the dew points, which resulted in much higher rates of corrosion than would be expected in higher pressure GTs.
Conclusions
Results from three burner rig tests on base alloy materials commonly used in industrial gas turbines have been reported. These three tests have been designed to simulate the operation of a gas turbine burning contaminated diesel (test 1); syngas with fly ash (test 2); or H2 rich syngas (test 3). This has been achieved via the introduction of different levels of fly ash, moisture, alkali metal and other impurities. Type I hot corrosion (internal oxidation and sulphidation) was observed under all test conditions and some pitting (type II hot corrosion) under lower temperatures; however the presence of fly ash (test 2) reduced the extent of hot corrosion. Despite the high level of aluminium present in CM247LC, which enhances its oxidation resistance, it showed less resistance to hot corrosion then Haynes 230, IN939 and IN728LC, due to the lower levels of Cr. Therefore, it is necessary for alloys to contain significant levels of Cr, in addition to Al, to resist hot corrosion.
Footnotes
Acknowledgements
This work was carried out under the UK/US Collaborative programme of research on ‘Advanced Materials for Low Emission Power Plants’. UK activities were funded by the Department for Innovation, Universities & Skills and the Department for Business, Enterprise and Regulatory Reform, Alstom Power and Siemens (UK). US activities were funded by Department of Energy and Siemens Power Generation Inc. In addition, the authors would like to thank D. Ashby for assistance with image analysis and sample preparation and N. A. Legrave for running the experimental tests.
This paper is based on a presentation made at the 8th International Charles Parsons Turbine Conference organised by the Institute of Materials, Minerals and Mining at Portsmouth, UK on 5–8 September 2011.