
Abstract
This paper describes a detailed study of tube extrusion by simulation using finite element method (FEM). The finite element model used one-sixth of symmetry. The extrusion load, temperature evolution and metal flow were predicted. Innovative methods, combining both grid and surface tools, were used to define in detail the flow of material. These showed clearly the inner and outer surface formation mechanisms of the tube extrusion. The seam weld, an important quality indicator, was also evaluated by selecting an appropriate criterion.
Introduction
There are several methods by which internal cavities may be introduced into extrusions. One way is to use a hollow billet and then use a fixed or floating mandrel. A fixed mandrel means that it is integrated into the dummy block and stem. A floating mandrel, also floats in slots in the dummy block and aligns itself in the die when extruding. If a solid billet is used as the feed material, then it must first be pierced by the mandrel before extruding through the die. In most cases, the solid billet is used with a spider die, porthole die or bridge die. All of these types of dies incorporate the mandrel in the die and have ‘legs’ that hold the mandrel in place. During extrusion, the metal divides and flows around the legs, leaving weld lines in the final product. A bridge or porthole die is usually used to manufacture hollow sections as shown in Fig. 1. The necessary tooling to extrude tubes comprises hollow dies with a stationary core or mandrel. The mandrel is firmly kept in its position by legs or bridges, embedded in the back of the die. When the aluminium billet is pushed in the die, the material flow splits into different streams around the mandrel supports. Past the mandrel, the metal streams rejoin in the welding chamber and become welded in the solid state by the effect of pressure and temperature.1 As a result, extruded sections produced on such dies have two or more seams or longitudinal weld lines. The trajectory of the metal as it flows in the extrusion chambers is an important factor determining the mechanical properties of the extruded products. The description of material flow during the extrusion process has been the focus of much interest in aluminium alloys. Studies of the material flow during extrusion are well documented in the literature. The techniques employed range from commonly used physical techniques such as gridded billets (introducing pins of an aluminium alloy into the as cast billet and then grinding and etching the surface after the end of the extrusion2–4 to more recently numerical methods.5–8 These techniques did achieve practical results describing metal flow, but none of them disclose the comprehensive insight to understand the basic formulation of a bridge die extrusion. In this study, a novel numerical tool, ‘Grain Flow’ technique which can display the metal flow in both grid and surface fashions, will be used in an attempt to investigate the complexity of metal flow in the bridge die extrusion.
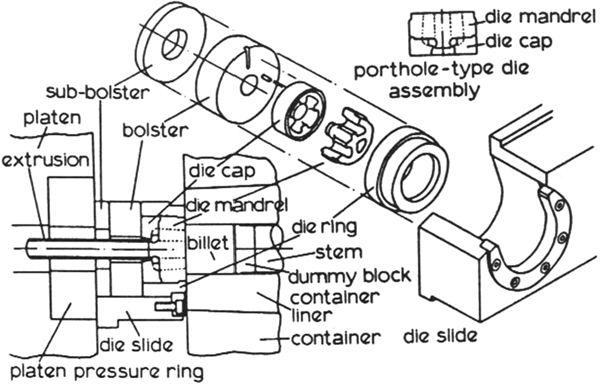
Typical tooling arrangement for aluminium hollow sections (Sheppard, 1999, p. 359)
The formation of weld seam is a unique feature of bridge die extrusion. Its strength directly influences the application of the tubular products. Owing to the high temperature, high pressure environment, it is practically impossible to measure parameters determining weld seam quality. Some authors have reported cumbersome physical methods9–13 to evaluate the weld seam quality. Advanced numerical methods have been utilised.1,14–16 Generally speaking, researchers agree that weld seam formation is a solid state pressure bonding process. The main parameters that decide the weld seam quality are pressure and contact time between materials from neighbouring metal streams. Based on this theory, different weld seam quality criteria were proposed that will be detailed later in this study. Of these criteria, some are far too basic to be realistic, while others are too complicated to incorporate within finite element method (FEM) codes. This study tried to evaluate the weld seam quality by introducing a practical method.
In order to avoid remeshing and deal with complex shape extrusion simulations, commercial finite element packages such as QForm and Hyperextrude (or in-house software such as Dieka) use arbitrary Lagrangian–Eulerian. However, there are some drawbacks with arbitrary Lagrangian–Eulerian theories and codes: (1) they are still developing; (2) they often assume a steady process for the simulation which inevitably loses transient information; and (3) they lack easy access to subroutine interface and ready made microstructure module. The latter is very important for studying the weld seam quality.
Self-contact problems have always been a severe problem in developing numerical solutions to predict simulation. For a bridge die extrusion simulation, the process is even more complicated in that the material is ‘split’ into two strands and they then bonded together in the welding chamber. Most researchers tend to use the symmetry of the simulated structure to avoid this issue. Some methods were also invented to solve situations in which self-contact is unavoidable. Literature searches have revealed that there is no comparative study between the symmetric finite element model without self-contact and the self-contact finite element model which has been developed in some commercial packaged. When it comes to the prediction of microstructure evolution during bridge die extrusion, it is important to make clear which model can better describe the real process. Therefore one of the purposes of this study was to compare the simulated results from both models with experimental observations. This phenomena is further discussed in Niu's work.17
Experimental procedure
The experimental data used in this part are extracted from the literature.19 The material used in the study is AA 6063 whose major chemical compositions are listed in Table 1, which is a commonly preferred alloy to produce hollow extrudes because of its relatively low flow stress and excellent high temperature ductility (i.e. superior plasticity).
Chemical composition (wt-%) of AA 6063 alloy18
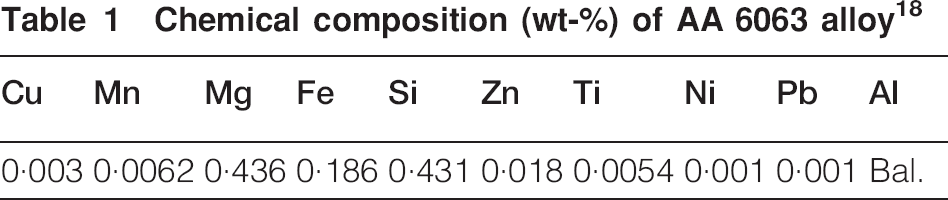
The details of the experiment can be found in Nisaratanaporn's work.19 The ram speed in the experiment was 3 mm s−1. The dimensions of the billet were 73 mm in diameter and 100 mm in length. Its initial temperature was 450°C and the other tools’ temperatures were 50°C below that of the billet. The inner diameter and outer diameter of the extrudate were 8 and 16 mm respectively.
FEM simulation results and discussion
FEM simulation is used in the present study. Forge is an implicit and fully thermomechanically coupled FEM package with automatic meshing and remeshing capabilities. Material flow is based on Lagrangian descriptions. For hot extrusion, the elasticity effect can be ignored and hence, the most economical constitutive laws are purely viscoplastic approximations. The Zener–Hollomon parameter Z is used to describe the flow stress
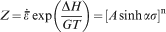
 is the mean equivalent strain rate and in practical terms is governed by the extrusion ram speed, while ΔH is the activation energy. G is the universal gas constant and T is the temperature of the billet. The flow stress may then be written as follows where A, α and n are constants specific to each alloy
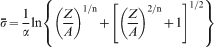
Figure 2 shows that two symmetry planes can be placed along lines OA and OB such that the simulated structure can be modelled by a one-sixth FEM model which will only use material which is enclosed by the two symmetric planes A and B. Figure 2 also indicates that a one-third model could also be employed. The one-sixth FEM model is illustrated in Fig. 3 which emphasises that a one-third model would also be acceptable.
Top view of bridge die
One-sixth FEM model
In order to reduce the computer analysis time to an acceptable scale, the container and die are assumed to be rigid. This means that there is no distortion of the tools and hence, a distinct single temperature may be assigned to each component during the computation. The heat transfer coefficient between the billet and tools (die, ram and container) was assumed to be 20 000 W m−1 K−1. The convective heat transfer coefficient 10 W m−1 K−1. The emissivity was 0·05. The Tresca friction law is adopted. The friction factors (0≤m≤1) on the ram/billet are 0·4 and 0·85 for the container/billet. The friction factors within the die land/billet interface are 0·1 and 0·4 for the remaining part of the die/material interfaces.
Load and temperature loci prediction
Segment OAB (Fig. 4) obviously represents the billet upsetting period during which the billet is compressed until it totally contacts the container at point B (Fig. 5)
Segment BCD is the billet dividing stage in which from point B billet began to be split by the bridge die into three individual strands and the load required for this operation increases until the breakthrough point C is reached. Then the strands continue to flow in their own portholes, while the load remains sensibly constant. At point D, the strands reach the bottom of the welding chamber
Segment DEF can be termed the welding chamber filling stage, although it is quite possible that the material could have concurrently flowed into the die orifice before the chamber is completely filled. It is interesting to note that during the time each element crosses the segment DE, the load increases much faster (steeper slope) than it did during the segment EF. This is because DE largely is a period in which part of the strand in the welding chamber is upsetting such that a higher increasing rate of load is needed; while during EF, this part of material gains sufficient momentum to flow inside the chamber circumferentially. The increasing rate of load necessary to push the material through to ensure entry to the die thus decreases
From point F, welded material started entering the die orifice, a tubular extrudate formed and the welding chamber is fully filled. Finally, the peak load for the tube extrusion is reached at point G and shows a value of 265 tons comparing well with the experimental load of 261 tons. The load subsequently reduced to a steady state until the end of the extrusion at point H.
Load evolution as function of ram displacement during tube extrusion
Deformed billets at different key points
Figure 6 shows the billet temperature evolution during the tube extrusion. Figure 6 corresponds to the ram displacements at points C, D, F, G and H in Fig. 5. It can be seen from Fig. 6a that because the heat loss between the billet and container, bridge die and the ram, only the centre of the billet can hold the initial temperature, the temperature of the contact surface of the billet decreases substantially. The lowest temperature 410·4°C appears at the end of the billet which has transferred heat to the cooler ram. In Fig. 6b and c, the overall temperature of the billet continued to decrease. The lowest temperature dropped to 401°C and the highest temperature moved to the material flow front. However, because the billet was divided by the bridge die into three strands, there was a larger contact area between the material and the bridge die and welding chamber, both of which had an initial temperature 400°C. The highest temperature decreased to just 415°C. At point G, the temperature shown in Fig. 6d with the metal flowing into the die orifice and through the die land, more mechanical work was converted into heat and the highest temperature rose to 435·5°C, while the lowest stayed at 401·1°C. After the point G until the end of the extrusion, point H, the extrusion load was well below the equivalent steady state and the highest and lowest temperatures and temperature distribution remained almost constant.
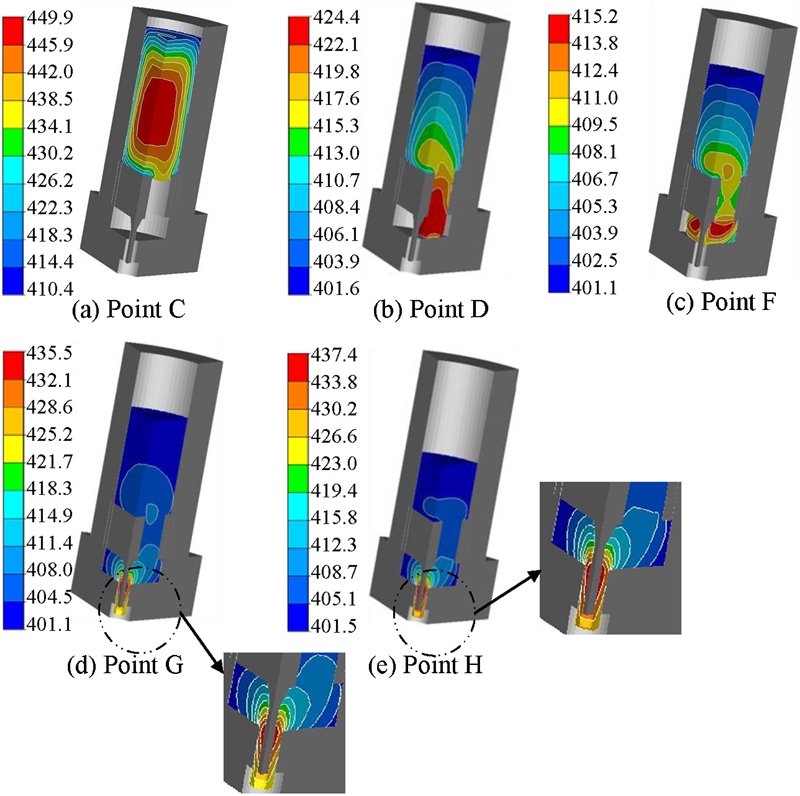
Temperature evolution during tube extrusion (°C)
Unlike solid section extrusions, the extrudate's exit temperature in tube extrusion is lower than the initial billet temperature. This could be largely due to the tool/material contact being increased by the bridge die enhancing the heat transfer from the billet to the bridge die. We are also considering an experimental result in which this is the first rather than a typical extrude; in the industrial situation, billets are extruded almost continuously and hence, the dies would be at a higher temperature. The tool stack will also contain material at a higher temperature (at least equal to our predicted final temperatures in this work) and hence, the final temperature rises are likely to be higher than those found even in solid complex sections. Another factor is that for this particular alloy (AA 6063), the non-steady state characteristics of the process may end at a much lower strain and hence, very little strain hardening may be observed. Dynamic recovery leads to relatively stable flow stresses in most parts of the extrusion cycle. In association with this, thermal effects are less pronounced and the process may be approximated as isothermal.22 The low ram speed used in the simulation is also likely to be a cause of this phenomenon of the drop in billet temperature. This, however, is more likely to be caused by the atypical situation of analysing an experimental extrusion in which, unlike the industrial case, there is no following billet.
Further differences compared to a solid extrusion is that in the die land over the extrudate's cross-section, the higher temperature is at the inner side of the tube, which can be explained by two facts: first, in Fig. 6c, the material with the highest temperature flowed to the mandrel surface, which can be seen in the investigation of the metal flow in the following section; second and probably the major reason is that heat resulting from the increased shear deformation which occurs close to the mandrel surface as shown in Fig. 7.
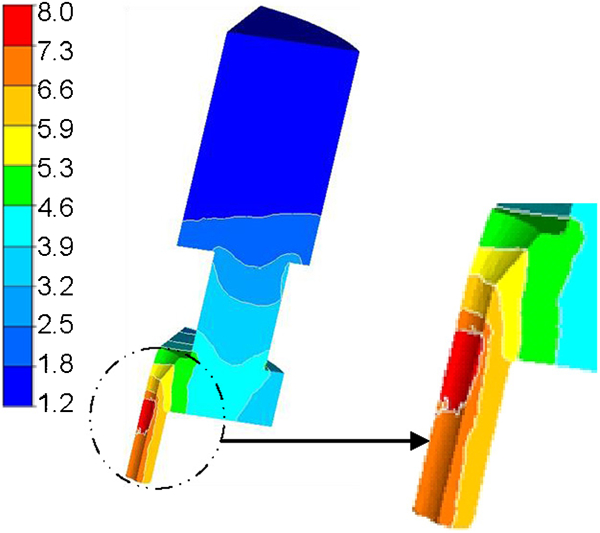
Strain distribution of tube extrusion
Metal flow and surface formation
The bridge die alters the metal flow compared to solid extrusions; material movement during bridge die extrusion is much more complex. FEM can be utilised to investigate these alterations allowing us to understand the mechanism of metal flow complexity using virtual gridded planes. Five gridded planes numbered from (1) to (5) were used to study the metal flow. These were circumferentially distributed every 15° passing through the central axis of the billet. Figure 8 shows their initial shapes before deformation. Planes (O1) and (O5) sit on the symmetry planes of the one-sixth FE model. Figure 9 displays the metal flows on the two symmetry planes. Figure 9a–c are the deformed shapes of the plane (O5) at ram displacements of 10, 40 and 80 mm respectively. Figure 9d–f shows deformed shapes of plane (O1) at the same ram displacements.
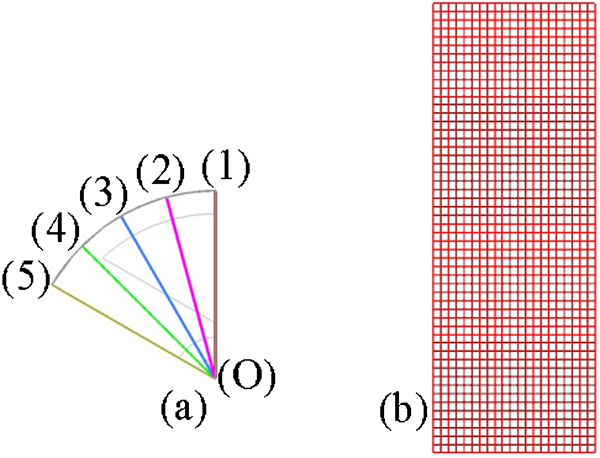
Gridded planes
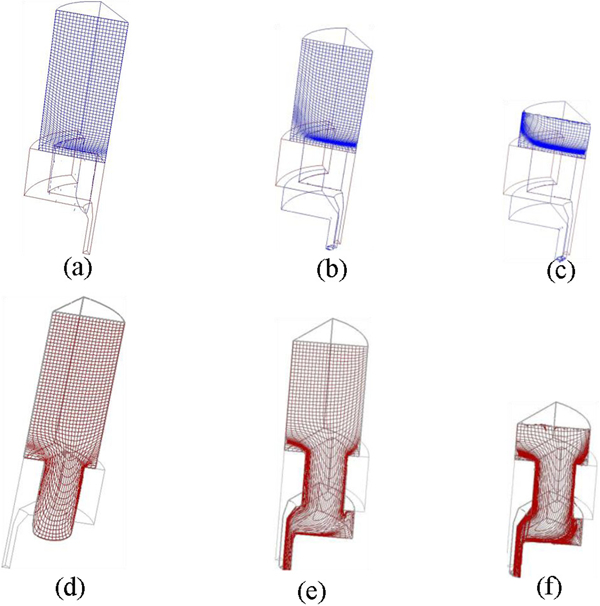
Metal flow on symmetry plane 5 at ram displacement of a 10mm, b 40mm and c 80mm and on symmetry plane 1 at a ram displacement of d 10mm, e 40mm and f 80mm
The planes (O1) and (O5) are on the symmetry planes of the deformation of the billet and hence, they can retain their geometry during the process. Furthermore, for grid plane (O5), the deformation is concentrated within a location whose vertical segment is close to the container wall and whose horizontal segment is several millimetres above the top of the bridge. Connecting these horizontal and vertical severe deformation segments is a curved segment, below which is the dead metal zone.
Plane (O1) is a much studied plane; Sheppard et al.18 has used Forge2, an early version of Forge2009, to get an approximate definition of this area. Later, Flitta and Sheppard23 achieved more realistic result of the metal flow on this plane using Forge3; another early version of Forge2009. In this study, a finer grid plane is possible using the three-dimensional model to represent the material movement. It can be seen from Fig. 9e that, at a ram travel of 40 mm, the dead metal zone (DMZ) between the bridge surface and the container is well defined. In the welding chamber, a DMZ is also established. We can also recognise that the right part of the flow front will first move toward the welding chamber wall, later moving upwards until it contacts the bridge base, and finally fills the corner area between the bridge base and the container. In the subsequent stage of extrusion, material that contacted with this flow front in the weld chamber could possibly generate a certain amount of material fold. This fold does not appear to influence the extrudate because it is trapped in the welding chamber as a DMZ which can be seen from Fig. 9f. Figure 9f also indicates clearly that at the end of the extrusion, the material next to the billet surface flows to the extruded tube's outer surface and the inner wall of the tube extrudate is formed by the material in the centre of the billet. It explains the fact that unlike the solid section extrusions, the inner side of the tube has a little higher temperature. This is because the inner tube wall is formed by the material initially at the centre of the billet with a higher temperature (Fig. 6).
Figure 10 is a comparison of the predicted metal flow pattern on the grid plane (O1) with its corresponding experimental macrograph in the welding chamber. They are acceptably similar indicating successful simulation. This micrograph clearly shows that the metal at the outer surfaces of the tube originated from the virgin metal in the surface generation zones (locations a and a′) and the metal forming the inner surfaces, originated from the metal in the surface generation zones adjacent to the mandrel (locations b and b′). Figure 10 shows comparison between experimental result19 (Fig. 10a) and predicted metal flow (Fig. 10b) in the welding chamber.
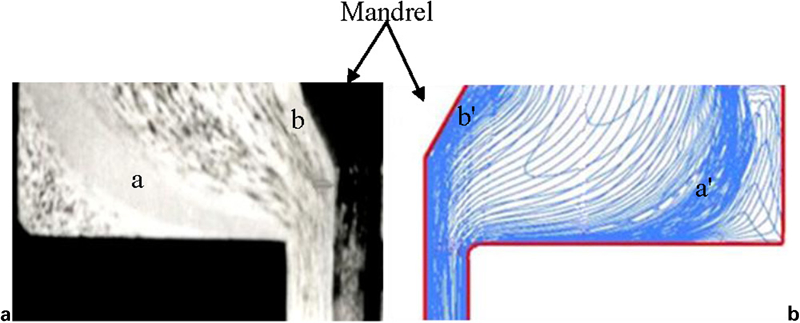
Predicted and experimental flow
The deformation of the other three grid planes is shown in Fig. 11 in which Fig. 11a and b are the shapes of the grid plane (O2) at the ram travel of 40 and 80 mm respectively; Fig. 11c and d are those for the grid plane (O3) and Fig. 11e and f for the grid plane (4) at the corresponding ram displacements. These figures indicate that from grid planes (O2), (O3) and (O4), it still quite clear that the material at the centre of the billet forms the tube's inner wall. However, it can be seen from Fig. 11b that at the end of extrusion, part of the outer material, close to the billet surface on the plane (O2), apparently flowed into the tube's outer surface. The material on the other two planes did not contribute to the tube's outer wall formation. This implies that the material that forms the tube's outer surface is mainly from between the plane (O1) and the plane (O2) on the outer part of the billet. The DMZs are the same as those indicated in the grid plane (O1) shown in Fig. 11 except that in the bridge cavity and the welding chamber, the planes cannot retain their original geometry because of the influence of the bridge. In the welding chamber, they are distorted towards the welding plane. For both planes (O2) and (O3), the flow front can still reach the bottom of the welding chamber, while for the plane (O4), Fig. 11e and f indicates that the material on this plane is much closer to the bridge surfaces so that during the extrusion, it will not contact the bottom of the welding chamber and material between this plane and the symmetry plane (O5) will mainly proceed to the inner surface of the tube. This suggests that only a small part of this material near the billet centre forms the inner wall of the tube extrudate and most of this plane will remain in the DMZ of the welding chamber. This is clearly displayed in Fig. 11.
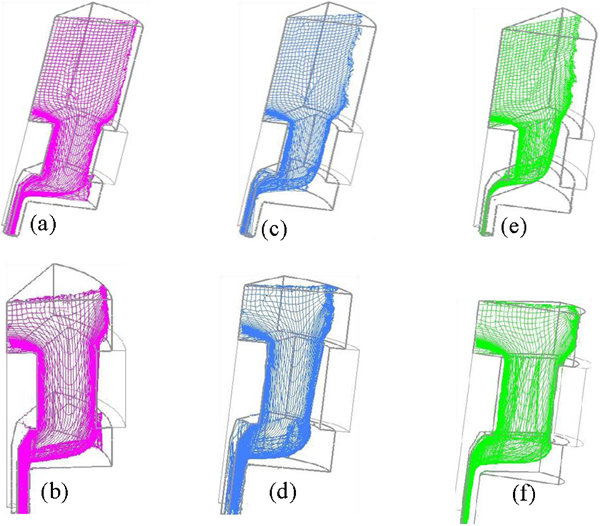
Flow patterns at ram displacement of 40mm in a plane 2, b plane 3 and c plane 4, and at ram displacement of 80mm in d plane 2, e plane 3 and f plane 4
Ten cylindrical surfaces which are coaxial with the billet were devised to observe the metal flow represented by their topological changes during extrusion and are shown in Fig. 12. They are numbered as surface 1–10 from the outside to the centre. Their distances from the billet surface are shown in Table 2.
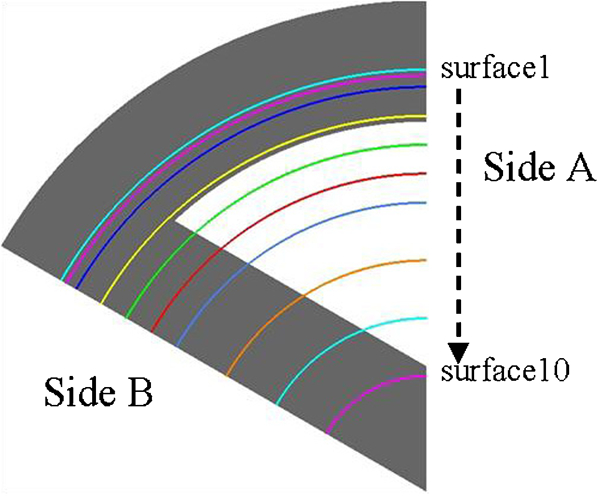
Positions of 10 cylindrical surfaces inside billet
Distances from billet surface of 10 cylindrical surfaces

Figure 13a shows the metal flow of the cylindrical surfaces coaxial with the billet surface and from side A which in Fig. 13a is shown for a ram displacement of 40 mm. Figure 13b is observed from the side B at the same ram travel.
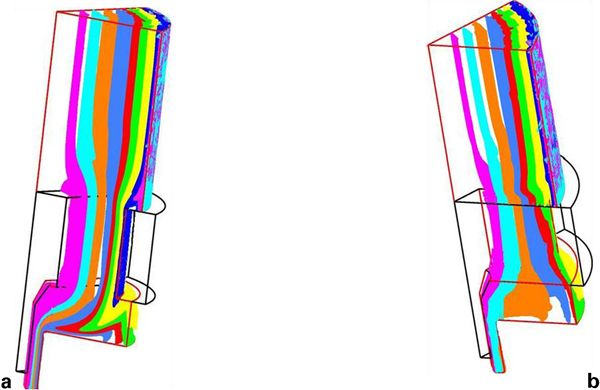
Metal flow of surfaces coaxial with billet surface
Figure 13 also indicates that the material behaves as any direct extrusion in that the surface material of the billet will stick at the container wall. At a ram travel of 40 mm, the dark blue surface (3) observed from side B and the billet surface, has shown little flow, while the surface observed from side A is flowing along the outer wall of the bridge. All other surfaces seen from side A have already reached the bottom of the welding chamber. Surfaces numbered from (4) (yellow) to (7) (blue) have flow fronts, which after touching the welding chamber bottom, moved outward and upward to fill the welding chamber first, then when the welding chamber was fully filled, they began to flow into the extrudate.
Conversely, it can be seen from side B that, at the same ram displacement, material is still moving outward towards the outer wall of the welding chamber. It is notable that observing from side A surface (8) (brown) will not experience the welding chamber filling process, but enter the extrudate directly. As mentioned above, this change is slower if the metal flow is observed rotationally around the billet axis from side A to side B. It is shown in Fig. 13b that surface (8) is moving outward in the welding chamber, although finally the upper part of the material will also flow into the die orifice to form the extrudate. Surface (9) and surface (10) travel to the extrudate and form the inner surface of the extruded tube. The formation of the outer surface of the tube is complex because observed from side A, it can be seen in Fig. 13a that the outer surface is formed from material from surface (7) which becomes surface (8) when the view orientation is changed. Therefore, it is safe to say that the outer surface material is moving towards the billet surface direction as the ram progresses. Nevertheless, in general, the central material of the billet forms the inner wall of the tube extrudate and the outer material of the billet forms the outer wall of the tube extrudate. It is not surprising that a DMZ will form between the top of the bridge and the container wall. We should also recall after the flow front moves outward and upward and finally fills the welding chamber. It will halt and form a second DMZ (Fig. 14).
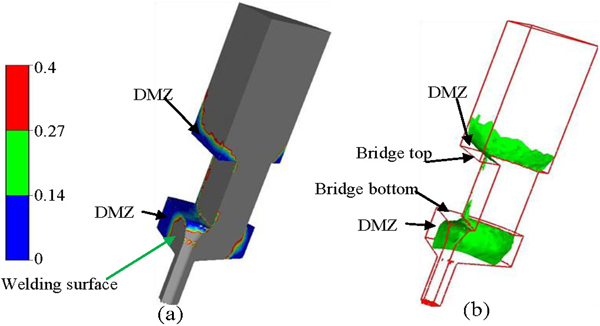
DMZs in tube extrusion (mm s−1) shown a in filled contours and b in isosurfaces
Figure 14a displays the materials whose velocities are indicated as less than 0·4 mm s−1 in colour contours and Fig. 14b shows the isosurfaces at a velocity of 0·2 mm s−1. In addition to the DMZ formed as a result of by the abrupt geometry change at the bridge top and the container, there is a large DMZ in the welding chamber which becomes thicker under the bridge; it can extend to the adjoining area of the mandrel and the bridge. Small DMZs also appear at the top and bottom of the sharp intersection with the weld chamber.
Modelling of weld seam quality
Although different criteria have been proposed14,16,8,24,25 to predict this important parameter, they are either too basic or too complex to be applied in the FEM simulation in the form they have been presented. However, all the researchers agree that the weld seam formation is a solid state bonding process and the quality of the weld seam is mainly determined by the material temperature, the pressure between the neighbouring metal streams, and the contact time. The process features indicate that the time necessary to transverse the welding chamber is short and the strain rate does not show large variations (Fig. 15). Under these conditions, the precoded Oyane damage law (equation (3)) in Forge may be conveniently used to assess the seam weld quality qualitatively
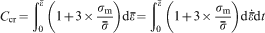
Strain rate distribution in tube extrusion (s−1)
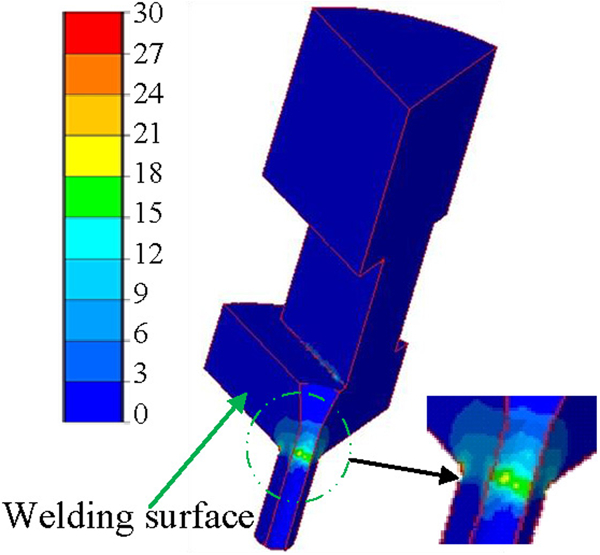
Mean stress distribution in tube extrusion (MPa)
Figure 17 shows the effective stress distribution which displays a similar distribution to that of the mean stress in the welding chamber. It is an indicator of the combined result of temperature, strain and strain rate. On the contact interface of the two streams, the welding process would proceed more easily under these lower effective stress conditions.
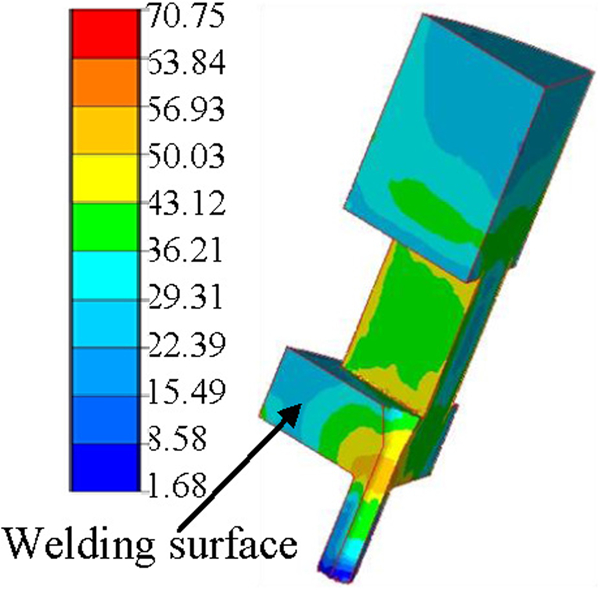
Effective stress (MN m−2)
Figure 18 shows the calculated weld seam quality using equation (3) in which higher value denotes better welding quality. It indicates that better seam quality appears on the outer side of the tubular extrudate.
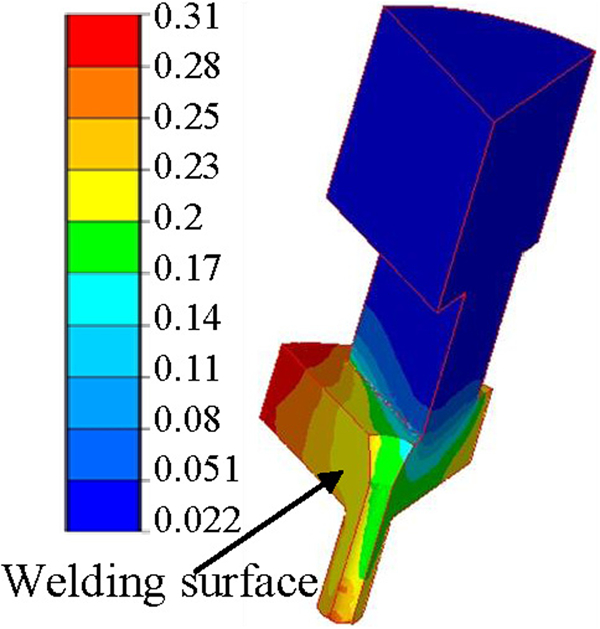
Weld quality index
Conclusions
The Zener–Hollomon equation is suitable for numerical simulation of hot aluminium extrusion.
The predicted load for tube simulation is very close to the experimental result. The influence of the bridge ensures that in tube extrusion, the temperature distribution across the extrudate cross-section is considerably modified when compared to the equivalent solid section extrusion.
The temperature of the inner wall of the tube is higher than the outside wall.
Temperatures at the exit are in general less than we would expect in solid extrusion.
Both a grid method and a generated visual surface method were used to observe the complicated material flow during tube extrusion. The detailed analysis of the predicted metal flow results indicates that the material at the centre of the billet forms the inner surface of the tube, while the materials forming its outer surface are mainly from the outer part of the billet enclosed by two planes ±15° around the billet axis from the symmetry plane of the bridge.
It is widely accepted that the pressure in the weld chamber and the total contact time of the materials from the neighbouring metal streams are the most important factors that decide the weld seam quality. Weld seam quality can be qualitatively evaluated by the Oyane damage law. Simulated result shows that according to this law, the outer surface area of the tube extrudate would have better weld quality than the inner surface area.