
Abstract
Alloys of AA 5182 are commonly used in the automotive industry to provide weight reductions in vehicle chassis. The strength of such alloys is based on the Mg content, with Mg causing the precipitation of a β-Al8Mg5 phase along the length of the grain boundaries in the microstructure. These precipitates are vulnerable to intergranular corrosion (IGC) in acidic environments. For this reason, the proportions of Mg in the microstructure must be limited, with >3 wt-Mg causing intergranular attack. The alloys used in this study had an Mg content of 4·43, so were vulnerable to IGC. Standard nitric acid mass loss tests were applied to determine the level of corrosion resistance in two samples subjected to various treatments. Using ‘five parameter’ analysis, the importance of the grain boundary plane and thermomechanical history to IGC resistance was determined. ‘Special’ planes were identified in the microstructure and their impact on IGC resistance was assessed. From such analysis, it was found that a high deformation level of 50 together with a simulated batch annealing heat treatment yielded the highest proportions of ‘special’ boundaries within the microstructure. ‘Special’ boundaries in this study were identified to be low angle boundaries, <111> twist boundaries and <110> tilt boundaries, which are associated with a reduced energy compared to random high angle boundaries. As precipitation generally occurs along high energy boundaries, ‘special’ boundaries reduce precipitate formation, thus reducing IGC intensity. Future implications include the introduction of a higher proportion of ‘special’ boundaries into the microstructure, allowing for an increase in Mg content in these alloys.
Introduction
Understanding the role of the grain boundary plane is crucial in determining which boundaries demonstrate ‘special’ properties.1 Misorientation alone cannot fully describe the boundary. Historically three degrees of freedom have been attributed to the misorientation of a boundary and the remaining two to the boundary plane. These remaining two degrees of freedom have for many years been enigmatic, with the boundary plane inclination being indeterminate. Following the development of ‘five parameter’ analysis in Carnegie Mellon University, Pittsburgh, USA, all five macroscopic degrees of freedom can be measured. With the analysis of the boundary plane, the grain boundary character distribution (GBCD) λ(Δg,
Although boundary populations in commercially pure aluminium have been measured using five parameter analysis,2 to date populations in aluminium alloys have not. The aim of this research is to measure the GBCD in aluminium alloy AA 5182, in addition to the identification of ‘special’ intergranular corrosion (IGC) resistant boundaries located in the microstructure. AA 5182 alloys are of regular use in the automotive industry, where weight reductions are crucial, and are also commonly used in beverage can ends where an increased strength aluminium alloy is required. Alloys of AA 5182 are characterised as Al–Mg alloys, with the total weight percentage of Mg giving the maximum strength level.5 However, Mg content of >3 wt- attracts IGC due to the precipitation of the β-Al8Mg5 phase along grain boundaries, where a ‘microgalvanic cell’ is created between the precipitate and the matrix.6 On identification of resistant boundaries via five parameter analysis, there is future scope for grain boundary plane engineering7 to increase the abundance of ‘special’ boundaries for resistance to IGC.
Experimental
In the present study, two samples of AA 5182 were used, cut from the same hot strip to ensure identical composition, each having 4·43Mg content. All samples were received from Hydro Aluminium, Germany, in an annealed state, with each sample having different levels of deformation and annealing cycles. One sample, referred to as flash annealed (FA) hereafter, was subjected to 45 deformation (1·65 mm thickness) and a flash annealing treatment in a salt bath for 5 min at 450°C. A second sample, denoted batch annealed (BA), was deformed to 50 deformation (1·5 mm thickness) and subjected to a simulated batch anneal for 120 min at a temperature of 350°C. The different levels of deformation were selected in order to ascertain that both samples had the same grain size after annealing. Subsequently, both samples received a second, identical, annealing at 350°C, followed by slow air cooling to room temperature, in order to equalise the final precipitation state (‘sensitisation state’) of both samples.
Susceptibility to IGC was measured in the standard nitric acid mass loss test (NAMLT) according to ASTM G67. Samples were tested in the as received condition (‘0 h’) and after an additional sensitisation annealing for 17 h at 130°C. For each material and state, two specimens with a size of ∼50×50 mm were prepared and the weight loss was determined after submersion of the samples in concentrated nitric acid for a period of 24 h. This testing was performed at Hydro Aluminium, Germany.
The samples for five parameter analysis were prepared by grinding the surface using SiC abrasive papers and diamond abrasive pastes, before final 0·05 µm SiO2 slurry polish. Crystal orientation maps were then acquired using Oxford Instruments HKL electron backscatter diffraction system on a Philips XL30 scanning electron microscope, orientations being recorded at 3 µm intervals. Any unindexed points were examined and reduced using post-acquisition software in order to obtain a cleaner image.
Data were extracted from the HKL record browser and used for five parameter analysis, where 50 000 grain boundary traces were required to obtain accurate boundary plane information. Detailed information on the five parameter method can be found elsewhere.2–4 The data were displayed in stereographic projection. These data were analysed to describe the GBCD in both FA and BA AA 5182 samples. The GBCD can be described as the population of boundary types across all misorientations specified.2 In this study, boundaries on both <111> and <110> misorientation axes were viewed at misorientations 10–60°. Each stereogram was plotted with the x direction equivalent to [100] and z direction equivalent to [001] and intensities were plotted in multiples of a random distribution (MRD).
Results
Of the two AA 5182 alloys subjected to NAMLT, it was found that BA was the most resistant to IGC, with a 31 mg cm−2 weight loss, while FA was shown to be the least resistant, with approximately a 41 mg cm−2 loss. This can be seen in Fig. 1, where a comparison of mass loss via IGC for both before and after sensitisation is shown. It is clearly visible from Fig. 1 that FA had the highest level of mass loss. This study will compare the differences in boundary character in both FA and BA, in addition to distributions of boundaries found in commercially pure aluminium, in order to gain information on the effects of precipitation on boundary plane evolution.
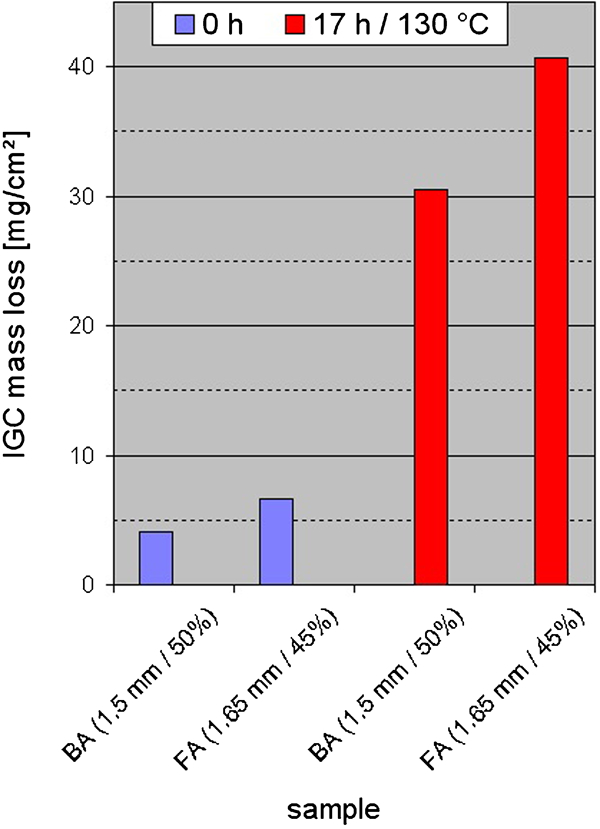
Graphical representation of mass loss during standard NAMLT for BA and FA: amount of material lost is shown for both before immersion in nitric acid (blue) and after immersion (red)
In order for the differences in boundary character to be evaluated for both FA and BA, five parameter analysis was performed. The GBCD can be considered a measure of all planes in a boundary distribution at all feasible misorientation angles,2 and can be seen in stereographic projection for both FA and BA (Fig. 2). Here a very weak preference for (111) boundaries can be seen. These peaks show some diffuseness around each <111> axis, suggesting that near <111> twist boundaries exist in this domain (see Fig. 2).
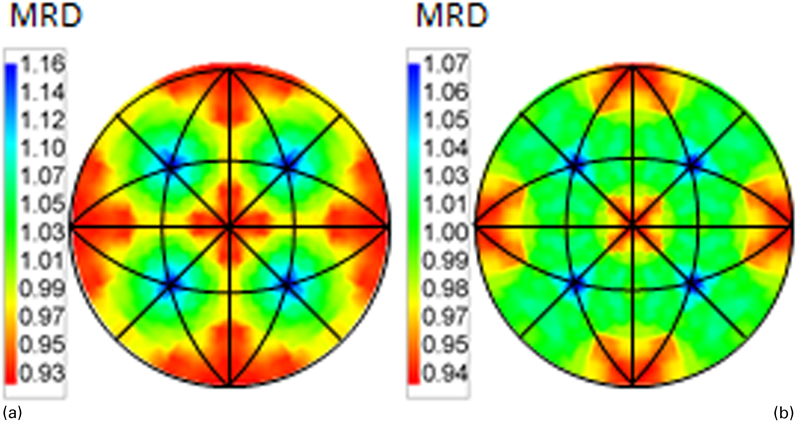
Stereographic projections to show GBCD λ(Δg,
Σ3 misorientations (60°/<111>) were found in significant levels in both BA and FA, with BA having the highest proportions, 3·63 and 2·1 respectively. Other coincidence site lattice (CSL) boundaries were found to be present, although at negligible levels. A discussion of these boundaries is included for comparison with commercially pure aluminium only.
Considering boundaries on the <111> misorientation axis, stereographic projections demonstrate the existence of <111> tilt boundaries for low misorientation angles, 5–15°, for both BA and FA, a trend which does not continue for increasing the misorientation angles. With this increase, a preference for <111> twist boundaries develops, particularly in FA which shows twist boundaries through misorientations 20–60°; BA shows this trend only at 50° misorientation. For 50 and 60° misorientations, stereograms for both BA and FA can be directly compared (Figs. 3 and 4). Both show a maximum on the (111) plane and both show diffuseness around this peak, with BA showing a distinct lack of a concise peak at 50°. This is not true for FA, where both a concise and diffuse peak exist. This trend continues for the 60° misorientation, although more weakly, with BA having the highest MRD value of 3·78, compared to 3·67 for FA. The diffuse peaks at 60° suggest a high level of incoherent Σ3s, particularly for BA. The stereographic projection of FA shows a high level of incoherent Σ3s, in addition to the existence of some coherent Σ3s [peak at (111)], a lack of which is seen from the BA 60° stereogram (Figs. 3 and 4).
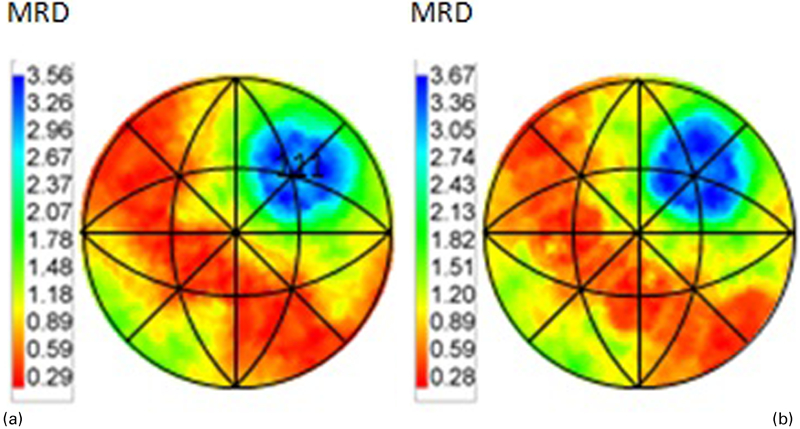
Stereographic projections to show both 50 and 60° <111> for FA, measured in MRD
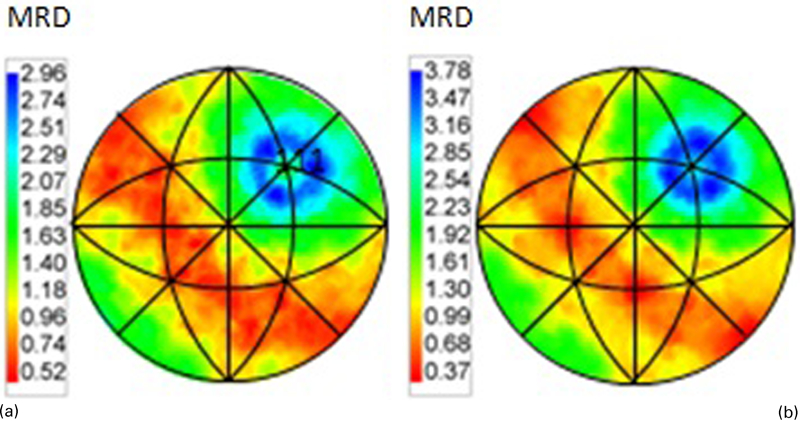
Stereographic projections to show both 50 and 60° <111> for BA, measured in MRD
To discover the intensity of these variations between the datasets (shown in Figs. 3 and 4), a ‘difference plot’ was produced, involving the subtraction of one dataset from the other. The BA data were subtracted from the FA data. These projections were created for both 50° <111> (to incorporate any near Σ3 boundaries) and 60° <111> (for the exact Σ3 boundaries); the resulting difference plots for 50°/<111> and 60°/<111> are shown in Fig. 5. For 50°/<111>, exact Σ3 boundaries are seen at an increased level, 1·74 MRD. The 60°/<111> shows a stronger preference for both coherent and incoherent Σ3 boundaries, but at a less intense level than that of 50° <111>.
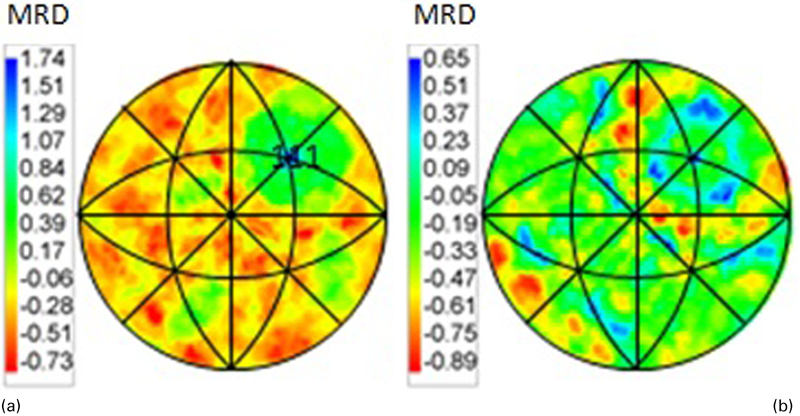
Stereographic projections of difference plots highlighting differences of MRD intensities between FA and BA AA 5182: see text for details; peaks show increased MRD values of FA AA 5182, with comparison to BA AA 5182 for a 50° and b 60° misorientations
In the case of boundaries found on the <110> axis, both AA 5182 alloys show a preference for <110> tilt boundaries at high misorientation angles, with FA demonstrating a trend for <110> tilt boundaries across the entire misorientation spectrum, 10–60°. Both show significant intensities for low angle <110> tilt boundaries, with FA and BA having MRD values of 3·38 and 3·44 respectively. These values represent the highest intensity for <110> tilt across all misorientation angles observed, implying that low to medium angle <110> tilts are the preferred boundaries on this axis (Figs. 6 and 7).
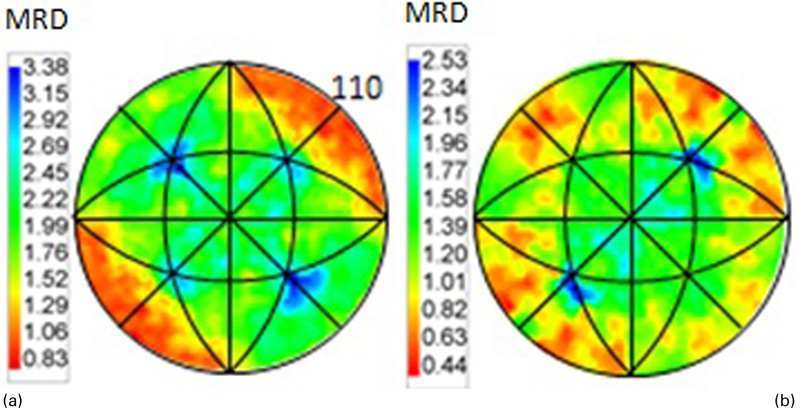
Stereographic projections of 10 and 20° <110> for FA, measured in MRD
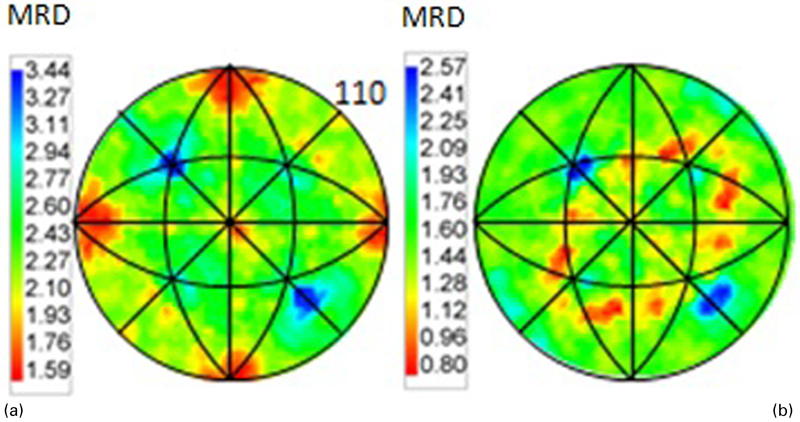
Stereographic projections of 10 and 20° <110> for BA, measured in MRD
Discussion
From previous studies using various polycrystalline materials,3,4 it has been found that an inverse correlation exists between the measured energy of a grain boundary and its existence in the boundary population.8 From the same study, various boundary types were selected and their energies evaluated specific to the host metal. For aluminium, it was determined that boundaries on the <111> plane had the lowest energies, and so were the most abundant ‘special’ boundaries. The lowest energy <111> twist boundary is the Σ3 (60° <111>) boundary. In the present work, proportions of Σ3 boundaries were measured and found to be 2·1 in FA and 3·63 in BA. Of these, it can be seen from Fig. 5 that FA had the highest preference for coherent twins. Although these boundaries are known to be of particularly low energy, they are usually restricted to the grain interior and so play little role in the boundary network.9 The BA had a higher level of incoherent Σ3 boundaries which have been found to offer some resistance to IGC in comparison to random high angle boundaries10 and BA was shown to exhibit a much lower weight loss during testing. It must be noted that the performance towards IGC resistance of such boundaries is dependent on the severity of the IGC medium, in addition to the character of the material itself.11,12 The Σ3 boundaries, particularly incoherent Σ3s, were found to be distributed throughout the boundary network in such a way as to break up a corrosion path. However, similar distributions of Σ3 boundaries were found for both FA and BA.
Alloying additions are known to have an effect on boundary evolution during recrystallisation,13 potentially limiting the proportions of boundaries which would otherwise have aligned with low index planes. The level at which this occurs depends on the proportions of alloying elements introduced to a metallic system. For example in alloys of AA 5182, large amounts of Mg and Mn are added, in comparison with commercially pure aluminium where only small amounts of additions are present. The proportions of ‘special’ boundaries are much less in the alloys than in pure Al, probably because boundary pinning occurs through the precipitation of Mg containing β-phase; Al8Mg5, and/or Mn bearing Al6Mn dispersoids. These particles often form along high energy boundaries, pinning them in place during recrystallisation and prevent the material equilibrating to a preferred low energy state, giving less ‘special’ boundaries than would otherwise be expected. The smaller levels of additions in the commercially pure Al do not allow for precipitation and are held in solid solution. Previous work has shown that this resulted in a much higher proportion of Σ3 boundaries in commercially pure Al, with stereographic projections depicting Σ3 boundaries in the range of 27·94 MRD,2 compared to 3·67 MRD for FA and 3·78 MRD for BA. Another CSL boundary for which the commercially pure Al showed an increase compared to the AA 5182 alloys was the Σ7 (38° <111>), where the MRD intensity was 6·33 compared to 2·81 for FA, which was the only alloyed sample to show a preference for this type of boundary. This result is unusual in that FA seems to have an increased level of special (111) boundaries compared to BA despite having a reduced resistance to corrosion.
Aluminium is well known to be a high stacking fault energy material,14–17 with this energy being in the region of 104 mJ m−2,14 200 erg cm−2.15 More in depth measurements detail the stacking fault energies for twins, intrinsic stacking faults and extrinsic stacking faults 60, 156 and 138 mJ m−2 respectively;16 56, 124 and 118 mJ m−2 respectively.17 It has been suggested that alloying additions may reduce the stacking fault energy of aluminium,15 allowing for the possibility of increased levels of twinning. However, as the levels of Σ3 boundaries in AA 5182 alloys do not reflect this trend, it may be true that a threshold level of additions exists, above which increased levels of twinning cannot occur.
Each of the above measures of aluminium stacking fault energy suggests a rather high value, one consequence being that true annealing twins are not formed in aluminium.18 Rather, any twins that do form exist due to geometrical constrains from texture development;19,20 e.g. a residual copper rolling texture resulting in purely coincidental twinning. Accordingly, any twins located in aluminium are of an increased energy compared to twins which form in a low stacking fault energy material such as copper where they are often found in abundance, thus in aluminium they may be more lethargic in IGC resistance by comparison.21 Nevertheless, although the energy of a twin formed in aluminium is higher than its equivalent in copper, it is still of a reduced energy compared to random high angle boundaries in either material and so can still be considered to be ‘special’. The texture which allows these twins to form and, more generally, the difference in ‘special’ boundaries between BA and FA may be explained by the different heating rates that are encountered during the final annealing treatment. Upon batch annealing, strong recovery reactions taking place before the onset of recrystallisation will alter the nucleation mechanisms and, in turn, the final recrystallisation texture.22 Considering this, as FA displayed the highest mass loss during testing, it can be suggested that in fact it is this alloy in which a less favourable GBCD is being formed.
In addition to the comparison of <111> boundaries, both FA and BA were also compared to commercially pure aluminium via the <110> boundary planes. There was little difference between BA and FA for the MRD intensities found. However, it was shown that BA had a preference for <110> tilt boundaries across the entire misorientation range. This was not true for FA, thus a further topic to discuss is the relevance of the <110> plane in the resistance to IGC. The <110> plane has previously been specified as a low energy plane in aluminium, after <111> and <100>.11 These boundaries were found to exist in the microstructure in significant populations in BA, FA and commercially pure Al, with the commercially pure aluminium showing a strong preference for <110> tilt boundaries at 60° with an MRD value of 9·66. Other significant levels of boundaries with a <110> plane occur at 39° (Σ9) and 50° (Σ11); both were tilt boundaries with MRD values of 2·05 and 3·72 respectively. The BA shows a similar trend for a preference for <110> tilt boundaries at all misorientation angles. This result, coupled with the increased corrosion resistance of this boundary, suggests that <110> tilt boundaries may show IGC resistance.
Low angle boundaries are also known to play a key role in the resistance to IGC, regardless of the boundary plane. These boundaries were previously found to be most resistant to corrosion in high purity aluminium regardless of the acidic concentration.23 This fits well with the present results as BA was found to have a significantly higher population of low angle boundaries than FA, 4·3 and 3·3 respectively.
Conclusions
In this study, the resistivity to IGC was determined for two variants of Al alloy AA 5182 (AlMg4·5Mn0·4). The two variants had identical chemical composition yet differed in their thermomechanical history, most notably, in the final annealing treatment – BA versus FA. Five parameter analysis was used to correlate the GBCD to IGC resistance. The following conclusions can be drawn.
The BA was the more resistant to IGC of the two AA 5182 alloys BA and FA.
The FA had the highest levels of (111) boundaries of the two AA 5182 alloys. Texture variants could potentially give rise to an increase in the energy associated with these boundaries, giving reduced IGC resistance as precipitation could potentially occur along these boundaries on increasing their energy.
The FA had a higher level of coherent Σ3 boundaries compared to BA. However, these boundaries were restricted to the grain interior and so did not play a role in the ICG resistance. However, the incoherent Σ3s found in both alloys, particularly BA, developed as part of the boundary network so showed resistance to IGC. These Σ3s are of a reduced energy due to the stacking fault energy in aluminium, thus the resistance of these boundaries is reduced compared to Σ3 boundaries in low stacking fault energy materials.
The BA showed significant levels of (110) boundaries across the entire misorientation angle range viewed. This suggests that these may show increased resistance to IGC compared to (111) boundaries.
Low angle boundary proportions in FA and BA followed expected trends with the alloys with the highest proportion of low angle boundaries (BA) showing increased corrosion resistance.
Alloying additions in significant levels were shown to complicate boundary evolution due to the process of precipitation, which occurred along the boundary length preventing boundaries finding their equilibrium low index planes. Very low levels of additions were not found to correspond to a reduction in ‘special’ boundaries.