
Abstract
Shear punch test was used to study the mechanical properties of Ti–6Al–4V titanium alloy laser welded joint. Meanwhile, microhardness test was used to further prove the results of the shear punch test. In order to get a better understanding of the reason why the highest mechanical properties are found in the coarse welded metal, the in situ method for viewing microvoid nucleation, growth and coalescence was applied. The in situ experiment showed that the crack in weld metal (WM) that was nucleated in the twin boundaries of the inner martensite (M) phase and the intersection of slip line and grain boundary grew rapidly once forming; in the heat affected zone (HAZ), there were three main cracks initiating, and only one propagated; microvoid was nucleated first along the interface between α and β phase in base metal (BM), the bluntness and expansion happening alternately. Except for a small amount of quasi-cleavage fracture in WM, the fracture appearance of the joint was all dimples. With the twin presented due to plastic deformation, the damage along the grain boundary area within HAZ and BM happened much more easily than in WM.
Introduction
Titanium and its alloy have been widely applied in the aerospace, medical and chemical industries due to their excellent properties, such as high specific strength, excellent biocompatibility and good corrosion resistance. With the development of materials, many welding methods such as tungsten inert gas welding, laser beam welding and electron beam welding have already been developed.1,5
Until now, laser beam welding is one of the most widely used welding methods for titanium alloy. Compared with conventional weld methods, laser beam welding has many advantages, such as high speed, precision, narrower weld bead and narrower heat affected zone (HAZ).6,7 In fact, the solidification time in a continuous laser beam welding is shorter than tungsten inert gas welding and other methods. Rapid thermal histories can lead to differences in grain size, phase composition and microstructures. In addition, mechanical properties will vary accordingly. Therefore, it is important to study the relation between mechanical inhomogeneity and microstructure gradient.
Shear punch test is considered as an appropriate method for determining the material properties of welded joints. It is first developed around three decades ago as a tool for investigating the mechanical property of small specimens.8 Moreover, it has played an important role in obtaining the mechanical behaviour of in-service equipment and is suitable for key parts of in-service component. Stewart et al.9 pointed out that shear punch test was useful for the determination of key mechanical properties across welded joints. The variation in properties across the 4130 steel welded joint can be attributed to grain size and phase composition. Kim and Lim10 considered that small punch test could help us determine the weakest local part of the weldment. In addition, the effect of microstructures on the mechanical behaviour in a P92 steel welded joint was also studied. Combining the small punch test with the finite element method, Blagoeva and Hurst11 obtained constitutive relationships in a P91 pipe line welded joint, the parameters for a damage model and remaining lifetime of the joint. Shido et al.12 also used the finite element method and small punch test for determining the cryogenic fracture toughness of austenitic stainless steel welds. In addition, Roostaei et al.13 gave the relationship between the ultimate tensile strength and shear punch test result.
During the past few years, there have appeared many investigations on the damage and fracture behaviour of homogeneous materials.14,16 The fracture process zone at the near tip of a mode I crack in a brittle material was studied by Feng and Yu.17 It was reported by Hong et al.18 that microvoid colonies at the crack tip of ductile fracture emerged continuously as the load increased. In addition, microvoids had been influenced by the grain size. The results showed that a damage zone occurred differently around the crack tip in brittle and ductile materials. Much work had been performed on the damage and fracture behaviour of titanium alloy.19,22 Some studies had successfully observed the fracture process of metals in real time using the in situ method.23,25 However, little work had been reported on the fracture behaviour of Ti6Al4V titanium alloy laser joints.
In the present work, 2·5 mm thick Ti–6Al–4V titanium alloy sheets were welded by CO2 laser welding. The shear punch test was used to determinate the material property of the laser welded joints. Meanwhile, microhardness test was used to further prove the results of the shear punch test. In order to get a better understanding of the reason why the highest mechanical properties are found in the coarse welded metal, the in situ tensile test and fractograph by a scanning electron microscope (SEM) were used to explain the phenomenon.
Experimental
Welding process
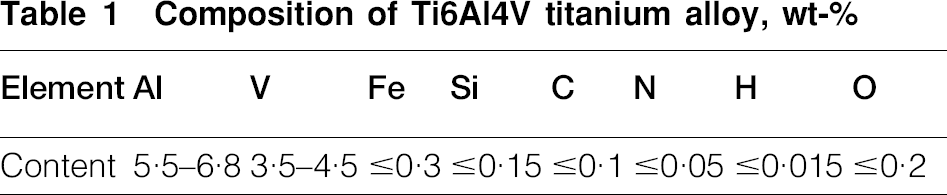
The material used in the experiment was rolled 2·5 mm thick Ti–6Al–4V titanium alloy. The composition is shown in Table. 1. The sheets were welded by CO2 laser welding, the beam power was 2500 W, the defocusing distance was 0 and the weld speed was 1·5 m min−1. In order to minimise surface oxidation, both top and bottom surface of the welds were shielded using ultra high purity argon gas (99·99) with a flowrate of 22 L min−1. After welding, microhardness was measured across the whole welded joint using an HXD-1000TMC microhardness tester with a load of 300 gf and a holding time of 15 s. In addition, the distance between each point was 0·05 mm. The welded metal was investigated by a D/MAX-2400 X-ray diffractometer. Optical photograph was photographed by a C2003B optical microscope. Specimens for optical microscopy and in situ experiment were mechanically polished with 6, 3 and 1 μm diamond paste. The final polishing was accomplished by colloidal silica of ∼40 nm diameter. Moreover, in the end, the specimens were etched with Kroll's reagent (3–5 vol.-HF and 10 vol.-HNO3 in water).
Composition of Ti6Al4V titanium alloy, wt-
Shear punch test
The shear punch tests were carried out on a CCS8000 universal tensile test machine at room temperature. The diameter of punch was 2 mm, and the punch rate was 0·024 mm min−1. In order to insure the position of the shear punch test accurately, the specimen of the shear punch test was polished and etched with Kroll's reagent. The dimension of the specimen was 10×120×0·4 mm. Meanwhile, the specimen size of the shear punch test and the sampling location are shown in Fig. 1.
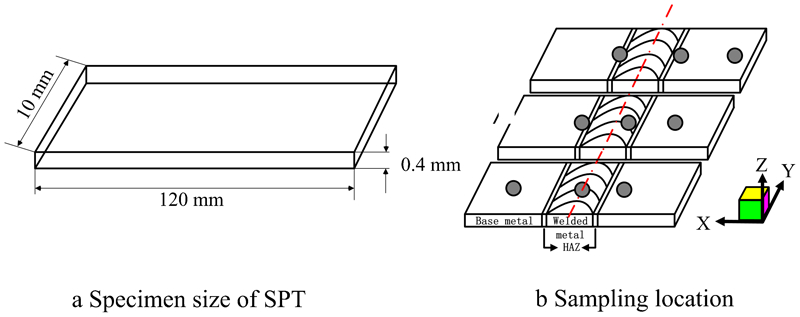
Specimen size of shear punch test and sampling location
The shear stress and normalised strain could be described by formula (1-1) and (1-2) in the works of Mahmudi et al.26 and Goyal et al.27 The load–displacement data were converted to engineering stress–strain data using the following expressions
Shear stress


In situ test
In in situ testing, the mechanical properties of the base metal (BM), weld metal (WM) and HAZ are respectively well reflected. The specimen size for in situ tensile test is shown in Fig. 2. The specimen thickness was 0·4 mm. Meanwhile, the specimen was polished and etched with Kroll's reagent. In order to insure the position of fracture accurately, a notch was cut along one side of each area in joints. The notch was cut by molybdenum wire with a diameter of 0·28 mm. Therefore, the length and width of the notch reached ∼1 and 0·28 mm respectively. In situ experiment was performed on an Instron 1195 electronic tensile platform. Meanwhile, the crack propagation process and the fracture morphology were examined by a JSM-35C SEM, and the in situ test was observed with the tension speed of 0·1 mm min−1.
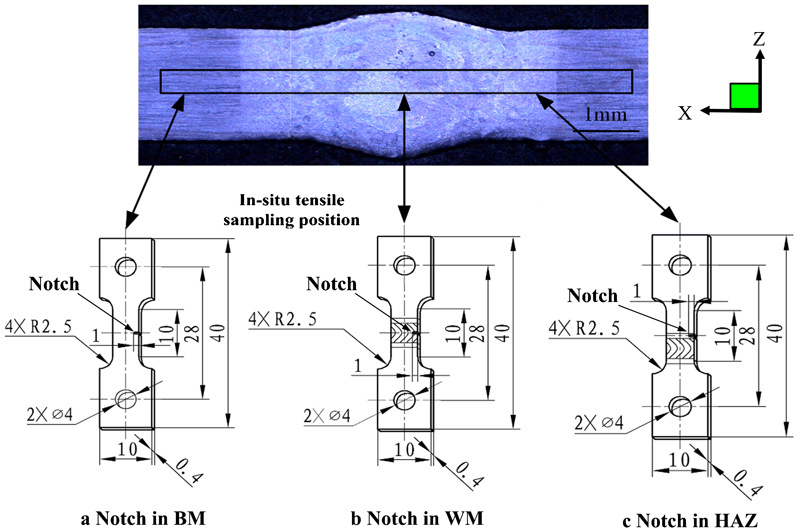
a Notch in BM; b Notch in WM; c Notch in HAZ
Experiment result and discussion
Microstructure and microhardness
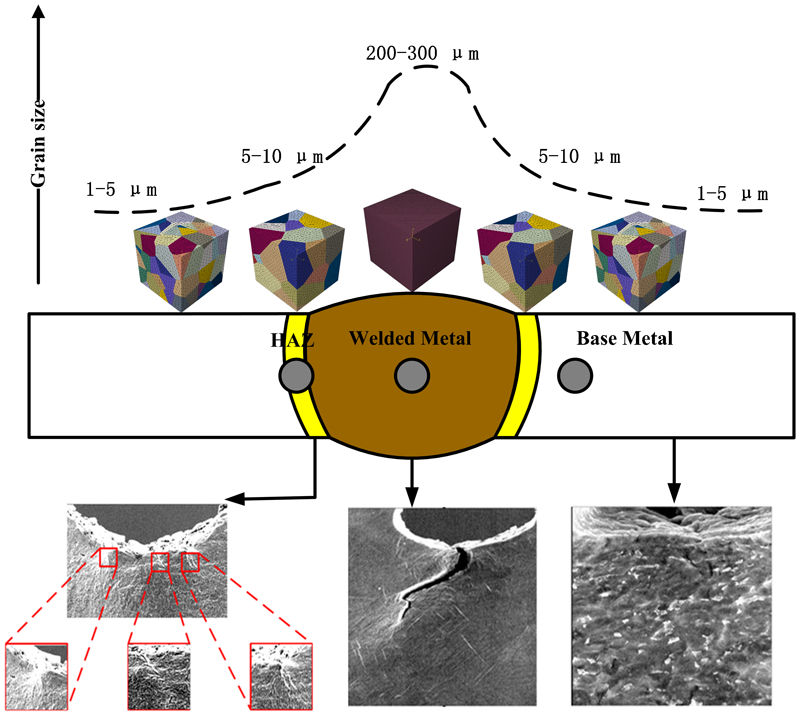
The WM is used to obtain the phase content by X-ray diffraction, and the phase of welded metal is mostly M phase, as shown in Fig. 3. The grain size of the M phase is about 200–300 μm in WM and about 5–50 μm in HAZ respectively. There is β phase existing in the HAZ near the BM. The grain size of the α and β phases is 1–5 μm in BM. Meanwhile, the microstructures of each area in the welded joint are shown in Fig. 4. The distribution of M phase becomes more dispersive from WM to HAZ due to the cooling rate, as shown in Fig. 4b and c. Kishore et al.28 considered that the M phase derives from the β phase due to the rapid cooling process. Therefore, the M phase in the WM was dominated by the grain structure of the prior columnar β phase. The β columnar grain structure is dependent on several factors: the weld thermal cycle and the shape of the weld pool.29 In laser beam welding, the fast cooling rate had substantially transformed β phase into M phase with α phase left at prior β grain boundaries, as shown in Fig. 4d.
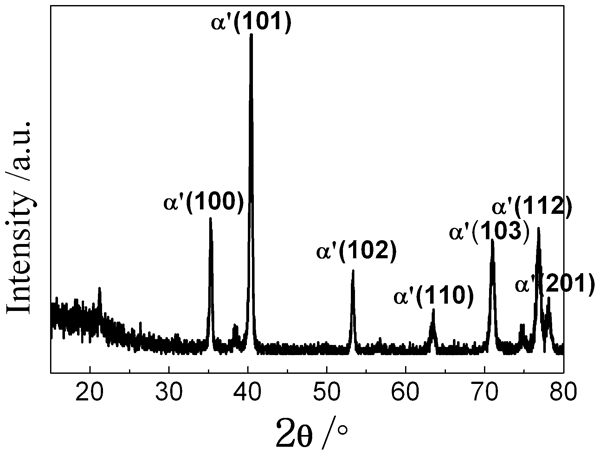
X-ray diffraction pattern of WM
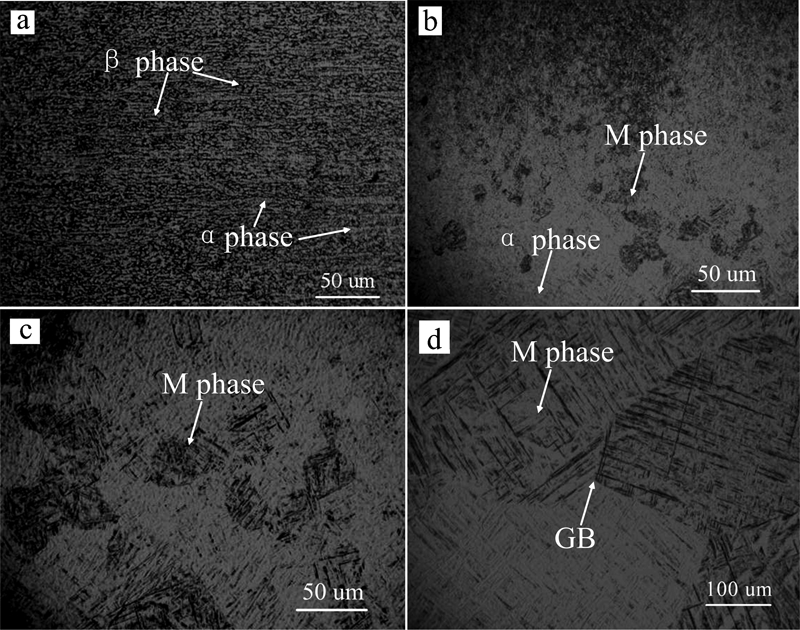
a BM; b HAZ near BM; c HAZ; d WM
The microhardness test was performed on the whole welded joint, and the result is shown in Fig. 5. It can be seen that the HV of WM is somewhat higher than that of the other areas, which is caused by the coarse M phase in WM due to the rapid cooling rate.30 Away from the welded centre, because the cooling rate is reduced to 30–70°C s−1,31,32 some finer M phases were found in the HAZ. Therefore, it is not difficult to understand the major variation in microhardness between HAZ and BM, as shown in Fig. 5. This phenomenon is consistent with the experiment data of shear punch test too. Moreover, Cao and Jahazi33 pointed out that the microhardness in WM was higher than that in BM as well because the WM was full of M phase. Therefore, the distribution of microhardness in the whole welded joint is consistent well with tensile stress. The microhardness of titanium alloy laser welded joints, systematically studied by Akman,34,35 was influenced by welding parameters, such as laser power, focus distance from base surface and welding speed. Meanwhile, it has been proved that peak power is the most important parameter that determines the penetration depth. For further discussion of the highest mechanical properties found in the coarse welded metal, the shear punch test was used in the study.
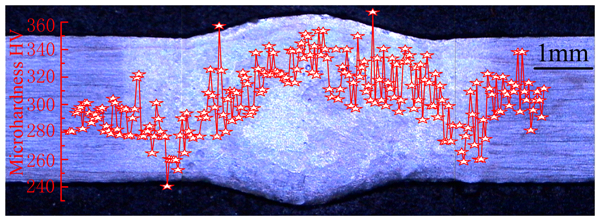
Microhardness varies with distance from weld centreline
Results of shear punch test
The load–displacement curves of the different areas from the welded centreline are shown in Fig. 6. Microhardness test is used to prove the correctness of shear punch test.9 Figure 7 shows the maximum shear stress of each point in the whole welded joints. The trends of microhardness and maximum shear stress are shown to be the same. Therefore, the test results are reliable. The maximum shear stress in WM, which is 534 MPa, is higher than that of HAZ and BM. In addition, the HAZ near the BM is the weakest link in the whole welded joint. However, the coarse M phase appears in WM; the fine M, α and β phases appear in HAZ; the fine α and β phases appear in BM. Shear stress in WM is larger than other areas, and the HAZ near the BM is just 339 MPa. In Ref. 36, it was proved that, compared to the BM, the tensile stress of WM was better due to the presence of M phase. Furthermore, Oh et al.37 investigated an (α+β double phases) titanium alloy and its welded joints; the fatigue crack propagation rate of the weld having coarse prior β phase grains was slower than that of BM. Therefore, all of the experiment results show that the mechanical property of Ti6Al4V titanium alloy in WM is higher than that of other areas. In general, the strength of fine grain metal is higher than that of the coarse one. Therefore, the in situ test is used to further investigate this phenomenon.
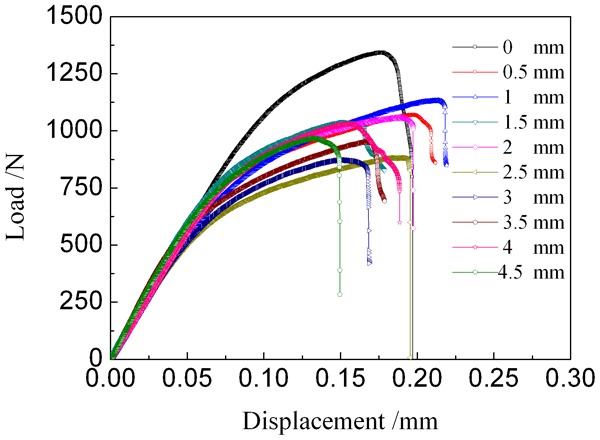
Load–displacement curves of different area in joint from welded centreline
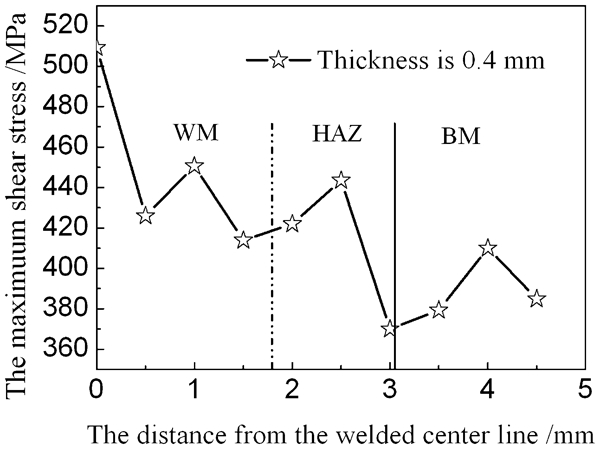
Maximum shear stress of each area in whole welded joint
Results of in situ test
Table 2 shows the test data of each in situ tensile specimen. The engineering stress–strain curves of each specimen are shown in Fig. 8. It can be seen that the tensile stress in WM is the largest, followed by HAZ, and that of BM is the lowest. Therefore, the in situ test results were consistent with the shear punch test results.
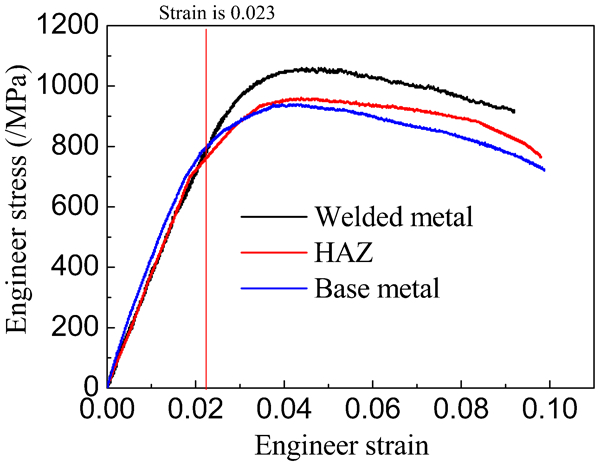
In situ test engineering stress–strain curve
Test data of in situ specimen
Welded metal
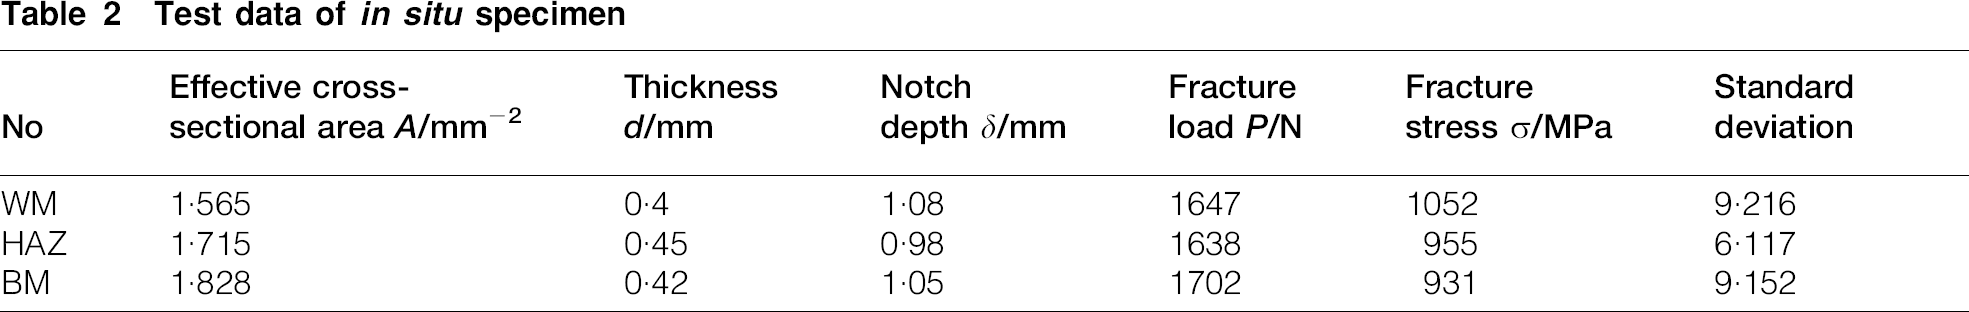
Figure 4d shows that the microstructure in WM comprises M phase, and the grain size is quite coarse. Through a preliminary investigation, the average grain size in this area ranges from 200 to 300 μm. When the engineering stress reaches 538 MPa, twin crystals appear in the interior of the different M phase, and the twin is generated differently due to the different grains of different orientation, as shown in Fig. 9a. Meanwhile, the quantity of twins in the left area is significantly greater than that in the right area, marked red box in Fig. 9a. When the engineering stress reaches 988 MPa, the grain orientation 200 μm in front of notch tip is relatively disadvantageous; many parallel slip lines appear from the α phase in the grain boundary to the interior M phase, marked arrow in Fig. 9b. When the engineering stress reaches 1029 MPa, as shown in Fig. 9c, the main crack extends mainly along intercrystalline boundaries and then expands rapidly through the microvoids with the load increasing, leading to the failure of WM. The fracture surface in this area is shown in Fig. 9d. A small amount of quasi-cleavage fracture and dimples are mixed in fracture morphology.
a local area of notch tip when engineering stress is 538 MPa; b local area of notch tip when engineering stress is 988 MPa; c local area of notch tip when engineering stress is 1029 MPa; d fracture morphology
Heat affected zone
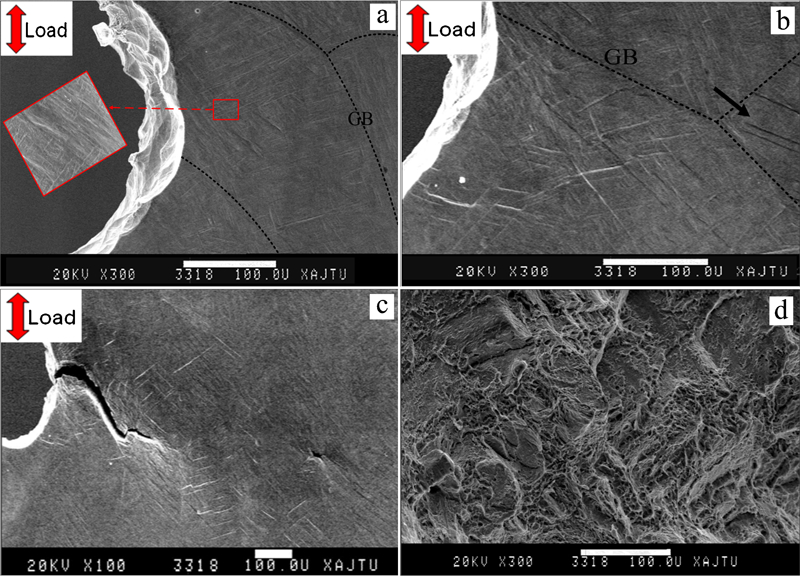
The average grain size in this area ranges from 5 to 50 μm, and the microstructure of HAZ comprises M phase and small amount of α phase. There is some β phase at the HAZ near the BM. When the engineering stress reaches 761 MPa, a large number of microcracks occurred in the front of notch. The microcracks which are relatively distant from the notch are around 2–30 μm in length, which almost equals to the grain size in this area. It is the intergranular fracture. Thus, the microcracks occur more easily along grain boundary and interface between α phase and β phase, as shown in Fig. 10a. When the engineering stress is 910 MPa, there are three main cracks in the notch tip and each crack tip has a plastic zone, as shown in Fig. 10b. Figure 10c shows that there are a large amount of long microcracks with length ranging from 10 to 40 μm existing in the front of the crack 1 in the right segment. Moreover, the distance between the microcracks equals to that of several of grains. Thus, it can be concluded that the final fracture mode is the coalescence of the microcracks, which is the typical ductile fracture, as shown in Fig. 10d.
a local region of notch tip when engineering stress is 761 MPa; b local region of notch tip when engineering stress is 910 MPa; c local region of notch tip when engineering stress is 910 MPa; d fracture morphology
Base metal
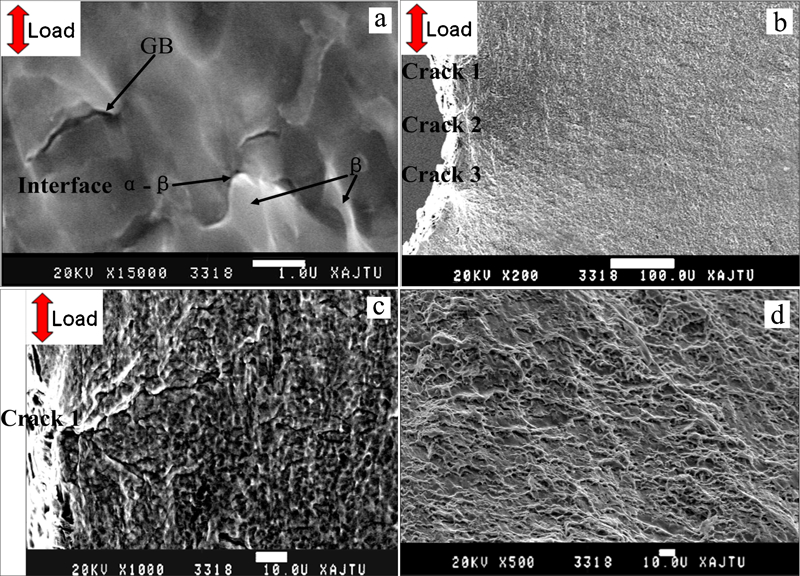
It can be observed from Fig. 4a that the microstructure of BM comprises α and β phases. It is found that the grain size of BM ranges from 1 to 5 μm, which is slightly smaller than that of HAZ. When the engineering stress reaches 540 MPa, Fig. 11a and b shows that microviods have already appeared in the front of notch. In addition, the nucleation of microviods mostly occurs in the interior of the α phase or the interface between α phase and β phase, with the average diameter of 1–3 μm, as shown in Fig. 11b. When the engineering stress is 840 MPa, as shown in Fig. 11c, the microvoids start to coalesce, and microcracks have already generated. Therefore, it can be seen that the damage at the initial stage of BM is nucleation and coalescence of microvoids. From the above analysis, the fracture behaviour of BM is the typical ductile fracture, as shown in Fig. 11d.
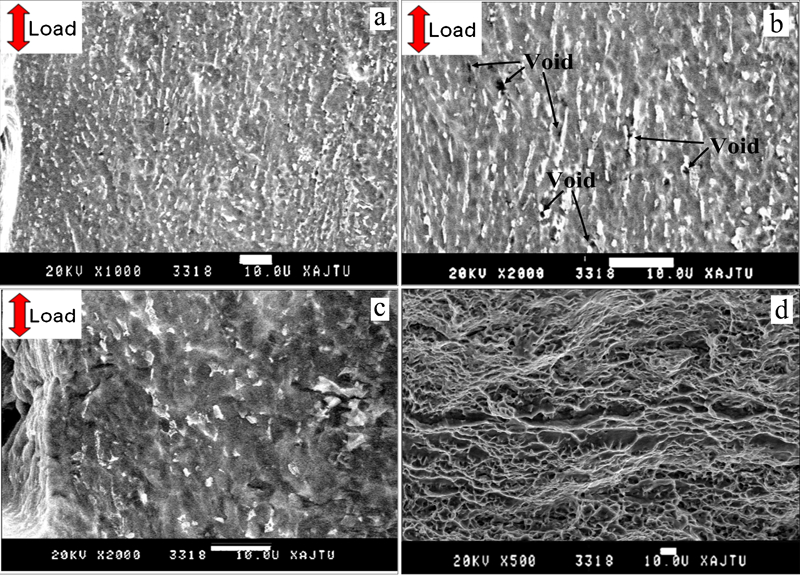
a local area of notch tip when engineering stress is 540 MPa; b local area of notch tip when engineering stress is 540 MPa; c local area of notch tip when engineering stress is 840 MPa; d fracture morphology
Discussion
From the in situ experiment results, it can be seen that the maximum engineering stress of BM is 931 MPa, and the maximum engineering stress of WM is 1052 MPa, as shown in Table. 2. The shear punch test results are shown in Figs. 6 and 7. When the distance from the welded centreline is ∼3 mm, the maximum shear stress is 369 MPa. This point is near the juncture area between HAZ and BM. therefore, with the increase in the load, the HAZ near the BM can rupture first in a welded joint. By comparing WM and BM, it is found that when the engineering stress increases to 538 and 540 MPa respectively, the damage occurs much more easily in BM than in WM. This can be proved by comparing Fig. 9a with Fig. 11b. As for grain or phase boundary, WM is surely larger than BM. Microdefects like microvoids are found easily at the interface between α and β phase and grain boundary in HAZ and BM, as shown in Fig. 10a and Fig. 11b. However, there are plenty of slip lines and twins in the interior of the different M phase in WM. As far as HAZ and BM are concerned, the diameter of the microvoid almost equals the grain size. In other words, microcracks and microvoids nucleate at the interface between α phase and β phase or grain boundary preferentially. The phenomenon is also proved by experiment work in Ref. 38. When it comes to fine grain in BM and HAZ, the grain and phase boundary area is appreciably weaker in comparison with the interior area. When the stress is small, the damage occurred much more easily in the grain or phase boundary area due to the stress concentration. As for the coarse grain in WM, when the stress is low, it is difficult to find the damage instead. The point is supported by in situ experiment.
As seen in Fig. 8, when the strain is <2·3, the engineering stress of BM and HAZ remains slightly higher than that of WM. The relationship between engineering stress and grain size has been generally accepted.39 When the strain exceeds 2·3, the stress of BM and HAZ is less than that of WM due to damage along the grain and phase boundary. As shown in Fig. 12, the schematic diagram of deformation mechanism in Ti–6Al–4V titanium alloy welded joints is different for the in situ test. When the strain exceeds 2·3, the deformation mechanism in the BM and the HAZ changes from compatible deformation to bluntness and expansion alternately once microvoids nucleated firstly along the grain boundary. In addition, the deformation mechanism in WM is not variation due to its coarse M phase. Therefore, the strain (2·3) can be used empirically as a threshold to decide whether the HAZ and BM are damaged along the grain and phase boundaries.
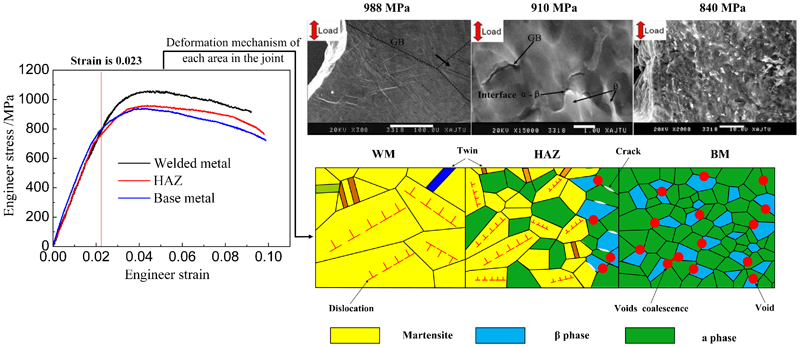
Schematic diagram of variation of deformation mechanisms
Through the in situ experiment, the failure mode of each microarea in the welded joint is totally different. The cracks extend very fast once initiated in WM; multiple cracks initiate and main crack grows in HAZ; cracks occur and blunt, and the crack tip expands throughout the microvoid colonies in BM, as shown in Fig. 13.
Fracture mode varies with distance from weld centreline
The in situ tensile test result shows that the mechanical property of the joint is influenced by the damage behaviour that occurred along the grain or phase boundary, especially for the specimens with notch in HAZ and BM. Therefore, the shear punch test results are easy to understand.
Conclusions
The trends of microhardness and the result of shear punch test are shown to be the same. Compared to the fine grained BM and HAZ, the engineering stress in WM is higher than that of other areas. The HAZ near the BM is the weakest in the whole welded joint. Further research proves that the engineering stress of BM and HAZ remained slightly higher than that of WM when the strain is small. However, when the strain exceeds 2·3, the engineering stress of BM and HAZ is less than that of WM due to the damage along the grain and phase boundaries.
As illustrated by the in situ experiment, the failure mode in the joint is as follows: the crack in WM that has nucleated in the twin boundaries of the inner M phase and the intersection of slip line and grain boundary grows rapidly once formed; in HAZ, three main cracks nucleate, and only one propagates; microvoids first nucleate along the interface between α and β phase in BM, and then the bluntness and expansion happen alternately. Except for a small amount of quasi-cleavage fracture in WM, the fracture appearance of the joint is all dimples.
The mechanical property of the joint is influenced by the damage behaviour that occurred along the grain or phase boundary, especially for HAZ and BM. This phenomenon should be paid more attention during the welding progress.
Footnotes
Acknowledgements
The authors are grateful for the support from the National Natural Science Foundation of China (grant no. 50875200) and the Ph.D. Programs Foundation of Ministry of Education of China (grant no. 20100201110065).