
Abstract
The microstructure evolution and formation of shear bands in Zr40Ti60 alloy during different cold rolling processes were studied in this article. Results indicate that the width of the shear band formed in the sample increases rapidly with the increasing of the thickness reduction of the sample, and the temperature rise caused by plastic deformation played an important role in the evolution process of the shear band. The microstructure within the shear bands much finer than that in the surrounding matrix has been confirmed, and nanosized subgrains were observed at the centre of the shear band with a width of 15 μm. Hardness tests showed that the microhardness within the shear band with a width of 15 μm (537 HV) was markedly higher than that in the surrounding matrix (410 HV).
Introduction
Shear bands, specifically adiabatic shear bands, are regions of extreme localised deformation in materials subjected to dynamic mechanical loadings, such as ballistic or hypervelocity,1,2 high speed machining, 3 dynamic punch test 4 and dynamic compression process. 5 Shear bands caused by strain localisation have been observed in many material, including Mg alloy,6–9 Al and Al alloy,10,11 Ti and Ti alloy12–14 and Zr alloy.15,16 The mechanism proposed by Zener and Hollomon 17 based on the destabilising effect of thermal softening ascribed to plastic work converted into heat is generally accepted as the explanation for the formation of shear bands. 18 During the high strain rate deformation of a metallic material, adiabatic heating may occur and the heat generated during the deformation in a particular region is retained, causing a local increase in temperature. When the effect of thermal softening caused by adiabatic heating is greater than the strain hardening effect of deformation, thermomechanical instability occurs, thereby resulting in highly localised plastic shear strain. Numerous works have been carried out to investigate microstructure in shear bands19,20 and calculate the width of the shear bands.21,22 These previous studies have shown that the microstructure inside shear bands range from highly elongated subgrains to equiaxed grains with a high angle of misorientation, as well as to fine recrystallised grains. However, most of these works focus on the observation and comparison of the microstructures of the shear band formed under different strain rates. No study has reported the effect of the degree of plastic deformation of the material under the same strain rate on the formation and evolution of the shear band. As aforementioned, shear bands are often observed during deformation at a high strain rate; however, some studies have reported on the occurrence of shear bandings in metals deformed by rolling and other quasi-static deformation modes at low strain rates.23,24 Thus, an investigation of shear bands produced by rolling is important to understand the evolution mechanism of shear banding.
Shear bands in pure Ti and Zr have been reported by many authors,25–27 but no study has been conducted on the shear banding of Zr–Ti binary alloy. Accordingly, this study aims to investigate the formation and evolution of shear bands in Zr40Ti60 alloy during different rolling processes with the same strain rate.
Experimental
Sponge zirconium (Zr+Hf≥99·5 wt-%) and sponge titanium (Ti≥99·7 wt-%) were used to prepare Zr40Ti60 alloys with an atomic percentage composition. The alloy was melted three times in a vacuum electroarc furnace to ensure uniform chemical composition. The cast alloy was sectioned into 40×15×5 mm plates. The plates were then cold rolled in a single pass using a rolling mill with a diameter of 250 mm at a rotating speed of 1·0, 0·8 and 0·7 m s−1 respectively. The thickness reduction ratio of the sample was 31, 47 and 60% respectively. The average strain rate of the samples was ∼22 s−1.
The microstructures of the deformed samples were characterised by optical microscopy (OM), scanning electron microscopy (SEM) and transmission electron microscopy (TEM). Foils for observations were cut from the longitudinal section of the rolled plates. Sample preparation for OM and SEM consisted of grinding on increasingly fine SiC papers from 180 to 2000 grit size, followed by polishing with 2·5 w diamond pastes. A mixture of 10 vol.-% hydrofluoric acid, 45 vol.-% nitric acid and 45 vol.-% distilled water was used for etching. Samples for TEM observation were thinned down to ∼40 μm thick using SiC papers. Final thinning was carried out by the two-jet technique in an electrolyte mixture containing 10 vol.-% perchloric acid and 90 vol.-% methanol. The voltage was kept constant at 13 V, and polishing was performed at 241 K.
Microhardness within and beside the shear band was measured using an FM-ARS 9000 hardness testing instrument. A load of 10 g and an indentation time of 10 s were utilised, and an average value of more than five points was reported.
Results and discussion
Microstructure observation by OM and SEM
Figure 1a shows the optical micrograph of Zr40Ti60 alloy without deformation. The microstructure of the alloy is a typical martensite because of the high cooling rate during cooling, 28 and the α lamellars are chaotically arranged. Figure 1b and c shows the typical optical micrographs of the samples with 31 and 47% thickness reduction respectively. One can see that the deformation in the samples is extremely inhomogeneous, and many heavy shear deformation zones can be observed. The angle between the heavy shear deformation direction and the rolling direction is ∼45°. The reason for this is that the shear stress is maximal along this direction during deformation process. There is no evident shear band to be observed by an optical microscope in these two samples. Figure 1d shows the optical micrograph of the sample with 60% thickness reduction. The shear band with a width of 15 μm can be clearly observed from Fig. 1d. The shear band exhibits a distinct appearance (called white etching) from the surrounding materials. More detailed microstructure analyses by SEM were carried out on the shear band shown in Fig. 1d, and the result is displayed in Fig. 1e. It can be seen from Fig. 1e that the microstructure inside the shear band is finer than that on the outside. It is particularly worth noting that some micropores arranged along the shear band direction were formed at the centre of the shear band. The reason for the formation of these micropores was that the deformation of the material at the centre of the shear band was largest during the evolution process of the shear band. The occurrence of the micropores proves the failure of the materials in the shear band. These micropores will evolve into macroscopic cracks if the deformation of the material further increases. From the above observation results, we can draw a conclusion that the non-uniformity of the deformation in the Zr40Ti60 alloy becomes more and more serious with the increase in the thickness reduction during single pass rolling process. The failure mode of the alloy is shear fracture along the shear band.
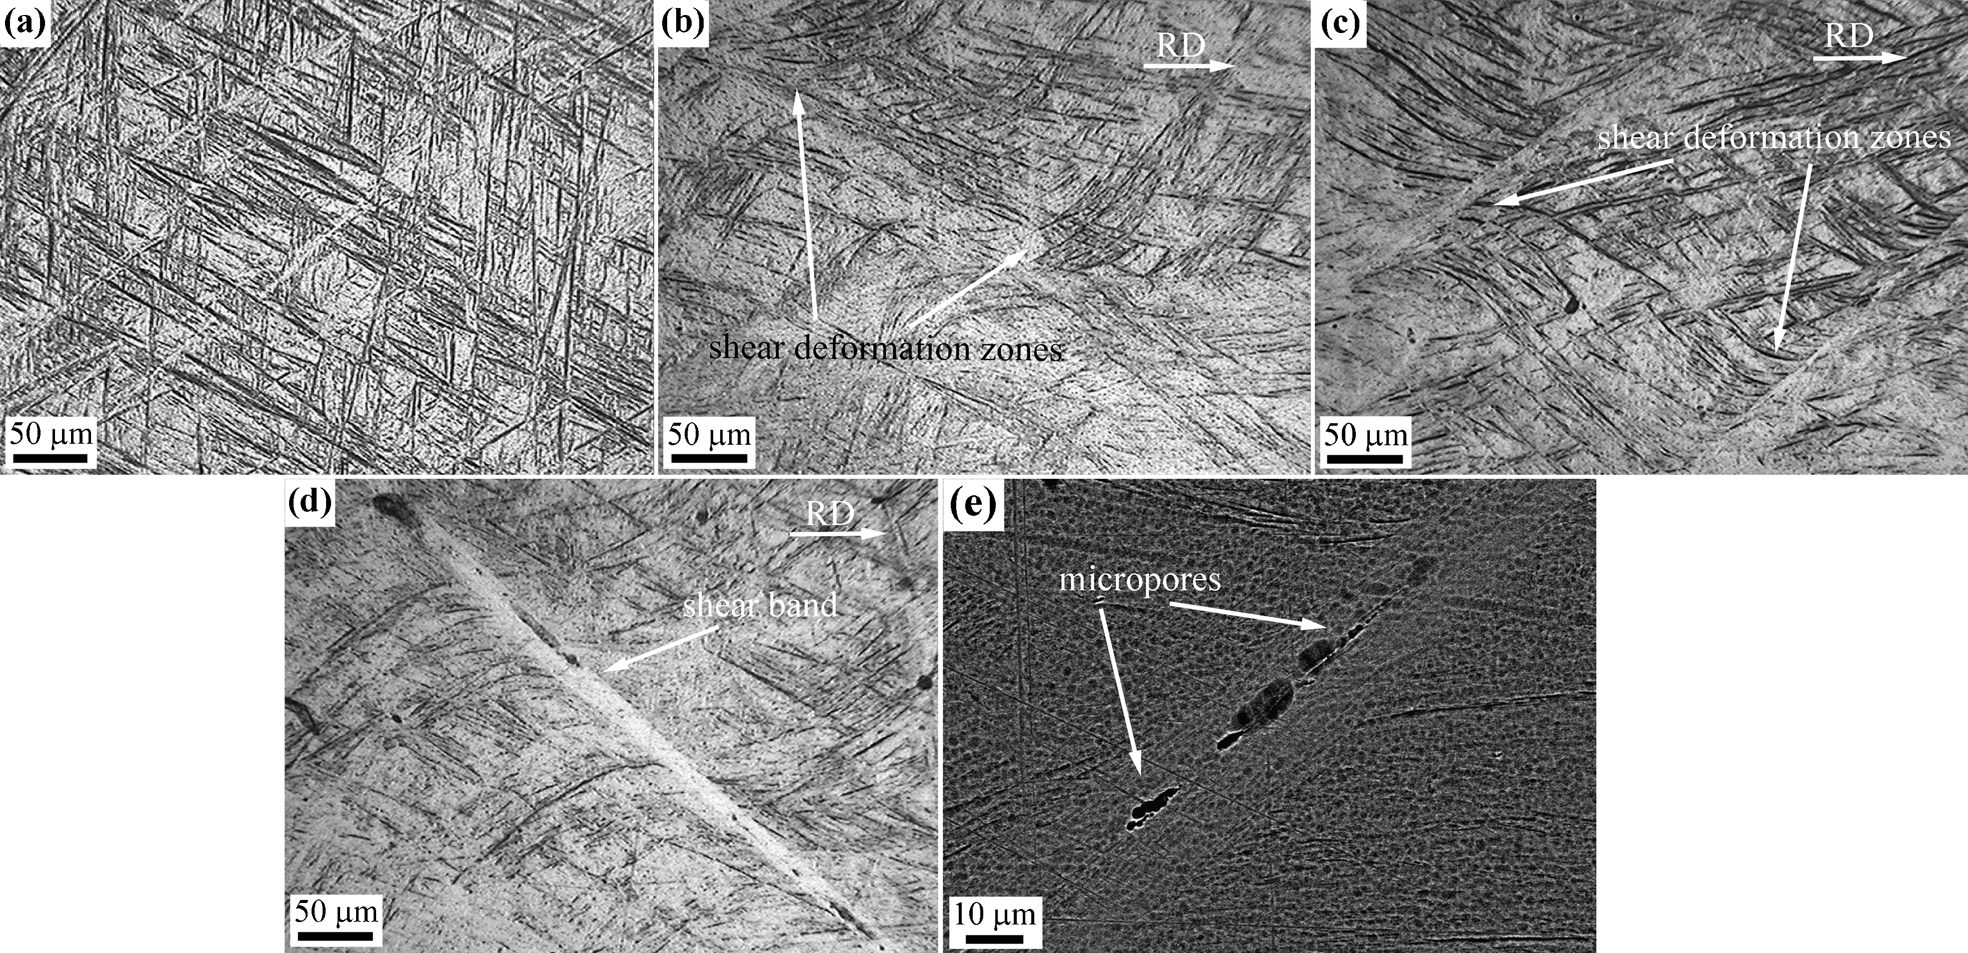
Optical microscopy images of specimens with different pass reductions a undeformed, b 31%, c 47% and d 60% and e SEM image with 60% reduction
Observation by TEM and estimation of temperature rise
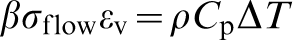
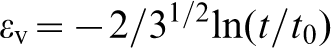
Figure 2 shows the TEM images of the samples after rolling. Shear bands can be observed in all samples by TEM, but the width of them is different. The microstructure of the shear band with 31% rolling reduction is shown in Fig. 2a; the its width is ∼0·6 μm. It can be seen that the microstructure in the shear band is much finer than that in the matrix. This result can be explained by the strain in the shear band that is much larger than that in the surrounding matrix. Figure 2b shows the shear band in the sample with the thickness reduction ratio of 47%. The width of this shear band is ∼1·5 μm, 2·5 times compared with that in Fig. 2a. The essential features of this shear band are similar to the shear band shown in Fig. 2a. The microstructure images at the centre and at the edge of the shear band with a width of 15 μm (shown in Fig. 1d) formed in the sample with the thickness ratio of 60% are shown in Fig. 2c and d respectively. It is worth noting that the increase in the width of the shear band when the thickness reduction of the sample increased from 47 to 60% is much greater than that from 31 to 47%. This result indicates that the development speed of the shear band increases with the increase in the thickness reduction of the sample during rolling process. It can be explained as the result of competition between strain hardening and thermal softening of the matrix around the shear band during the deformation process. The overall temperature rise of the sample during different rolling processes was calculated by the following equation
29
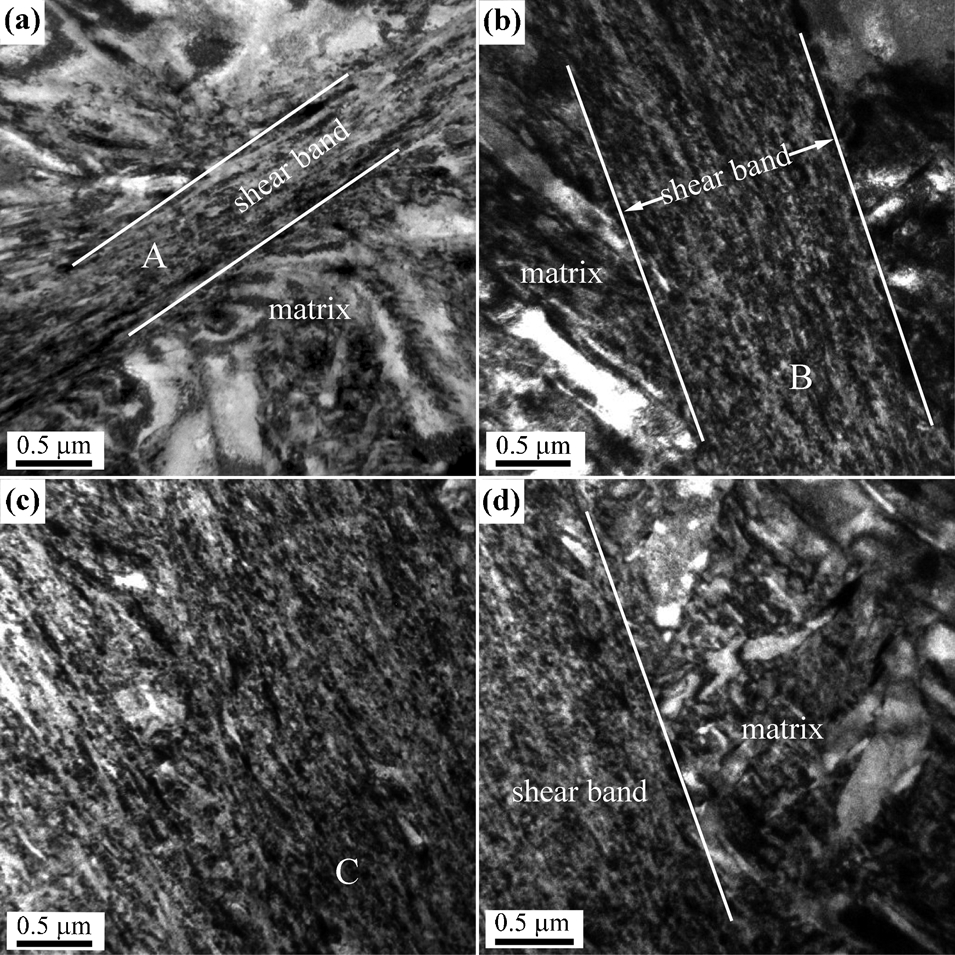
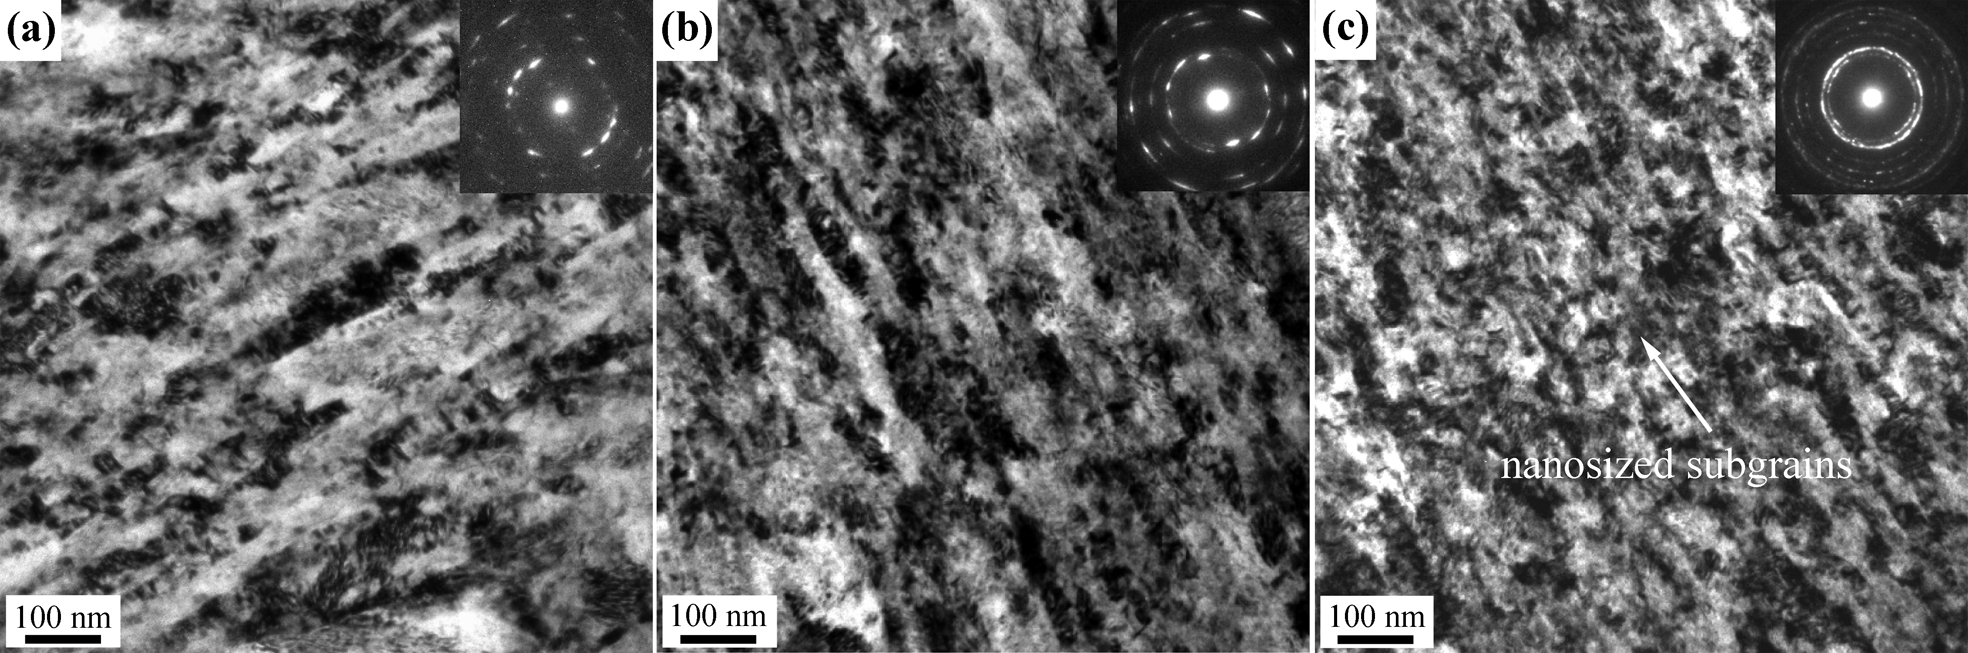
a 0·6 μm; b 1·5 μm; c 15 μm
Figure 3 shows the TEM images of the regions (marked A, B and C in Fig. 2a–c respectively) at the centre of the shear band with the width of 0·6, 1·5 and 15 μm respectively. It can be clearly seen from Fig. 3a and b that the lamellars inside the shear band are elongated and arranged along the shear band direction. The selected area diffraction patterns of the corresponding area (inset in Fig. 3a and b) exhibit diffused arcing spots, indicating large misorientations between adjacent lamellars. Compared with Fig. 3a and b, the microstructure showed in Fig. 3c is markedly different. Nanosized subgrains can be observed in it. Many of these subgrains are still linked to neighbouring ones along the shearing direction, suggesting that they are broken down from their parent elongated grains. The corresponding selected area diffraction pattern (inset of Fig. 3c) shows diffraction rings, indicating large variations in the crystallographic orientations of the subgrains. Based on the above results, it can be considered that the lamellars experienced larger plastic deformation inside the wider shear band (shown in Fig. 2c) than in the narrower ones (shown in Fig. 2a and b). Large plastic deformation may induce the fragmentation of lamellars, which eventually lead to the formation of nanosized subgrains.
Distribution of microhardness in shear band
Figure 4 provides a general view of the microhardness distribution inside and outside the shear band shown in Fig. 1d. The microhardness is the greatest (537 HV) at the centre of the shear band and gradually decreases to 410 HV when the distance to the centre of the shear band increases to 45 μm. Zurek 4 pointed out that high microhardness in the shear band can be attributed to strain hardening and grain refining. Based on the TEM results shown in Figs. 2 and 3, the fact that the microstructure within the shear band is finer than that in the surrounding matrix has been confirmed. According to the result obtained in the section on ‘Observation by TEM and estimation of temperature rise’, the overall temperature rise in the sample is 531 K, the strain hardening effect in the sample caused by plastic deformation can be weakened. Thus, the high microhardness within the shear band can be attributed to the synthetic effects of residual stress and grain refinement, but the increase in the microhardness in the matrix can only be attributed to the residual stress.
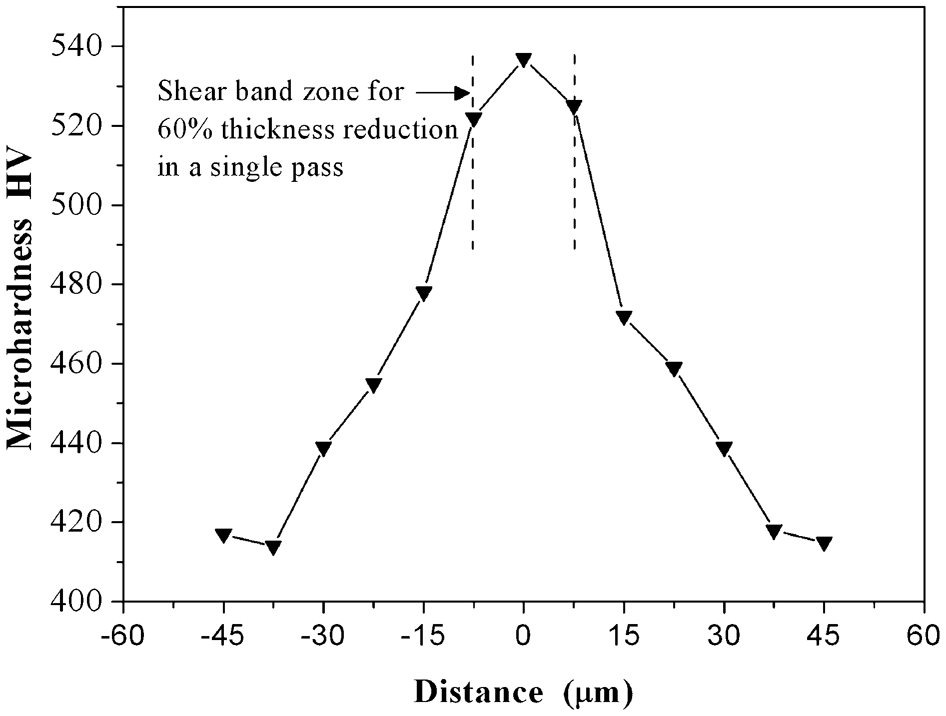
Microhardness distributions inside and outside shear band shown in Fig. 1d
Conclusions
The evolution of the microstructure in Zr40Ti60 alloy subjected to cold rolling with different pass reductions under the same strain rate of 22 s−1 was investigated. The deformation of the alloy is very inhomogeneous during rolling, and shear bands with different widths are observed. With the increase in the thickness reduction, the width of the shear band formed in the sample increases rapidly, and the microstructure inside the shear band becomes finer. The shear bands composed of the elongated and nanosized subgrains are confirmed. The microhardness test shows that hardness within the shear band is markedly higher than that of the surrounding matrix, which is due to the strengthening effect of grain refinement and residual stress. The temperature rise in the sample caused by plastic deformation plays an important role in the evolution process of the shear band.
Footnotes
Acknowledgements
This work was supported by the NBRPC (Grant No. 2010CB731600), NSFC (Grant No. 51271161/51171163/51171160/51121061) and Science and Technology Support Program of Qinhuangdao City Science and Technology Bureau (Grant No. 201302A017).