
Abstract
In near equiatomic NiTi alloys, the thermoelastic transformation between austenite and the R-phase shows unique properties, which make the R-phase transformation very promising for applications. In the present paper, the fundamental issues related to the R-phase transformation, especially the effects of different thermomechanical treatments, are reviewed. Inspired by the literature review, recent work on controlling the R-phase transformation temperature by low temperature aging treatments is summarised.
Introduction
In near equiatomic NiTi alloys, the thermoelastic martensitic transformation between B2 structured austenite (A) and B19′ structured martensite (M) gives rise to the shape memory effect (SME) and pseudoelasticity (PE). Moreover, high mechanical strength and ductility are observed in NiTi alloys.1,2 Based on the excellent functional and mechanical properties, the NiTi alloys are attracting more and more interest for practical applications.3–7 In order to improve and optimise the performance of NiTi alloys, various thermomechanical treatments can be applied, e.g. post-deformation annealing, thermal/mechanical cycling, aging, etc.8–12 During and after these treatments, an intermediate rhombohedral phase (R-phase) between B2 and B19′ phase has been frequently observed, resulting in changing the transformation path from B2→B19′ into B2→R→B19′.8,13–15 As the B2 B19′ transformation, the B2
 R also shows SME and PE.13,16–19 Moreover, compared with the B19’ transformation, the R-phase transformation shows unique properties (e.g., narrow hysteresis, high fatigue life, etc.), which attract widespread interest for practical applications. The R-phase transformation was characterised as a pre-martensitic transformation.20,21 Moreover, it was considered as a second order transformation.22,23 Now it is clear that the B2→R is an independent martensitic transformation created by the rhombohedral distortion of the B2 lattice that occurs before the B19’ transformation,16,23–27 and it is mainly considered as a first order transformation.24,28 However, the R-phase also shows second order transformation behaviour, as after the B2→R transformation, the rhombohedral angle α of the R-phase gradually decreases with decreasing temperature or increasing stress.17,21,29,30 The present review concerns mainly the practical aspects of the R-phase transformation, especially the effects of different thermomechanical treatments, and its potential as a functional material. As for the details of the crystallography and transformation mechanism of the R-phase transformation, readers may refer to the literature.25,31–34
Characteristics of R-phase
Appearance of R-phase
As shown in Fig. 1a,
35
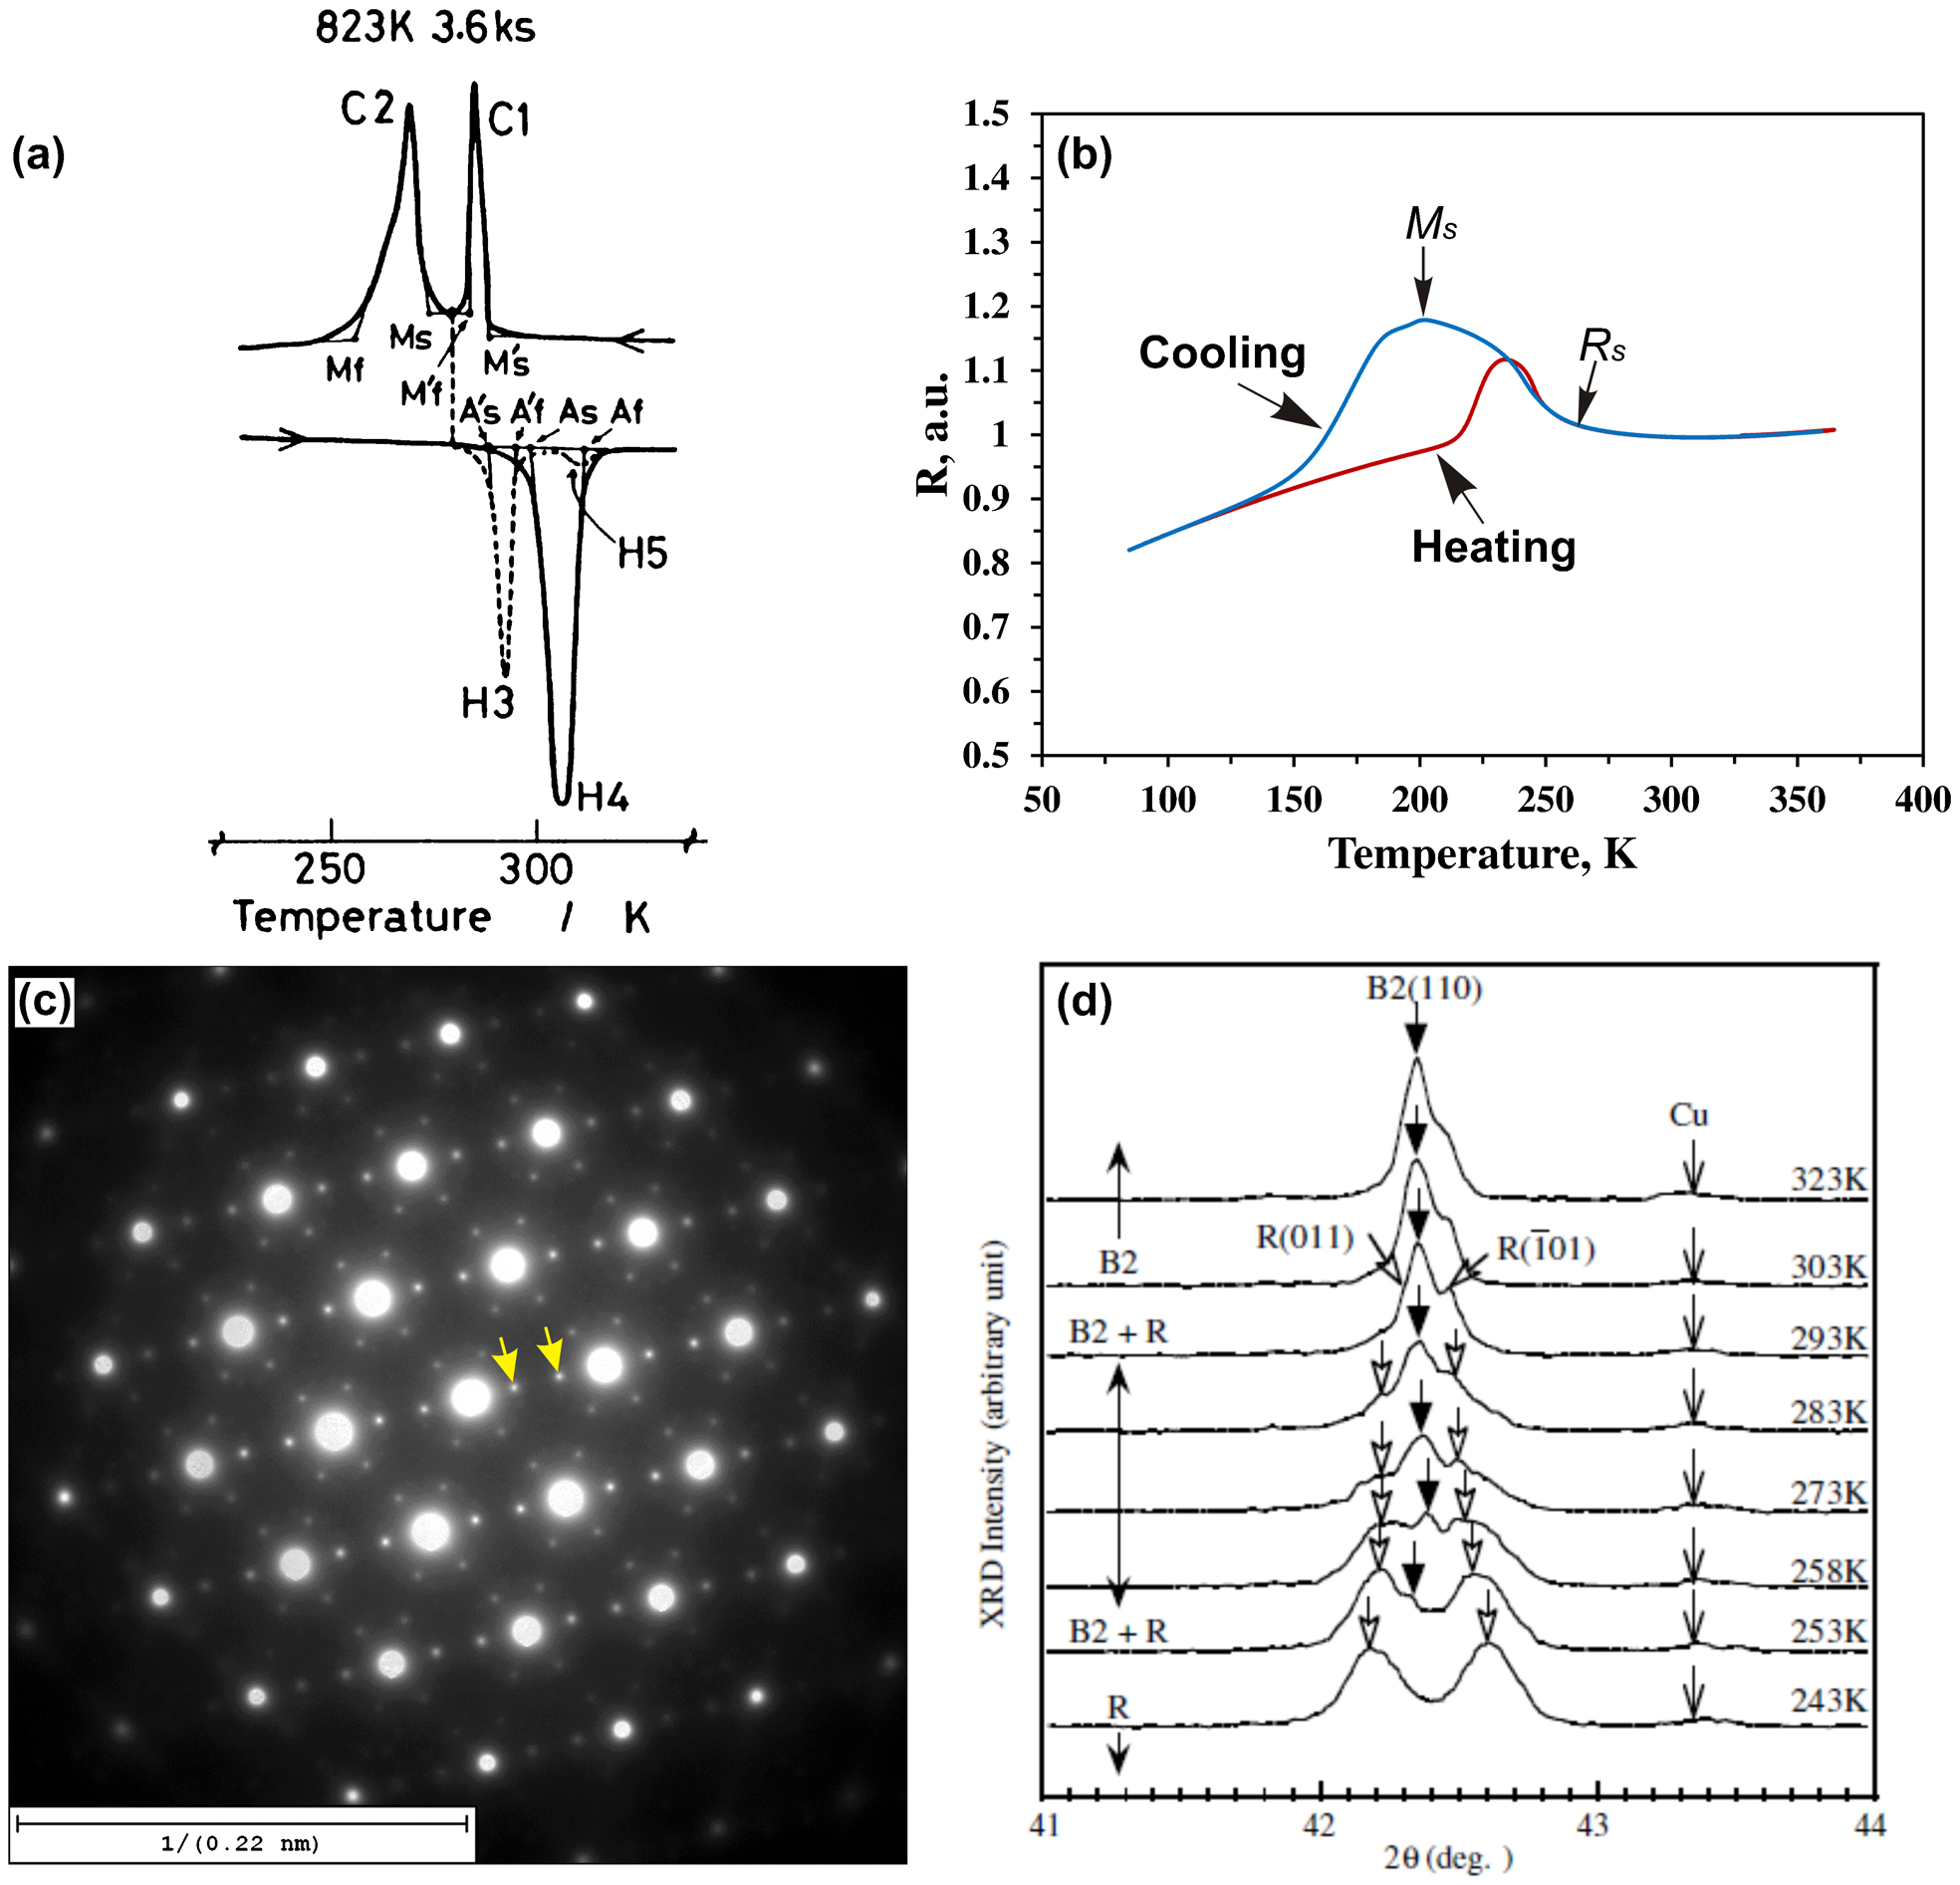
the B2→R transformation gives rise to an extra exothermic peak in differential scanning calorimetric (DSC) charts (peak C1 in Fig. 1a).24,35,36 The endothermic peak associated with the reverse R-phase transformation (peak H3 in Fig. 1a) is not always present, especially when the R-phase is completely transformed into the B19′ phase during the forward transformation. With partial DSC measurements, in which the B19’ transformation is avoided, a pair of peaks related to the forward and reverse B2 R transformation can be revealed.35,36 The hysteresis between exothermic and endothermic peaks is very small (<5°C). The appearance of R-phase is also characterised by a rapid increase in electrical resistance,17,36–40 an example is shown in Fig. 1b. The extra diffraction spots at ⅓ positions of the B2 reciprocal lattice are also an evidence of R-phase,15,24,37,41–43 as shown in Fig. 1c. The R-phase transformation also leads to splitting the (110)B2 and (211)B2 X-ray diffraction (XRD) reflections, while the (002)B2 peak remains unchanged,17,21,29,44–46 an example is given in Fig. 1d.
46
R transformation can be revealed.35,36 The hysteresis between exothermic and endothermic peaks is very small (<5°C). The appearance of R-phase is also characterised by a rapid increase in electrical resistance,17,36–40 an example is shown in Fig. 1b. The extra diffraction spots at ⅓ positions of the B2 reciprocal lattice are also an evidence of R-phase,15,24,37,41–43 as shown in Fig. 1c. The R-phase transformation also leads to splitting the (110)B2 and (211)B2 X-ray diffraction (XRD) reflections, while the (002)B2 peak remains unchanged,17,21,29,44–46 an example is given in Fig. 1d.
46
The R-phase transformation can be induced by various treatments, including thermal cycling, post deformation annealing, aging of Ni rich alloys, addition of ternary elements and so on.13,21,22,28 As for why the R-phase transformation appears after the above treatments, Ren et al. explained it by a thermodynamical approach. 47 Based on the analysis of the Landau free energy associated with both B2→B19′ and B2→R→B19′ transformations, they suggested that the multistage martensitic transformation occurs in the sequence of increasing transformation strain (or increasing transformation entropy). In fully solution annealed NiTi alloys, the B19′ phase is more stable than the R-phase; thus, only the B2→B19′ transformation occurs during cooling. The appearance of a dislocation network or coherent Ni4Ti3 precipitates introduces an additional ‘barrier’ for the martensitic transformation. As the lattice distortion associated with the R-phase transformation (around 1) is much smaller than the one associated with B19′ transformation (around 10), the additional ‘barrier’ is larger for the B19′ transformation than that for R-phase transformation. Therefore, the relative stability between R-phase and B19′ phase has changed. In this case, the R-phase is the most stable product between R-phase transformation start temperature (Rs) and B19′ transformation start temperature (Ms). Therefore, the transformation path changes from B2→B19′ into B2→R→B19′.
Deformation behaviour of R-phase
Two-stage yielding was extensively observed during tensile testing of NiTi alloys. 13 The first yield stage is attributed to the R-phase reorientation or stress induced B2→R transformation, depending on the testing temperatures.13,16,48,49 Figure 2 shows the deformation behaviour associated with the R-phase transformation at various temperatures. 13 In order to better describe the deformation behaviour of the R-phase, the stress–strain curve showing SME and PE are schematically illustrated in Fig. 3. As shown in Fig. 3a, before deformation, the R-phase is self-accommodated. 28 With increasing load, the self-accommodated R-phase is elastically deformed in stage (i). However, Šittner et al. 29 claimed that the R-phase reorientation already starts from this stage. Šittner et al. 29 found that the elastic modulus of the R-phase is lower than that of the B2 and B19′ phase. Interestingly, the elastic modulus of the R-phase gradually increases with decreasing temperatures, due to further distortion of the rhombohedral lattice structure.29,30
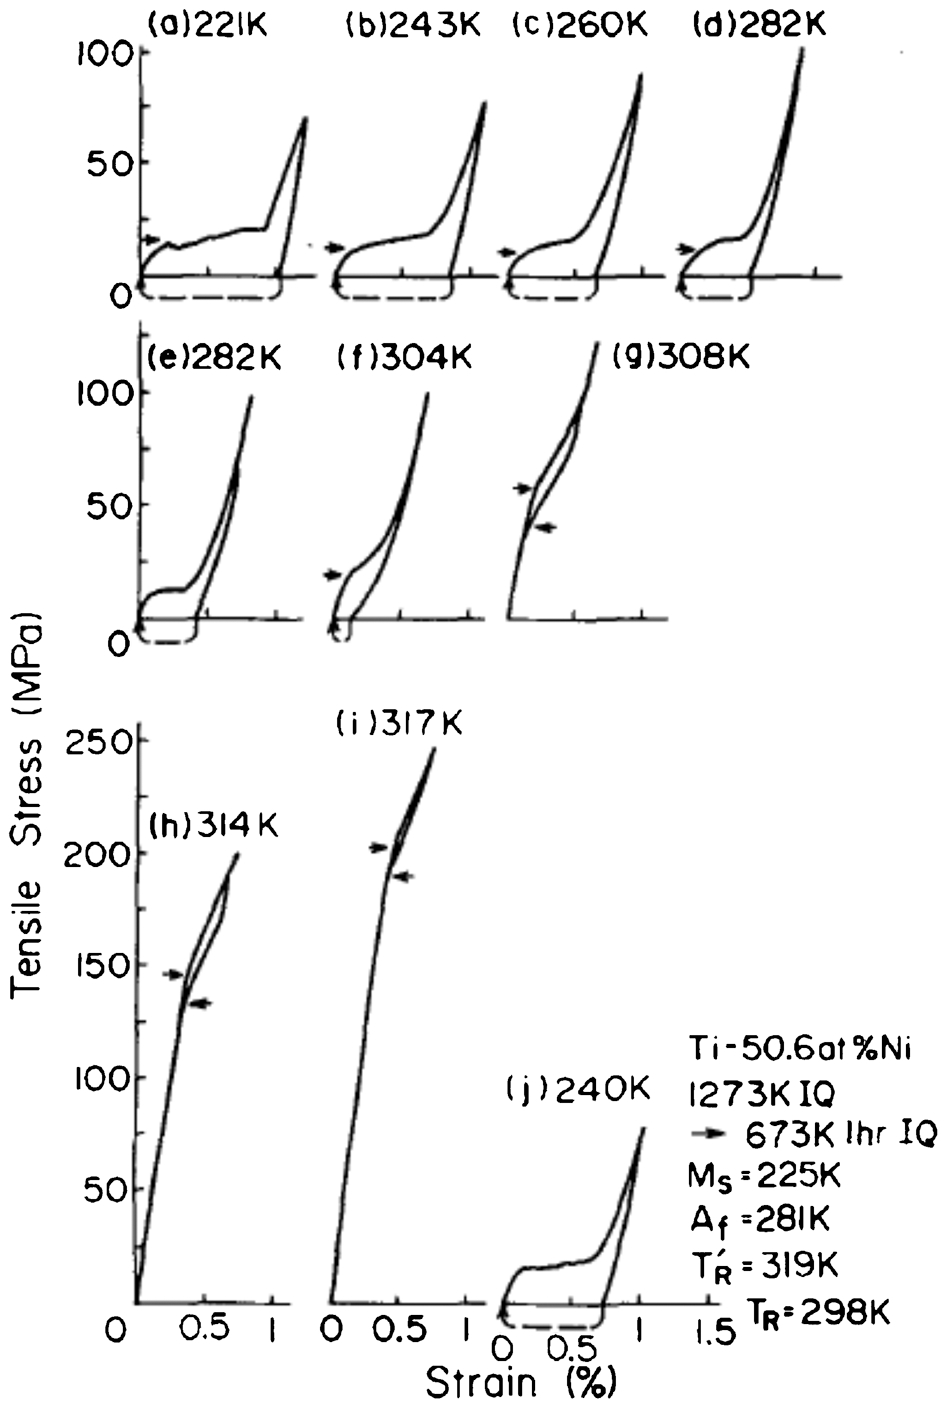
Stress–strain curves at various temperatures showing deformation behaviour of R-phase: Ti–50·6 at-Ni alloy was aged at 400°C (673 K) for 1 h after solution treatment; arrows indicate critical stress for R-phase reorientation or stress induced R-phase transformation, depending on testing temperatures; the dashed lines indicate strain recovery upon heating to 100°C 13
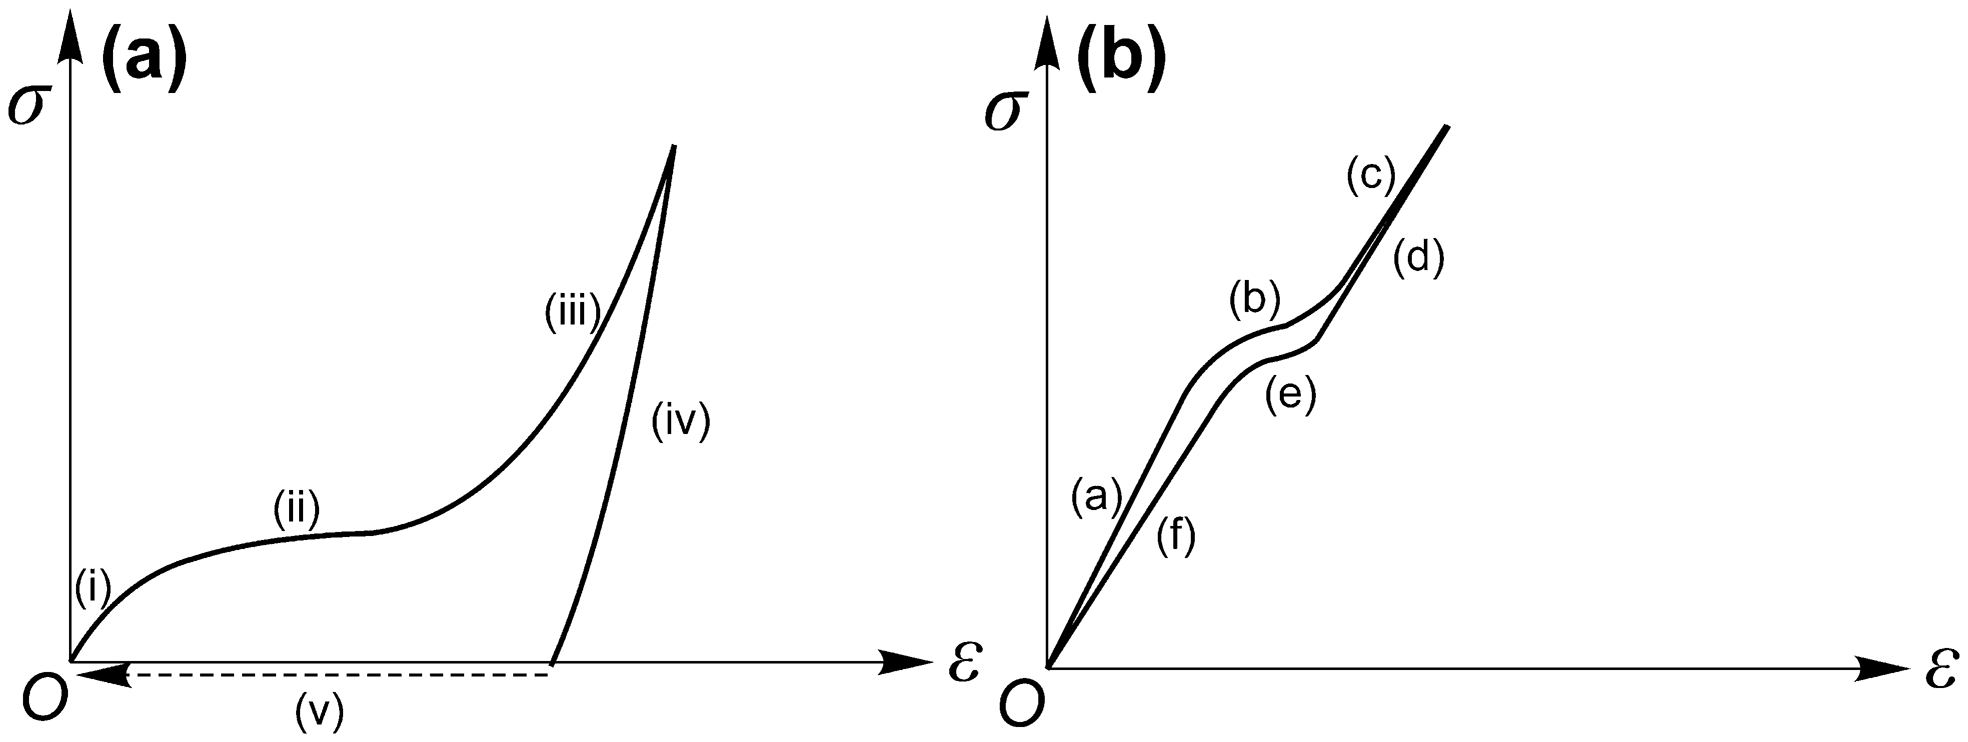
Schematic illustration of a stress induced R-phase reorientation and shape memory effects and b stress induced R-phase transformation and pseudoelasticity
The R-phase reorientation (or detwinning) takes place in stage (ii) by growth of favourably orientated variants. 23 The critical stress for inducing the R-phase reorientation is very low13,16,50 and almost insensitive to the change of testing temperatures, 16 while the critical stress for inducing B19′ martensite reorientation gradually increases with decreasing testing temperatures.48,51 Miyazaki and Otsuka found that the reorientation of the R-phase, which is induced by the appearance of dislocation networks, needs much higher stress than that of the R-phase induced by the appearance of precipitates, due to the fact that the dislocation networks can impede the twin boundary movement more strongly than the precipitates. 13
Stages (iii) and (iv) are considered as the elastic loading and unloading of the R-phase, respectively. After unloading, the residual strain in stage (v) can be recovered by increasing the temperature, leading to shape memory effects. It is found that some part of the strain is recovered by changing the rhombohedral angle of the R-phase with increasing temperatures.23,44,52 Therefore, the recoverable strain highly depends on the deformation temperature and decreases with increasing testing temperature. 16 The recoverable strain also shows an orientation dependence. The largest recoverable strain is suggested in [111]B2 direction, while the [001]B2 direction gives the smallest recoverable strain. 16
If the residual strain in stage (v) is kept constant and subjected to constrained heating, a high recovery stress can be generated due to the constrained R→B2 transformation. It is reported that the maximum recovery stress can reach a value up to 374 MPa, depending on the heat treatment and residual strain in stage (v).29,50,53
The stress–strain response of pseudoelastic behaviour associated with the R-phase transformation is illustrated in Fig. 3b. The austenite is elastically deformed in stage (a). The stress induced B2→R transformation takes place in stage (b). Unlike the stress induced B19′ transformation, which shows in a heterogeneous manner (Lüders-like behaviour),54,55 the stress induced R-phase transformation occurs in a homogeneous manner.36,56,57 The critical stress for inducing the B2→R transformation increases rapidly with increasing testing temperature. The dσ/dT value, as described by the Clausius–Clapeyron type equation, is higher for a stress-induced R-phase transformation (13–18 MPa K−1)36,49,58 than that for stress induced B19′ transformation (5–8 MPa K−1).49,58,59
Stage (c) and (d) are considered as the elastic loading and unloading process of the R-phase respectively. During unloading, the reverse transformation R→B2 occurs in stage (e), resulting in pseudoelasticity. The stress hysteresis of the pseudoelasticity associated with the stress induced B2 R transformation is very small compared with that of stress induced B19′ transformation.
13
After the elastic unloading of austenite in stage (f), the recovery to the initial shape can be achieved.
R transformation is very small compared with that of stress induced B19′ transformation.
13
After the elastic unloading of austenite in stage (f), the recovery to the initial shape can be achieved.
Unique properties and applications
In this section, the unique properties as well as the potential engineering applications of the R-phase transformation are reviewed.
Figure 4 60 shows that the R-phase transformation has a narrow hysteresis as compared with B19 (orthorhombic phase, in NiTiCu ternary systems) or B19′ phase transformation. This enables the devices, which are developed based on the R-phase transformation, to respond to a small temperature change. The R-phase transformation shows a high stability during thermomechanical cycling.52,60–64 As shown in Fig. 5, 60 the R-phase transformation has superior functional fatigue resistance than the B19′ martensite transformation during thermal cycling. The pseudoelastic cycling properties of the R-phase is shown in Fig. 6. 52 The stress–strain curves vary little over the 20 cycles, indicating a superior functional fatigue resistance of the R-phase during pseudoelastic cycling. Moreover, the R-phase transformation can generate recovery stresses (up to 374 MPa) with a fast response to the temperature change (stress recovery rate up to 17 MPa K−1).29,50,53,61 Based on the above properties, various devices have been developed based on the R-phase transformation,4,5,60,61,63 such as air conditioner sensor flaps, water mixing valves, oil volume adjustment equipment and so on. 63
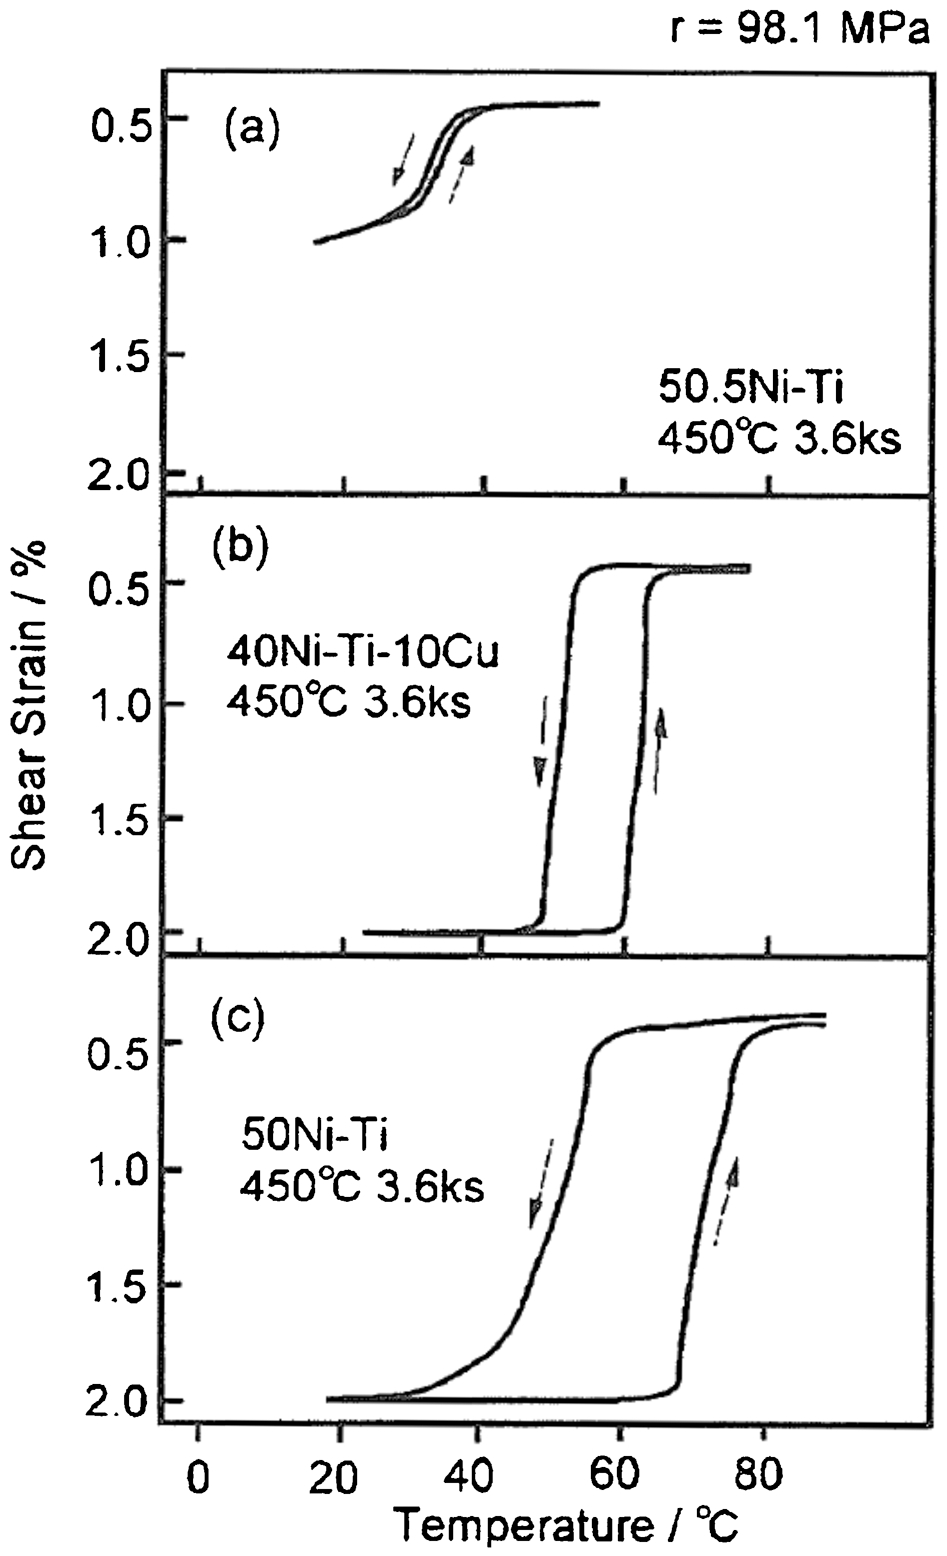
Shape memory properties of coil springs under fixed stress of 98·1 MPa of NiTi alloys associated with a R-phase transformation, b B19 martensite transformation (orthorhombic phase, in NiTiCu ternary systems) and c B19′ martensite transformation 60
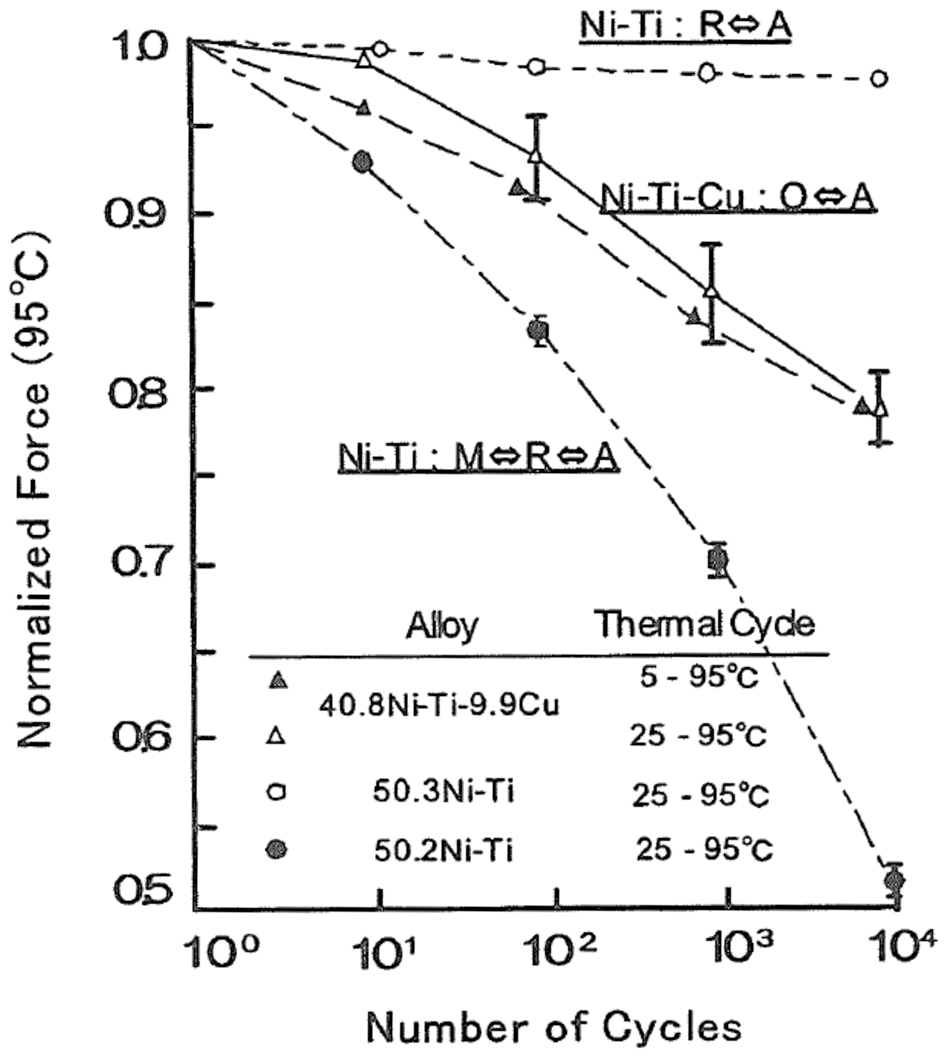
Comparison of functional fatigue resistance during thermal cycling of three types of NiTi springs associated with R-phase, B19 martensite phase (O) and B19′ martensite phase (M) transformation respectively 60
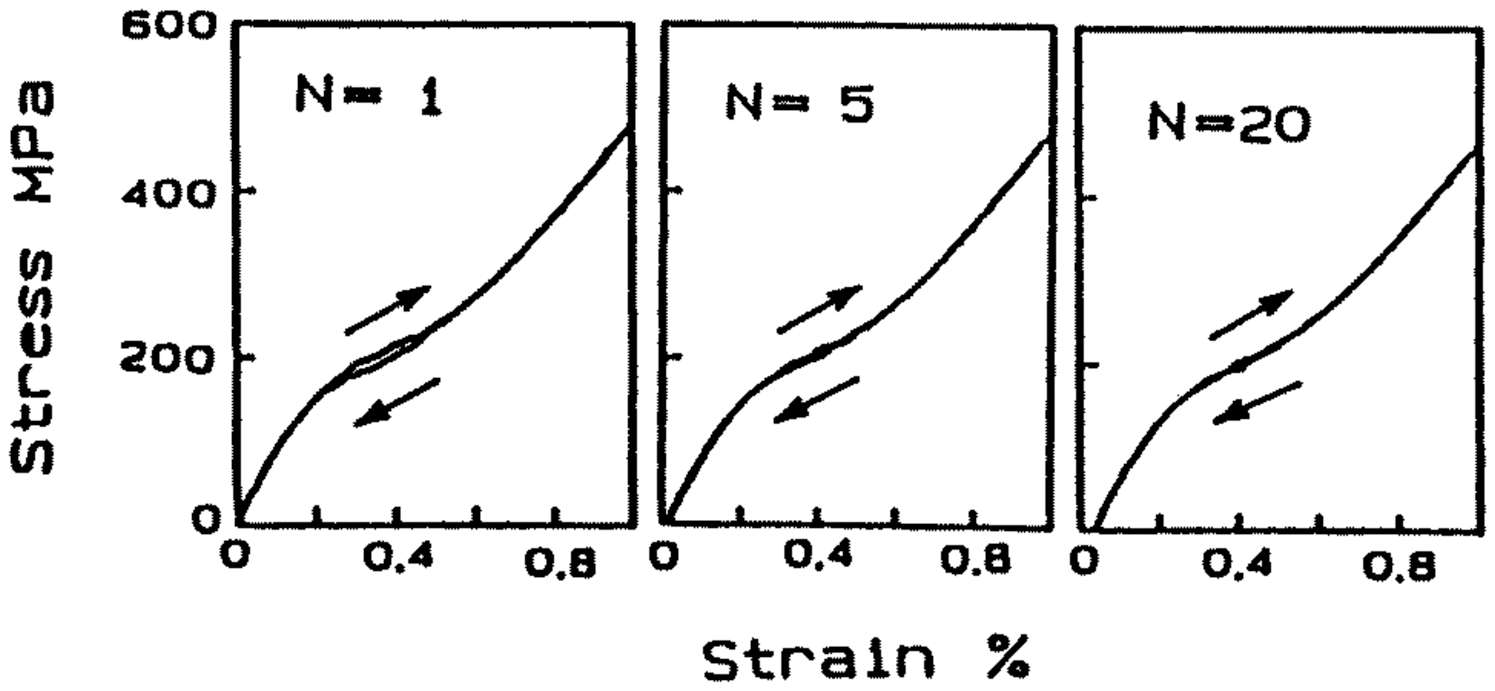
Stress–strain curves for pseudoelasticity associated with R-phase transformation under loading–unloading cycles at constant temperature 52
Based on the R-phase transformation, NiTi fibres were embedded to control the vibration frequency of a composite material.
65
The high stress–temperature rate associated with the constrained cooling/heating of pre-strained NiTi fibres in R-phase state can significantly change the internal stress conditions of the composite material with respect to the change of temperature. As a result, the vibration frequency of the structured element produced from the composite material changes remarkably within the temperature range of B2 R transformation. Moreover, the small transformation strain as well as the small thermal hysteresis associated with R-phase transformation makes it suitable for making composite materials preventing debonding.
65
R transformation. Moreover, the small transformation strain as well as the small thermal hysteresis associated with R-phase transformation makes it suitable for making composite materials preventing debonding.
65
The R-phase transformation shows a very narrow thermal or stress hysteresis, which makes it suitable for applications in microactuators with high working frequency. 66 The working frequency of a thin film using the B19′ transformation is limited at 50 Hz, and the displacement decreases with increasing working frequency from 0·2 to 50 Hz. 67 However, Tomozawa et al. 68 found that the microactuators, which were developed using the R-phase transformation of a thin film, can work at a high frequency up to 125 Hz without losing the working displacement.
The wire drawing process of NiTi alloys was initially recommended to be performed at or near the Ms temperature, as the lowest drawing stress can be achieved at this temperature range. 69 Later, Wu et al. 70 found that the wire drawing conducted in the R-phase shows a lower drawing stress than that in the B2 or B19′ phase, due to the lower shear modulus of the R-phase than that of B2 or B19′ phase.
Owing to the movement of twin boundaries, the B19′ and R-phase show a high damping capacity.71,72 The maxima of damping are observed during B2 R, R
R, R B19′ and B2
 B19′ transformation.73,74 As the thermal hysteresis of B2
 R is very narrow as compared with that of R
 B19′ and B2
 B19′ transformation, the B2
 R transformation is promising for further application on damping control.
Effect of thermomechanical treatments on R-phase transformation
In fully solution annealed binary NiTi alloys, only the B2 B19′ transformation can be observed. Precipitates or dislocations, which can be introduced by various thermomechanical treatments, are essential for inducing the R-phase transformation.13,47 The thermomechanical treatments can also affect the transformation behaviour of R-phase, especially the transformation temperatures. Therefore, it is important to investigate the influence of different thermomechanical treatments on the R-phase transformation behaviour. In this part the influence of aging treatment, thermal cycling and post-deformation annealing on the R-phase transformation behaviour are discussed.
Aging treatment
Ni4Ti3 precipitates can form during aging in Ni rich NiTi alloys.75–77 The coherent Ni4Ti3 precipitates give rise to the presence of an internal strain field76,78 around the precipitates as well as the depletion of Ni in the matrix. 79 Both the internal strain field80–82 and the concentration gradients82–84 surrounding the Ni4Ti3 precipitates were quantitatively investigated using advanced analytical electron microscopy techniques. The decrease of Ni concentration in the matrix leads to the increase of R-phase transformation temperatures. 85 The effect of the strain field around Ni4Ti3 precipitates on the R-phase transformation is twofold: (1) the strain field generated by coherent Ni4Ti3 precipitates favours the formation of R-phase;14,28,47,78 (2) the R-phase transformation is less susceptible to this strain field, as the transformation strain associated with the R-phase transformation is very small. 47 Therefore, it is considered that the main influence of Ni4Ti3 precipitates on the R-phase transformation is by changing the local Ni concentration.85,86 It is also reported that the Ni4Ti3 precipitates will lose coherency with the matrix when the precipitates are large enough. As a consequence, the R-phase transformation disappears and the transformation path changes to B2→B19′.87–89
The effect of aging time and temperature on the B2 R transformation has been systematically investigated in a Ti–51·0 at-Ni alloy.86,90 As shown in Fig. 7a,
86
when aged at high temperatures (400–500°C), the Rs is constant with increasing aging time from 1 to 72 h. However, at lower aging temperatures (250 and 300°C), Rs gradually increases with increasing aging time and the equilibrium Rs can be reached after sufficient aging time, as presented in Fig. 7b.
86
Figure 7c shows that the equilibrium Rs gradually decreases with increasing aging temperature from 300°C to 500°C,
86
due to the increasing solubility of Ni in the B2 matrix with increasing temperature.79,86 As the Ni4Ti3 precipitates produced at the aging temperature of 250°C are very fine,9,46,53 the reason for the drop of equilibrium Rs temperature at 250°C is probably due to the coherent strain field induced by the very fine precipitates. Further investigations are required here.
R transformation has been systematically investigated in a Ti–51·0 at-Ni alloy.86,90 As shown in Fig. 7a,
86
when aged at high temperatures (400–500°C), the Rs is constant with increasing aging time from 1 to 72 h. However, at lower aging temperatures (250 and 300°C), Rs gradually increases with increasing aging time and the equilibrium Rs can be reached after sufficient aging time, as presented in Fig. 7b.
86
Figure 7c shows that the equilibrium Rs gradually decreases with increasing aging temperature from 300°C to 500°C,
86
due to the increasing solubility of Ni in the B2 matrix with increasing temperature.79,86 As the Ni4Ti3 precipitates produced at the aging temperature of 250°C are very fine,9,46,53 the reason for the drop of equilibrium Rs temperature at 250°C is probably due to the coherent strain field induced by the very fine precipitates. Further investigations are required here.
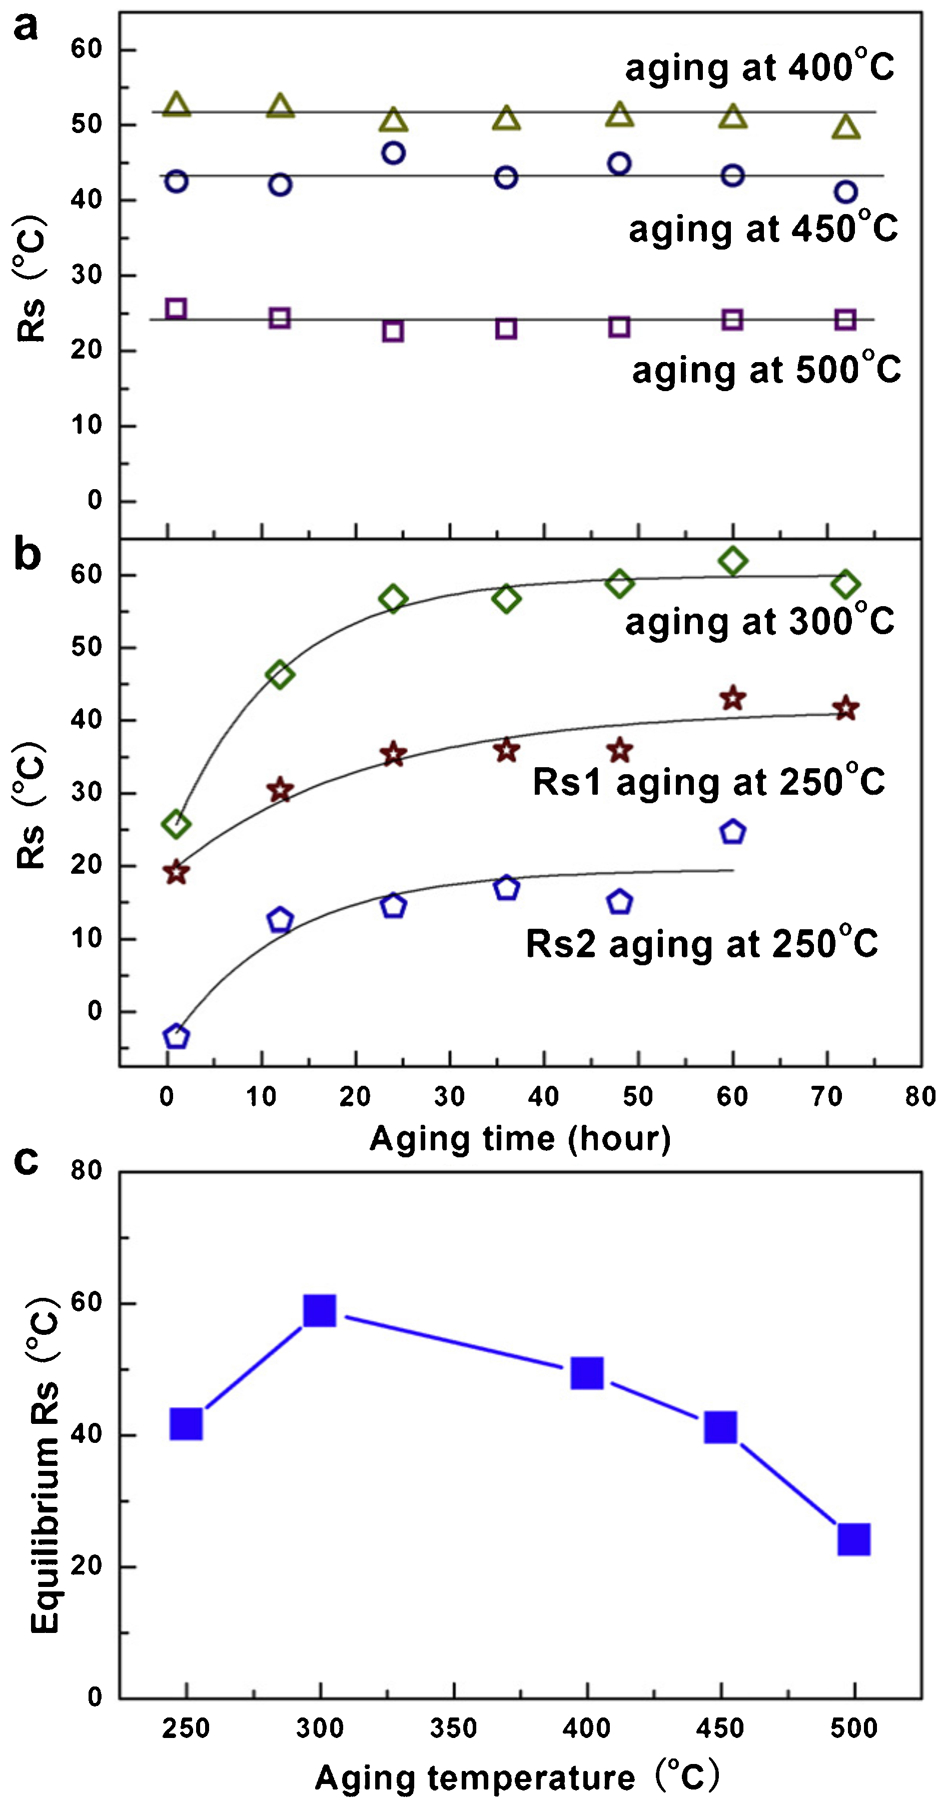
Effect of aging time and temperature on Rs temperature of Ti–51·0 at-Ni alloy, which was aged at a high temperatures (400, 450 and 500°C) and b low temperatures (250 and 300°C) for 1–72 h; c equilibrium Rs corresponding to each aging temperature 86
After low temperature aging in Ni rich NiTi alloys, a two-stage R-phase transformation has been extensively reported.46,85,86,91–93 The small scale heterogeneity between the vicinity of precipitates and the region away from the precipitates was initially considered as the origin of the two-stage R-phase transformation. 46 Now it is well accepted that the large scale microstructural inhomogeneity between the grain boundary region and the grain interior is the main reason for inducing the abnormal two-stage R-phase transformation.85,91 This was also confirmed by our previous research, in which Ti–50·8 at-Ni samples with different grain sizes were subjected to low temperature aging (250°C). 94 It is found that the samples with large grains (average grain size between 6·6 and 21·7 μm) showed two-stage R-phase transformation, while the sample with small grains (smaller than 5·6 μm) showed only one-stage R-phase transformation.
Thermal cycling
Defects, mainly dislocations, which suppress the B19′ transformation and promote the formation of R-phase,28,47,62 can be generated during the thermally induced B19′ transformation cycling.37,62,78,95 The volume fraction of the R-phase as reflected in the value of electrical resistance15,38 and transformation heat 96 increases gradually with increasing thermal cycles. After a certain number of cycles, the volume fraction of R-phase is stable with respect to thermal cycles. 15 This is mainly because a saturation of defects introduced by thermal cycling is achieved after a certain number of thermal cycles. 97 The initial state of the material can affect the cycling numbers for stabilising the R-phase.15,62 Uchil et al. 15 reported that in a Ti rich alloy after post-deformation annealing, the cycling numbers for stabilising the R-phase gradually increase with increasing annealing temperature from 410 to 520°C. Interestingly, it appears that the chemical composition also affects the formation of R-phase during thermal cycling, as a Ti–48·0 at-Ni alloy was subjected to thermal cycling, but no R-phase transformation was observed after 70 thermal cycles. 98
As the lattice distortion associated with the R-phase transformation is very small, 99 the R-phase transformation temperature is less sensitive to the thermal cycles when compared to the B19’ transformation.62,97,100,101 Some researchers reported that the R-phase transformation temperatures in the fully solution treated samples are constant with respect to the thermal cycles.62,101 However, a slight increase of R-phase transformation temperatures with increasing thermal cycles was also observed.96,98,100 The R-phase, which is induced by post-deformation annealing, is very stable during thermal cycling,10,62,102 due to the fact that the defects introduced by cold deformation may hinder the generation of defects during thermal cycling. 62 Precipitates are considered to have the same effect. Miyazaki et al. 62 reported that the temperature of R-phase transformation induced by aging treatment is constant during thermal cycling. However, a gradual increase of R-phase transformation temperatures was observed in an aged Ti–51·0 at-Ni alloy during cycling up to 104 cycles, and the transmission electron microscope observations showed that the matrix between Ni4Ti3 precipitates was heavily distorted by some lattice defects after thermal cycling. 103 This is probably due to the difference in size of the precipitates in the above two studies, as the aging temperature is 400°C in Miyazaki's investigation, 62 while a higher aging temperature of 500°C was selected in Tadaki's research. 103 Owing to the formation of N4Ti3 precipitates, a stronger increase of R-phase transformation temperatures was observed during thermal cycling by increasing the maximum cycling temperature (Tmax), as shown in Fig. 8. 104
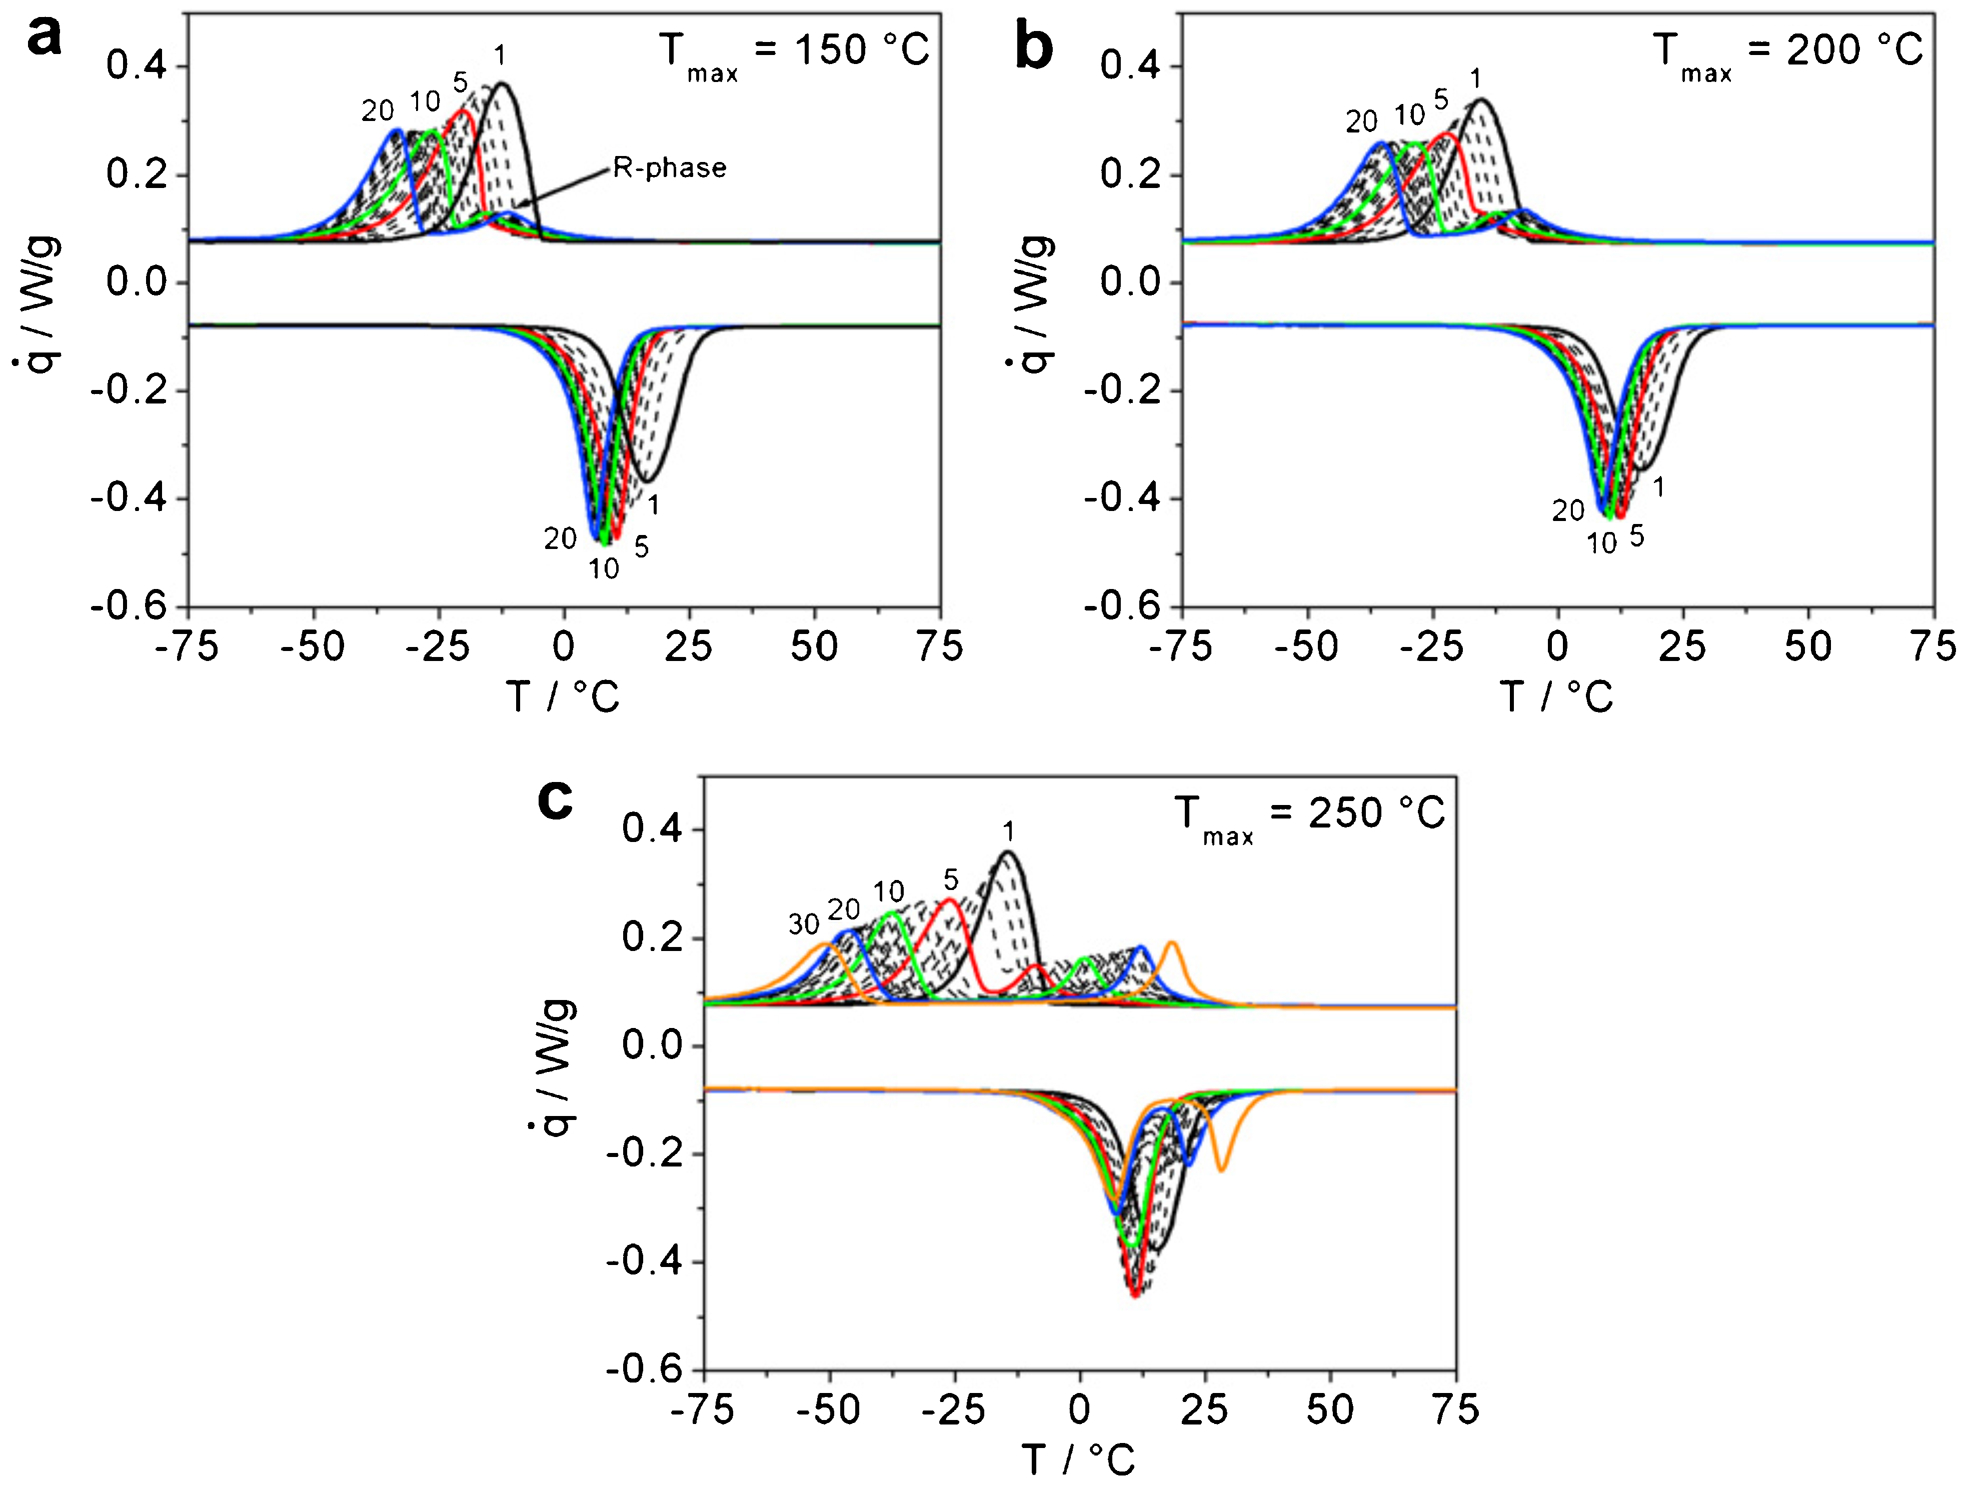
a 150°C; b 200°C; c 250°C
As for the thermal cycling under constant load, Stachowiak and McCormick 58 found that the strain associated with the R-phase transformation gradually decreases with increasing applied load. Moreover, during thermal cycling under constant load, an increase of the B19′ transformation temperatures with increasing thermal cycles under load was observed, while the R-phase transformation was rather stable. Therefore, after a sufficiently large number of cycles, the yield stage associated with R-phase transformation merged together with the B19′ transformation. 58
Post-deformation annealing
As discussed above, during thermal cycling, the R-phase transformation is mainly influenced by the density of dislocations, which are introduced by the thermally induced martensite transformation cycles. The change of the Ni concentration by the formation of Ni4Ti3 precipitates is the main factor influencing the R-phase transformation in the aged samples. However, the effect of post-deformation annealing treatment on the R-phase transformation is rather complicated, because both the change of dislocation density and the appearance of precipitates can occur. It is therefore important to understand how the R-phase transformation is affected by the post-deformation annealing treatment.
The R-phase transformation, which is observed in the post-deformation annealed samples, occurs in a wide temperature range.8,96,105–107 The DSC peaks associated with the R-phase transformation become sharper with increasing annealing temperatures, and finally merge with the B19′ transformation peaks, 8 when recrystallisation occurs. With increasing annealing temperature between 350 and 550°C, the decrease of R-phase transformation temperatures and increase of B19′ transformation temperatures were extensively observed in Ni rich8,35,96,97,108–111 alloys. Many researchers attributed the decrease of R-phase transformation temperatures to the annihilation of dislocations. However, it is also reported that the R-phase transformation temperatures are constant in the Ti rich alloys with respect to the annealing temperatures (340–410°C) 15 or annealing time (from 10 s to 123 days). 112 Moreover, the Ni4Ti3 precipitates were reported in the Ni rich alloy after post-deformation annealing,13,113 while no Ni4Ti3 precipitates were observed in Ti-rich alloys. 13 Therefore, the annihilation of dislocations may be not the only reason for the decrease of R-phase transformation temperatures in Ni rich alloys.
Park et al. 114 found that the change of R-phase transformation temperatures in a Ti–50·9 at-Ni alloy during post-deformation annealing depends on the competition between annihilation of dislocations and formation of Ni4Ti3 precipitates. When annealing at 400°C, the decrease of dislocation density is insignificant, while the formation of Ni4Ti3 precipitates, which causes the depletion of Ni concentration in the matrix, gradually proceeds with increasing annealing time. Therefore, an increase of R-phase transformation temperature is observed, as shown in Fig. 9a. 114 With increasing annealing temperature to 450°C, the effects caused by the annihilation of dislocations and the formation of Ni4Ti3 precipitates may offset each other. As a result, the R-phase transformation temperature is stable with increasing annealing time, as shown in Fig. 9b. 114 Owing to the high annealing temperature of 500°C, the annihilation of dislocations is more severe. Moreover, the depletion of Ni is small due to the higher solution solubility at 500°C.79,86 Therefore, the R-phase transformation temperatures decrease with increasing annealing time, as shown in Fig. 9c. 114
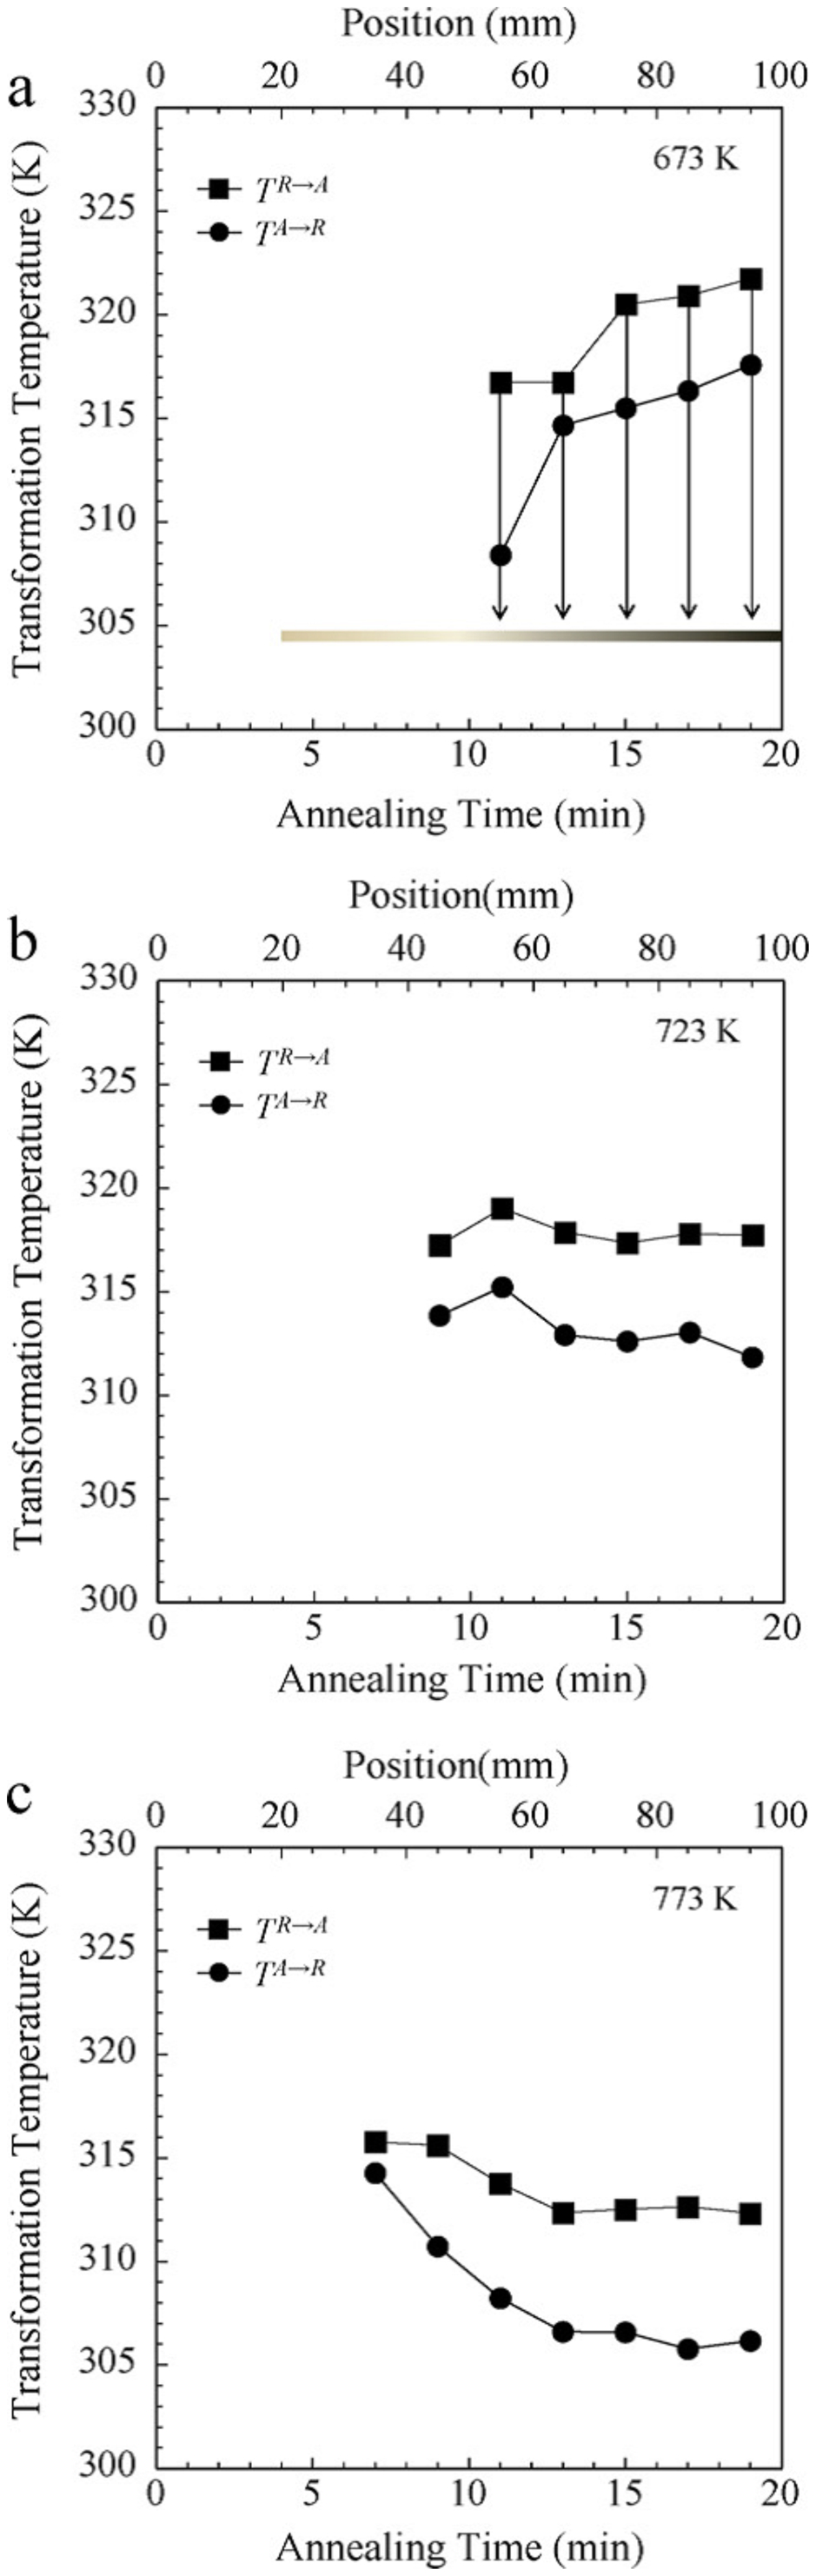
Effect of annealing time on R-phase transformation peak temperature of Ti–50·9 at- Ni alloy annealed at a 673 K (400°C), b 723 K (450°C) and c 773 K (500°C): R-phase transformation peak temperatures are indicated as TR→A and TA→R for reverse and forward transformation respectively; annealing treatment was conducted using time gradient annealing (TGA) method 114
On the other hand, a Ti–49·6 at- Ni alloy was annealed at the temperature range between 265 and 513°C for different times from 10 s to 123 days in the research conducted by Khelfaoui and Guénin. 112 It is found that at the same annealing temperature, the R-phase transformation temperature is insensitive to the annealing time (as shown in Fig. 2 of Ref. 112), indicating that annihilation of dislocations with increasing annealing time can hardly affect the R-phase transformation temperatures in the Ti rich alloys. In the research conducted by Wu et al. 70 a sample, which initially shows the R-phase transformation, was subjected to cold drawing. It is found that with increasing degree of cold drawing from 0 to 15·36, no obvious shift of the R-phase transformation peaks was observed. But the R-phase transformation peaks broaden with increasing cold deformation.
Todoroki and Tamura 35 also pointed out that the change of the R-phase transformation temperatures with respect to annealing temperatures becomes more pronounced with increase in Ni content. Therefore, it seems that the change of dislocation density during post-deformation annealing may have less effect on the R-phase transformation temperature, as compared to the formation of Ni4Ti3 precipitates.
The increase of R-phase transformation temperatures with increasing annealing temperature was also reported in Ni rich alloys when annealing at low temperatures (250–350°C).8,96 This may be due to the presence of Ni4Ti3 precipitates, because apart from the annihilation of dislocations, the precipitation of Ni4Ti3 is frequently reported at this temperature range.46,85,104 With increasing annealing temperature at this temperature range, the volume fraction of Ni4Ti3 increases, resulting in the increase of depletion of Ni in the matrix. Therefore, the R-phase transformation temperature increases with increasing annealing temperatures in this temperature range. Apart from this argument, it is also possible that the annihilation of the very high density of defects and release of the very strong internal stresses, which were introduced by cold deformation, may increase the R-phase transformation temperatures with increasing annealing temperature in this temperature range.
The abnormal two-stage R-phase transformation was also observed in the samples after post-deformation annealing treatment, due to the microstructural inhomogeneity.115,116 Moreover, the formation of NiTi2 precipitates during post-deformation annealing was reported,113,117 which may change the chemical composition of the matrix, leading to the change of R-phase transformation temperatures.
As discussed above, it is clear that more systematic research is needed to elucidate the change in R-phase transformation temperatures as a function of chemical composition, dislocation densities, Ni4Ti3 precipitates (coherency, size, density and volume fraction), grain size, etc.
Control of R-phase transformation by low temperature aging treatment
As discussed above, the R-phase transformation is very promising for practical applications due to its unique properties. In order to fully exploit the applicability of the R-phase transformation, it is essential to largely separate the R-phase and B19′ transformation, as the appearance of R→B19′ transformation significantly undermines the unique properties of R-phase transformation.12,61,118 Moreover, the control of R-phase transformation temperatures is important. Although some researchers reported the evolution of R-phase transformation temperatures with respect to annealing temperature, aging time and temperatures,12,46,119 the observed two- or multistage transformation may limit the practical application of the R-phase transformation. In this part, a method to suppress the B19′ transformation as well as control the R-phase transformation temperatures by low temperature aging treatment is discussed.
In the previous studies, most of the solution treatments were conducted at high temperature (800–1000°C), which gave rise to large grains in the samples before aging treatment. The discussion on effect of grain size on the aging microstructure and subsequent transformation behaviour is scarce. In the work conducted by the present authors, 94 Ti–50·8 at-Ni samples with different grain sizes were aged at 250°C for 24 h. As shown in Fig. 10, 94 the samples with large grains (average grain size between 6·6 and 21·7 μm) showed two-stage R-phase transformation, while the sample with small grains (average grain size <5·6 μm) showed only one-stage R-phase transformation. Moreover, the B19′ transformation (R→M) temperature gradually decreases with decreasing grain size. Therefore, the aging microstructure can indeed be affected by the grain size, resulting in different transformation behaviour. Figure 11 shows schematically that the different densities of precipitates between grain interior and the vicinity of the grain boundaries is the origin of the two-stage R-phase transformation in the samples with large grains. 94 The volume fraction of grain interior gradually decreases with decreasing grain size, resulting in the change of transformation sequences from two-stage to one-stage R-phase transformation.
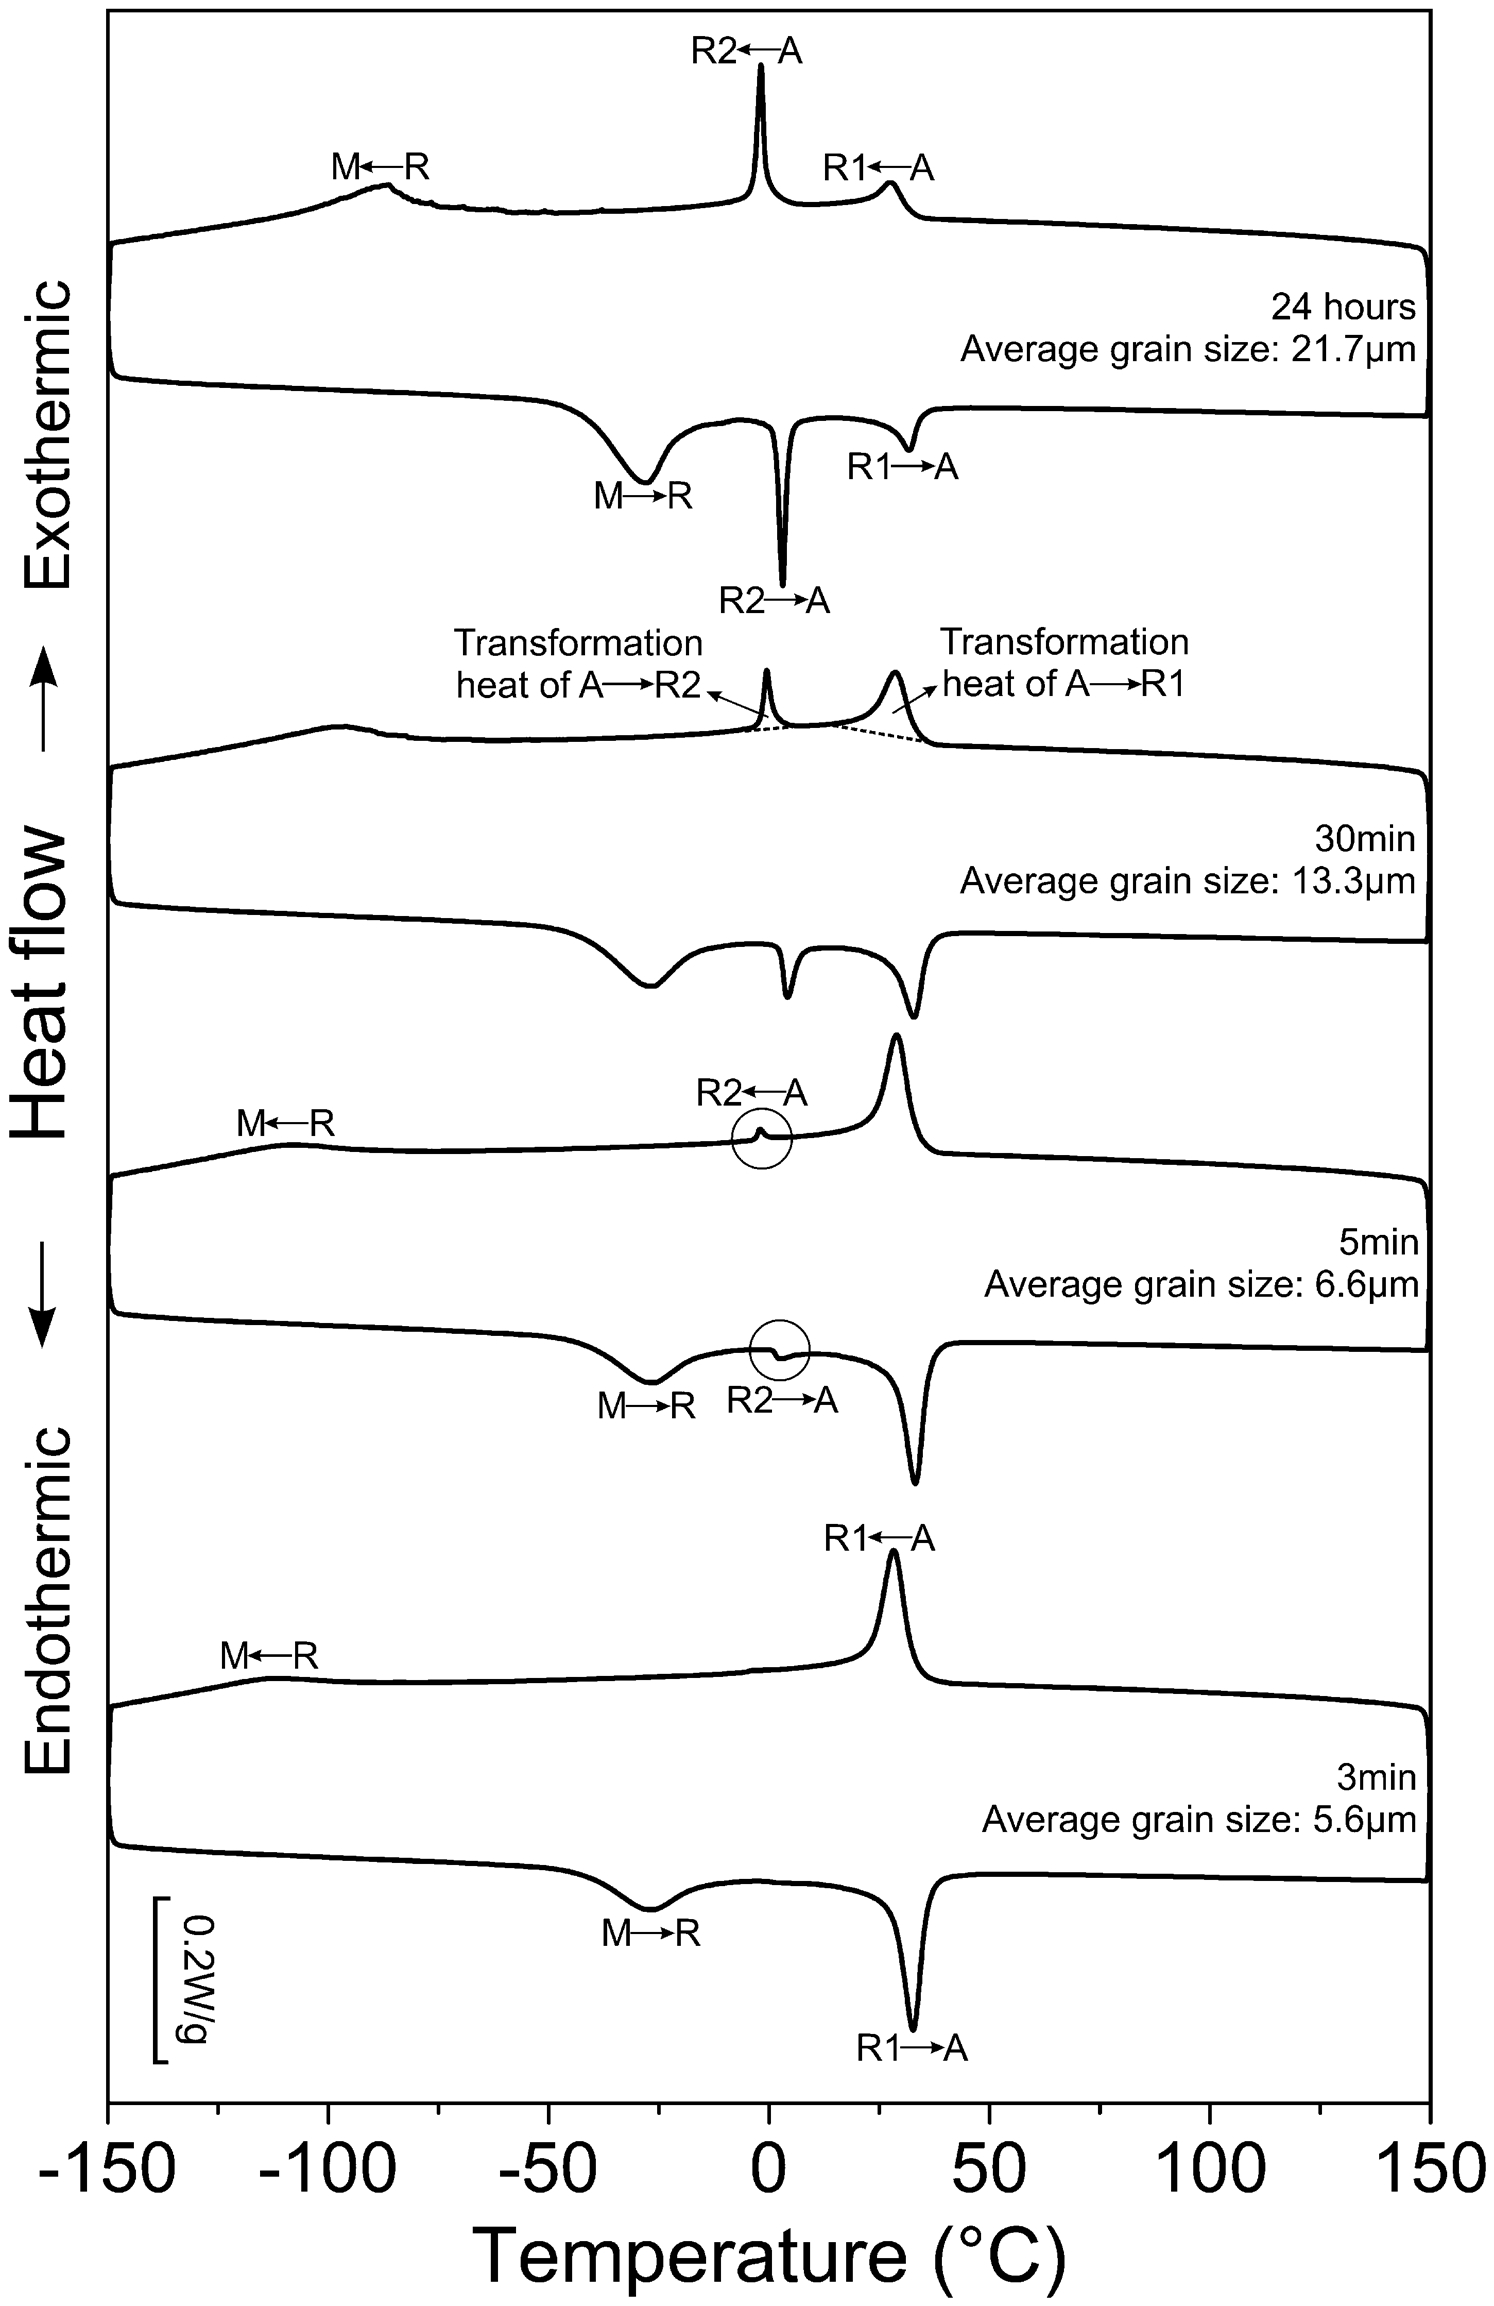
DSC curves of Ti–50·8 at-Ni samples with different grain sizes after aging at 250°C for 24 h: two-stage R-phase transformation is observed and two R-phase transformations are indicated as R1 and R2 respectively 94
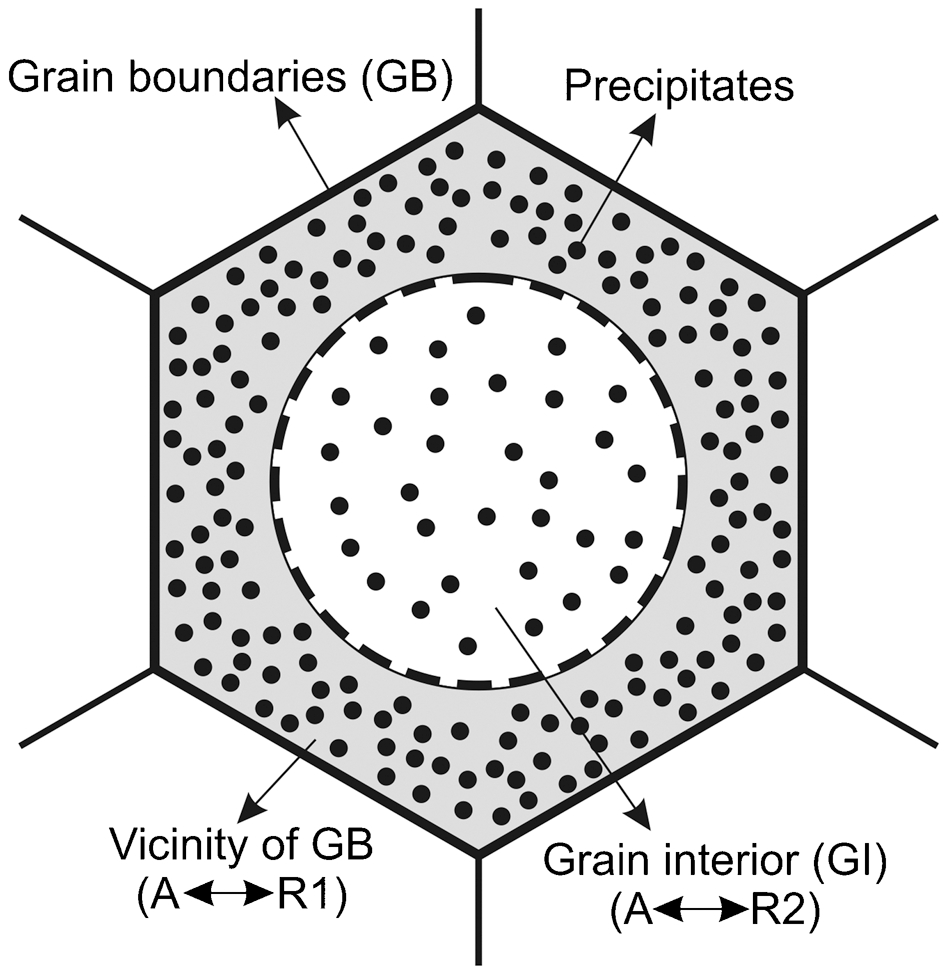
Schematic illustration of origin of two-stage R-phase transformation observed in Ti–50·8 at-Ni alloy after aging at 250°C for 24 h: grain interior has low density of precipitates and vicinity of grain boundaries has high density of precipitates; two R-phase transformations are indicated as R1 and R2 respectively 94
Inspired by the above findings, a Ti–50·8 at- Ni thin wire with an average grain size of 1·7 μm was produced by post-deformation annealing at 600°C for 30 min. The samples were then aged at 250°C for different times.
53
Figure 12 shows that the as annealed sample shows a normal B2 B19′ transformation.
53
With increasing aging time to 4 h, the B19′ transformation is completely suppressed, and only B2
B19′ transformation.
53
With increasing aging time to 4 h, the B19′ transformation is completely suppressed, and only B2 R transformation peaks are detected. The Rs temperature increases from 6 to 38°C with increasing aging time from 4 to 500 h. Ni4Ti3 nanoprecipitates were observed by transmission electron microscope after aging treatment. Therefore, by introducing the nanoprecipitates in a sample with small grains, the thermally induced B19′ transformation can be suppressed and the R-phase transformation temperatures can be controlled by the aging time.
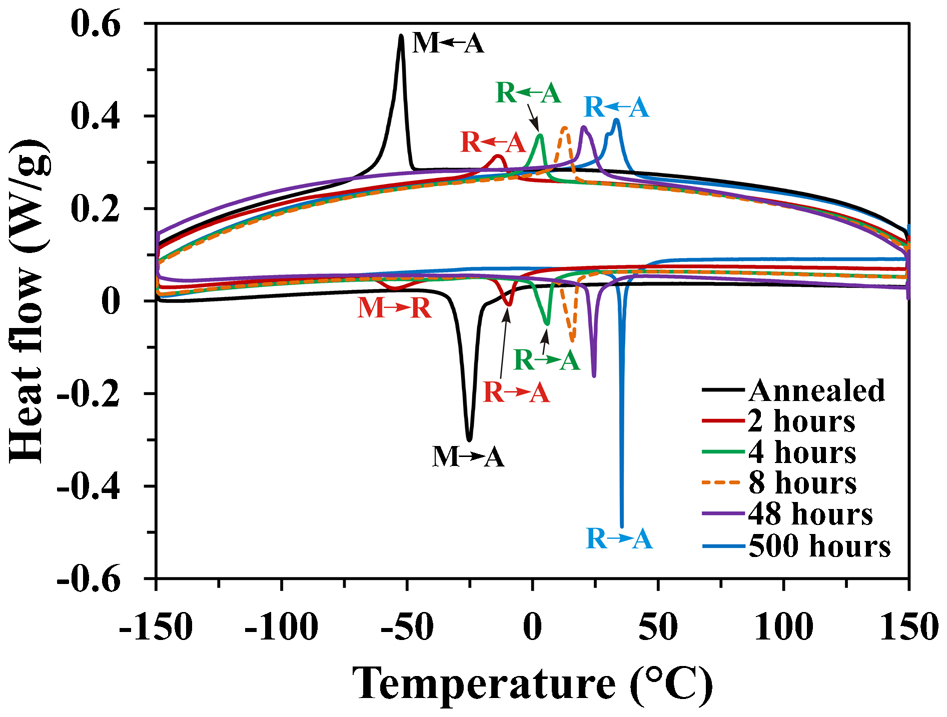
DSC curves of Ti–50·8 at-Ni alloy with average grain size of 1·7 μm after aging at 250°C for different times 53
The work output associated with the observed R-phase transformation was also studied. The work output was measured by thermal cycling under different constant stresses, as shown in Fig. 13a.
53
The sample subjected to a higher constant stress showed a higher work output, while the aging time has little effect on the work output, as shown in Fig. 13b.
53
The R-phase transformation temperature (Rs) under different constant stresses is shown in Fig. 13c.
53
It is found that under the same constant stress, the R-phase transformation temperature increases with increasing aging time, indicating a controllable working temperature of the R-phase transformation under constant stress. The working window, which is defined as the temperature interval between stress induced R-phase and B19′ transformation at a fixed stress, was also determined with a fixed stress of 400 MPa. As shown in Fig. 13c,
53
the working window varies from 57 to 82°C. A large working window enables the sample to work safely in the B2 R state, avoiding the interference of the R→B19′ transformation.
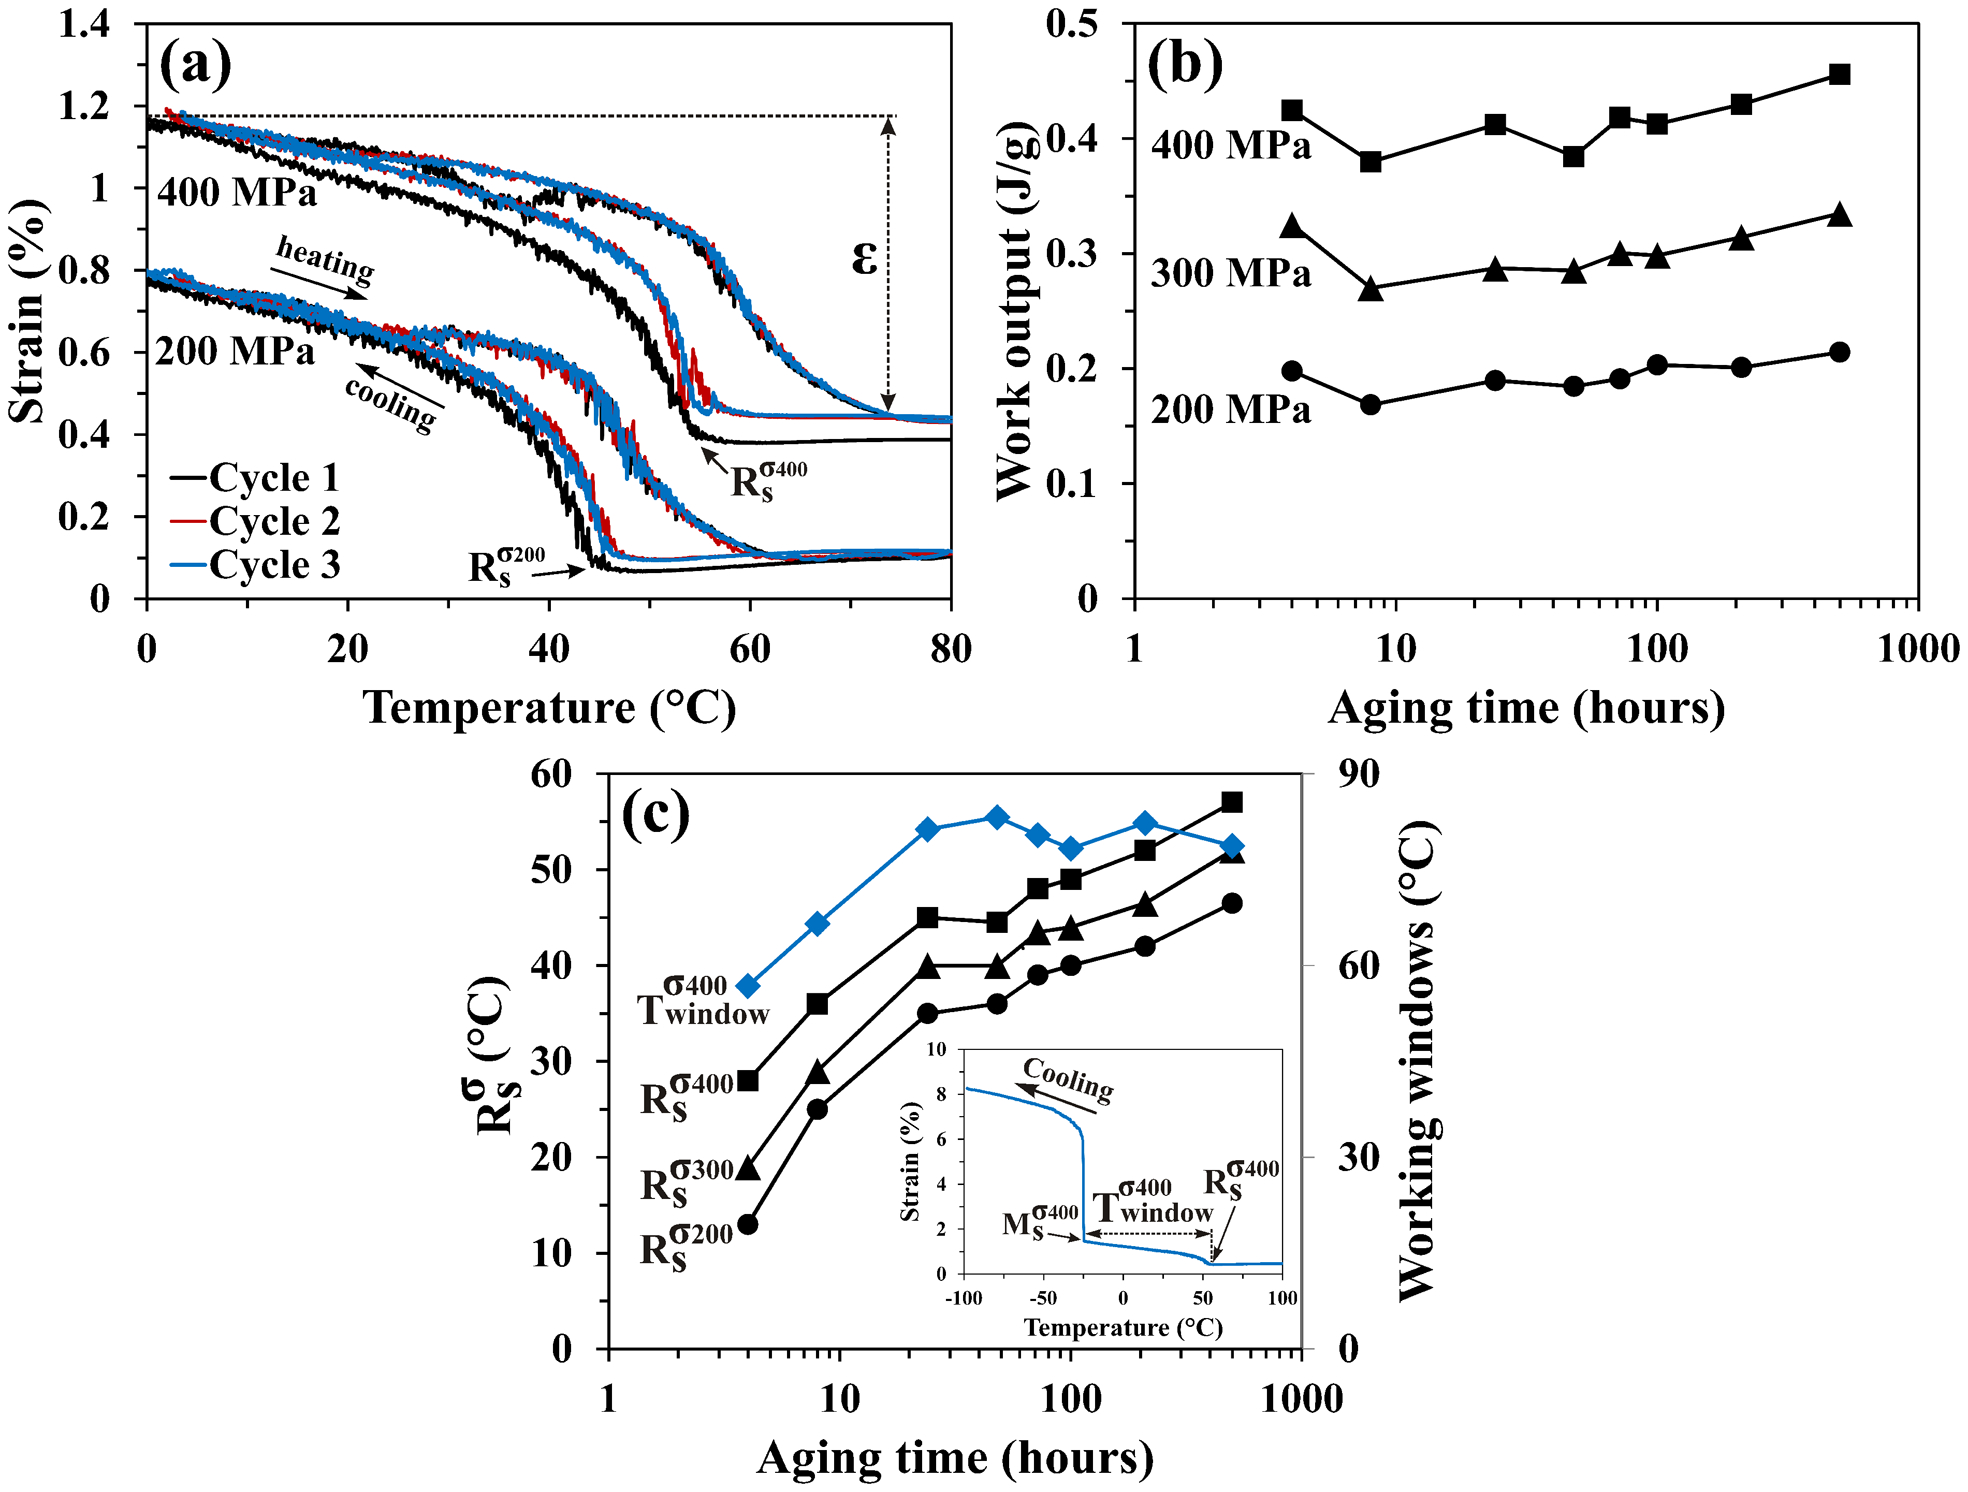
a representative cyclic strain–temperature response under different constant stresses of Ti–50·8 at-Ni alloy with average grain size of 1·7 μm after aging at 250°C for 500 h; b specific work output associated with R-phase transformation under different constant stresses; c R-phase transformation start temperature under different constant stresses and working windows at 400 MPa as function of aging time: insert shows example on determining working windows 53
The recovery stress associated with the R-phase transformation was also evaluated during constrained heating, as shown in Fig. 14a. 53 It is found that the maximum recovery stress gradually increases from 252 to 374 MPa with increasing aging time from 4 to 500 h, as shown in Fig. 14b. 53 The reverse transformation temperatures during constrained heating increase with increasing aging time, indicating that the working temperature range, in which the R-phase transformation can produce a high recovery force, can be controlled by aging time, as shown in Fig. 14c. 53
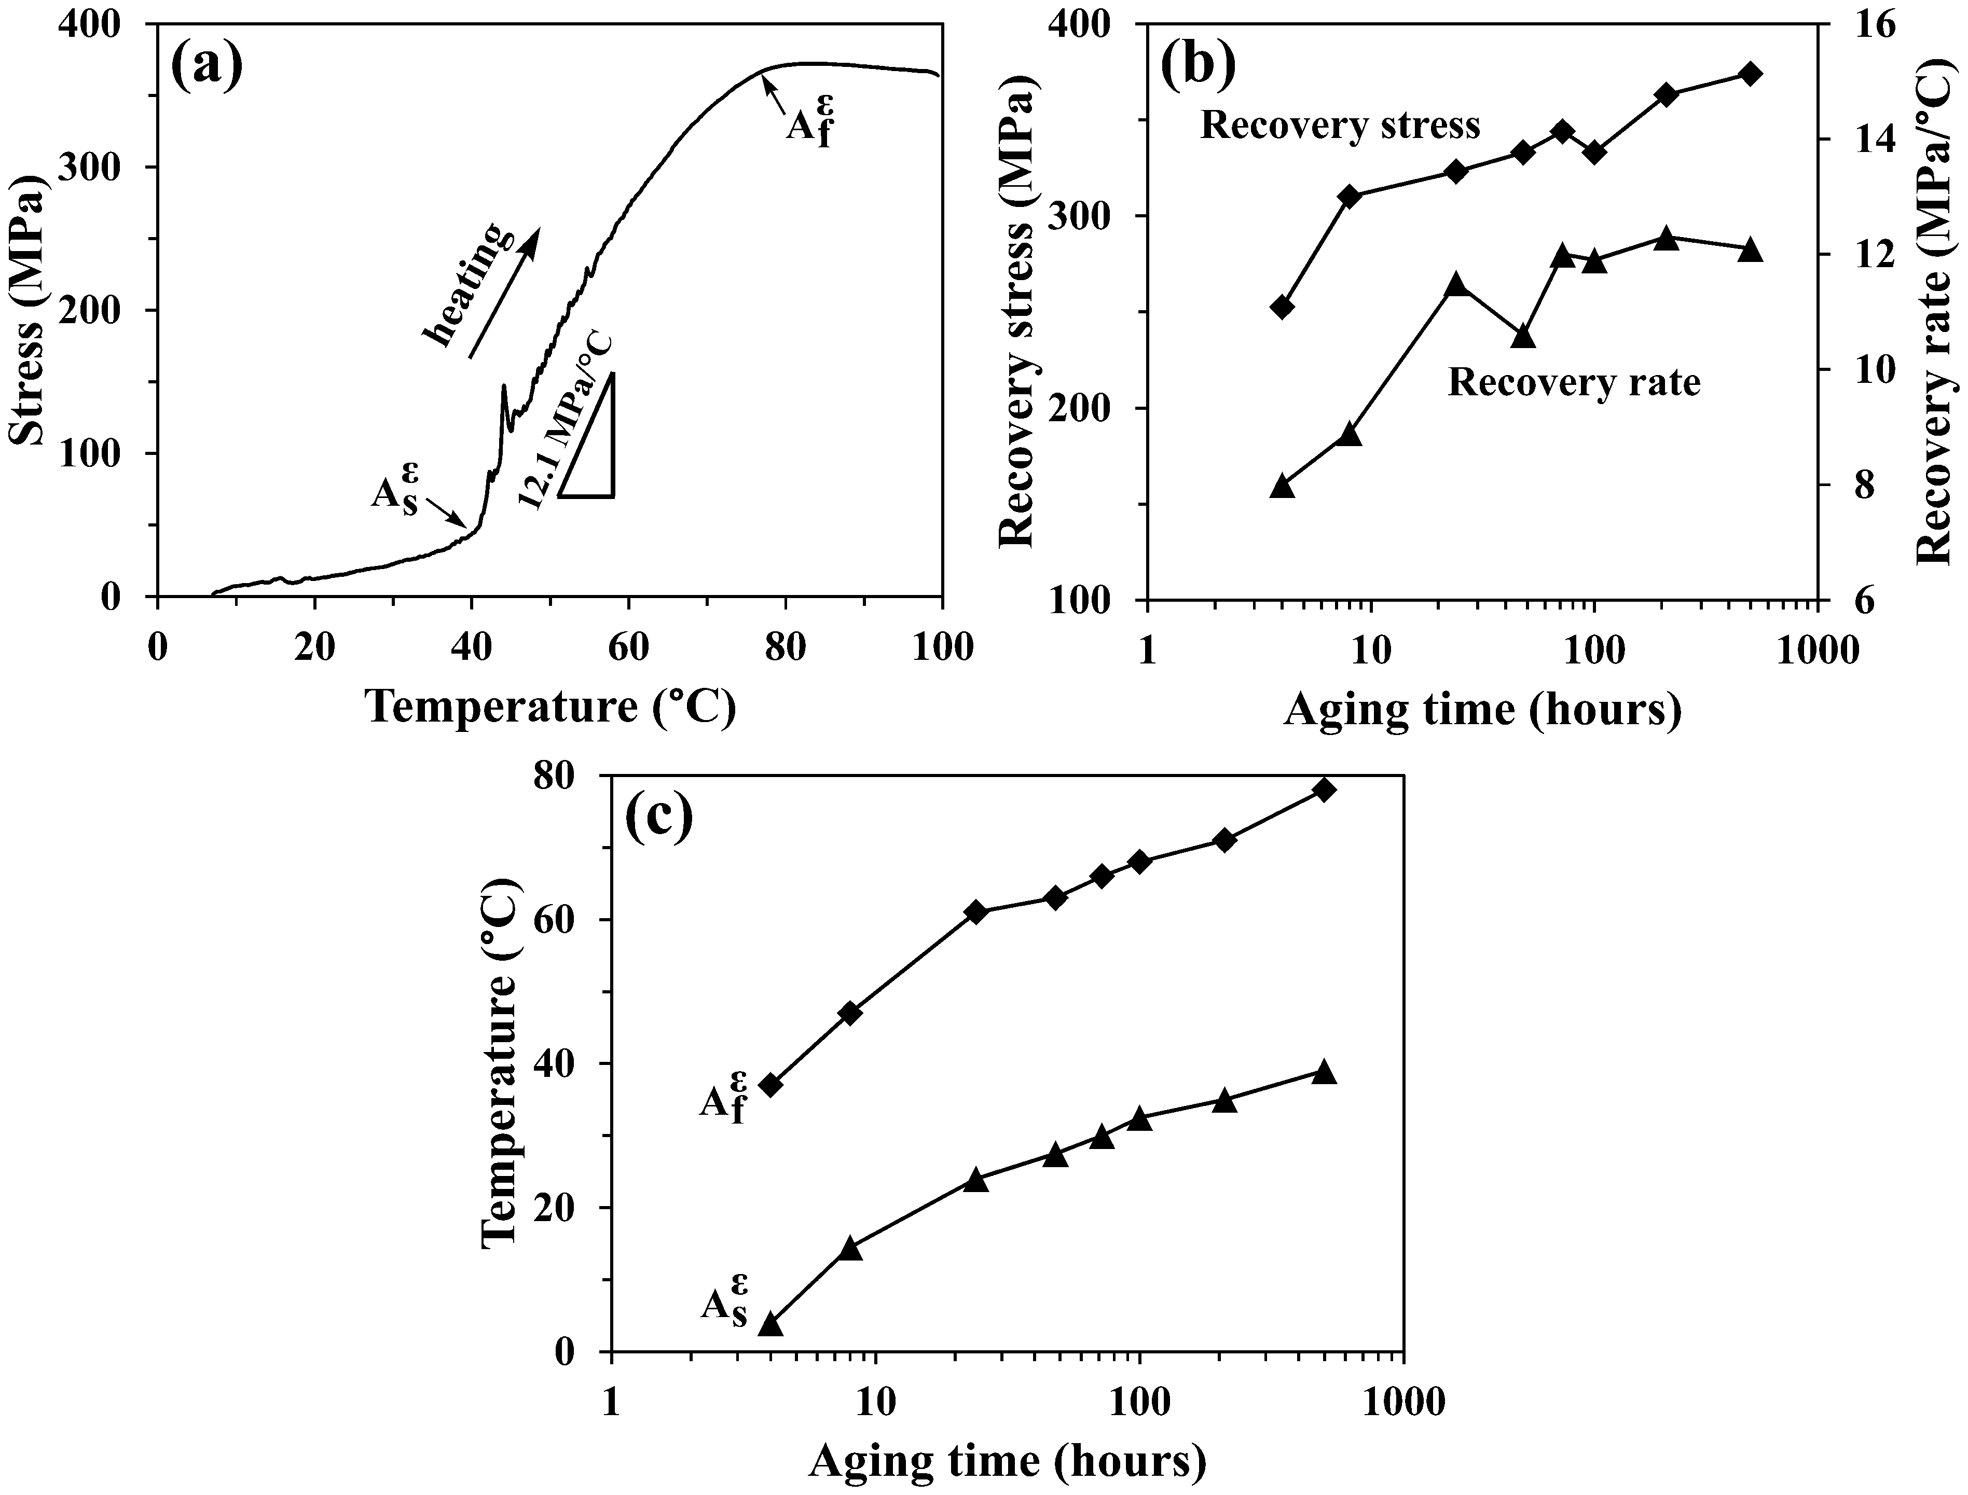
a representative constrained cyclic stress–temperature response of Ti–50·8 at-Ni alloy with average grain size of 1·7 μm after aging at 250°C for 500 h; b maximum recovery stress and recovery stress rate as function of aging time; c reverse transformation (R→A) temperatures under constrained condition as function of aging time 53
To summarise, the thermally induced B19′ transformation was suppressed by introducing the nanoscaled Ni4Ti3 precipitates in a Ti–50·8 at-Ni alloy with small grains. The R-phase transformation temperatures both under stresses (0, 200, 300 and 400 MPa) and during constrained thermal cycling can be controlled by aging time. Moreover, a high work output and a recovery stress associated with the B2 R transformation have been observed. The above behaviour yields interesting properties for the future applications of the R-phase transformation.
Conclusion
In this article, various aspects related to the R-phase transformation in binary NiTi alloys were reviewed. The R-phase transformation can be induced by different thermomechanical treatments, such as aging, thermal cycling and post-deformation annealing treatments. The response of the R-phase transformation to different thermomechanical treatments is summarised as follows:
The R-phase transformation temperatures are rather stable during thermal cycling with a low maximum cycling temperature (e.g. 150°C). With a higher maximum cycling temperature (e.g. 250°C), the Ni4Ti3 precipitates can form in Ni rich alloys. As a result, the R-phase transformation temperature increases with increasing number of thermal cycles.
During aging treatment, the R-phase transformation temperature depends mainly on the Ni concentration of the matrix, which can be modified by the presence of Ni4Ti3 precipitates.
The change of the R-phase transformation temperatures with respect to annealing conditions becomes more pronounced with increasing Ni content. It seems that the formation of Ni4Ti3 precipitates is the main factor affecting the R-phase transformation temperatures during post-deformation annealing treatment.
In order to fully exploit the applicability of the R-phase transformation, it is essential to suppress the B19′ transformation as well as to control the R-phase transformation temperatures. This can be achieved by introducing nanoprecipitates in the samples with small grains. Apart from the discussions in the present work, the other properties of the R-phase are worth studying, such as the fatigue properties, corrosion resistance, electrical behaviour and so on.
Footnotes
Acknowledgements
This work was supported by the Research Foundation Flanders (FWO) under Grant No. G.0576·09N. X. Wang wishes to thank the China Scholarship Council (CSC) for financial support.