
Abstract
The relationship between the filament scale phenomena and the macroscopic properties of parts manufactured by fused deposition modelling (FDM) of thermoplastic polymers has been investigated using planar geometry dog bone samples, representing layer by layer lamina in an additively manufactured part. Finite element simulations of the response of the FDM part(s) at multiple length scales (filament to macro) are compared with full field strain data obtained experimentally for different raster angles and filament gaps. The strain field, strain energy density, and effective Young's modulus are evaluated. Principal strains resulting from the applied axial loading shifted from the inner rasters to the contours of the FDM planar sample at certain raster angles as the air gap increased, which significantly decreased the effective usage of the material leading to strain localization and premature part failure. The research presented provides a pathway to an effective multiscale approach to optimise the raster contour fill pattern.
Keywords
Introduction
Since its invention in the early 1990s, fused deposition modelling (FDM) has become one of the most popular additive manufacturing techniques, involving extrusion of plastic filaments 1 to give layer by layer deposition. Extensive efforts have been devoted to construct the relationship between the process parameters and the mechanical properties of the FDM part. The typical process parameters that determine the geometrical structure of the filaments include raster angle, raster width, air gap, layer thickness and build orientation. A series of build rules was proposed for improved mechanical properties of FDM parts from acrylonitrile butadiene styrene (ABS) P400 material using a design of experiments approach. 2 The concept of locally controlled properties using optimised deposition density and orientation was also proposed for FDM 3 and a laminate theory developed for fibre reinforced composites was implemented for FDM using the analogy of macroscale represented by laminate layers consisting of bonded laminas and the microscale represented by the filament and gaps/voids resulting from the space filling algorithms and interfaces.
The dynamics of bond formation between polymer filaments with thermal analysis and sintering experiments under different conditions have been reported. 4 The cooling conditions play an important role in the bond formation. This work demonstrated that the FDM parts are basically composites of partially bonded parent thermoplastic, with the natural implication that predictive mechanical properties simply based on void fraction and orientation is not sufficient. The same group performed a more in-depth study on the mechanisms that control the bond formation under different process conditions. 5 Creep deformation was found to be a dominant factor in bond formation in addition to small time scale sintering temperature. Using ANSYS FEM program, numerical model to simulate the FDM extrusion process by considering the coupled heat and mass transfer phenomena was performed to identify factors affecting part distortions and layer thickness values.6,7
Although the progress made in establishing an empirical relationship between the process parameters and mechanical properties of the FDM part (i.e. the process–property relationship) has practical significance in improving and optimising the FDM process, a fundamental understanding of the process–property relationship has been elusive. In addition, no direct experimental evidence of spatially resolved deformations has been undertaken to probe the process–property relationship which is inherently heterogeneous for FDM process. This paper focuses on the influence of the filament scale structure on the macroscopic property of the FDM part considering planar geometry, so that the lamina analogy for laminate can be studied carefully first. A simplified elastic finite element (FE) model of a FDM part was considered and the distribution of strain energy in the FDM part under mechanical load was evaluated. FDM dog bone (coupon) samples were made with various raster angles and air gaps with the dimensions identical to those used in FE model. Strain rate controlled tensile tests integrated with 3D-DIC technique was utilised to evaluate displacement and strain fields. The outcomes from numerical (FE) and experimental work were subsequently analysed and compared to investigate the multiscale phenomenon dominant for FDM samples.
FE method
FE model
To investigate the relationship between the filament scale structure and the macroscopic property, the following simplifying assumptions were made:
the extruded filaments have homogeneous and isotropic properties with no defects
the extruded filaments are uniform and have the same constant cross-section profile that is determined by the extrusion parameters
the bonds between filaments are perfect and have the same mechanical properties as the filament
the FDM part is loaded in the elastic regime of the materials and the applied mechanical load did not lead to plastic deformations
the FDM part is assumed to be under plain stress condition.
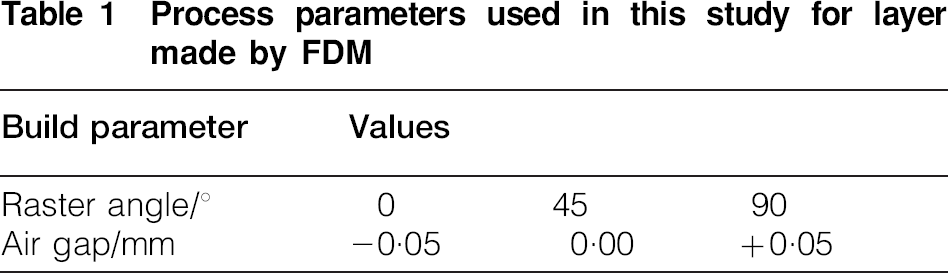
With these assumptions, an FE model using COMSOL was used to simulate the response of the FDM part under tension as illustrated in Figs. 1 and 2. The FDM part is constructed from filaments using a common fill pattern available for the commercial FDM machines (i.e. draw a contour first and fill the contour with various raster patterns) based on the specified process parameters as shown in Fig. 1a. The process parameters that determine the geometry of the filament scale structure included the raster angle, the air gap, the raster width, the layer thickness and the cross-section profile of the extruded filaments. Figure 1b illustrates the model of the FDM part with negative, zero, and positive air gaps. In this study, the cross-section of the filaments used in the FE model, as demonstrated in Fig. 1c, is obtained from the observations of reconstructed images using a high resolution X-ray computed tomography of FDM parts manufactured using a Stratasys Fortus 250mc 3D printer. Therefore, the raster width, the layer thickness and the cross-section profile are kept constant for various samples considered in this study. The raster angle and the air gap are varied as indicated in Table 1 to change the geometry the filament scale structure so that a systematic study to investigate the relationship between the filament scale structure and the macroscopic property of the FDM part can be conducted.
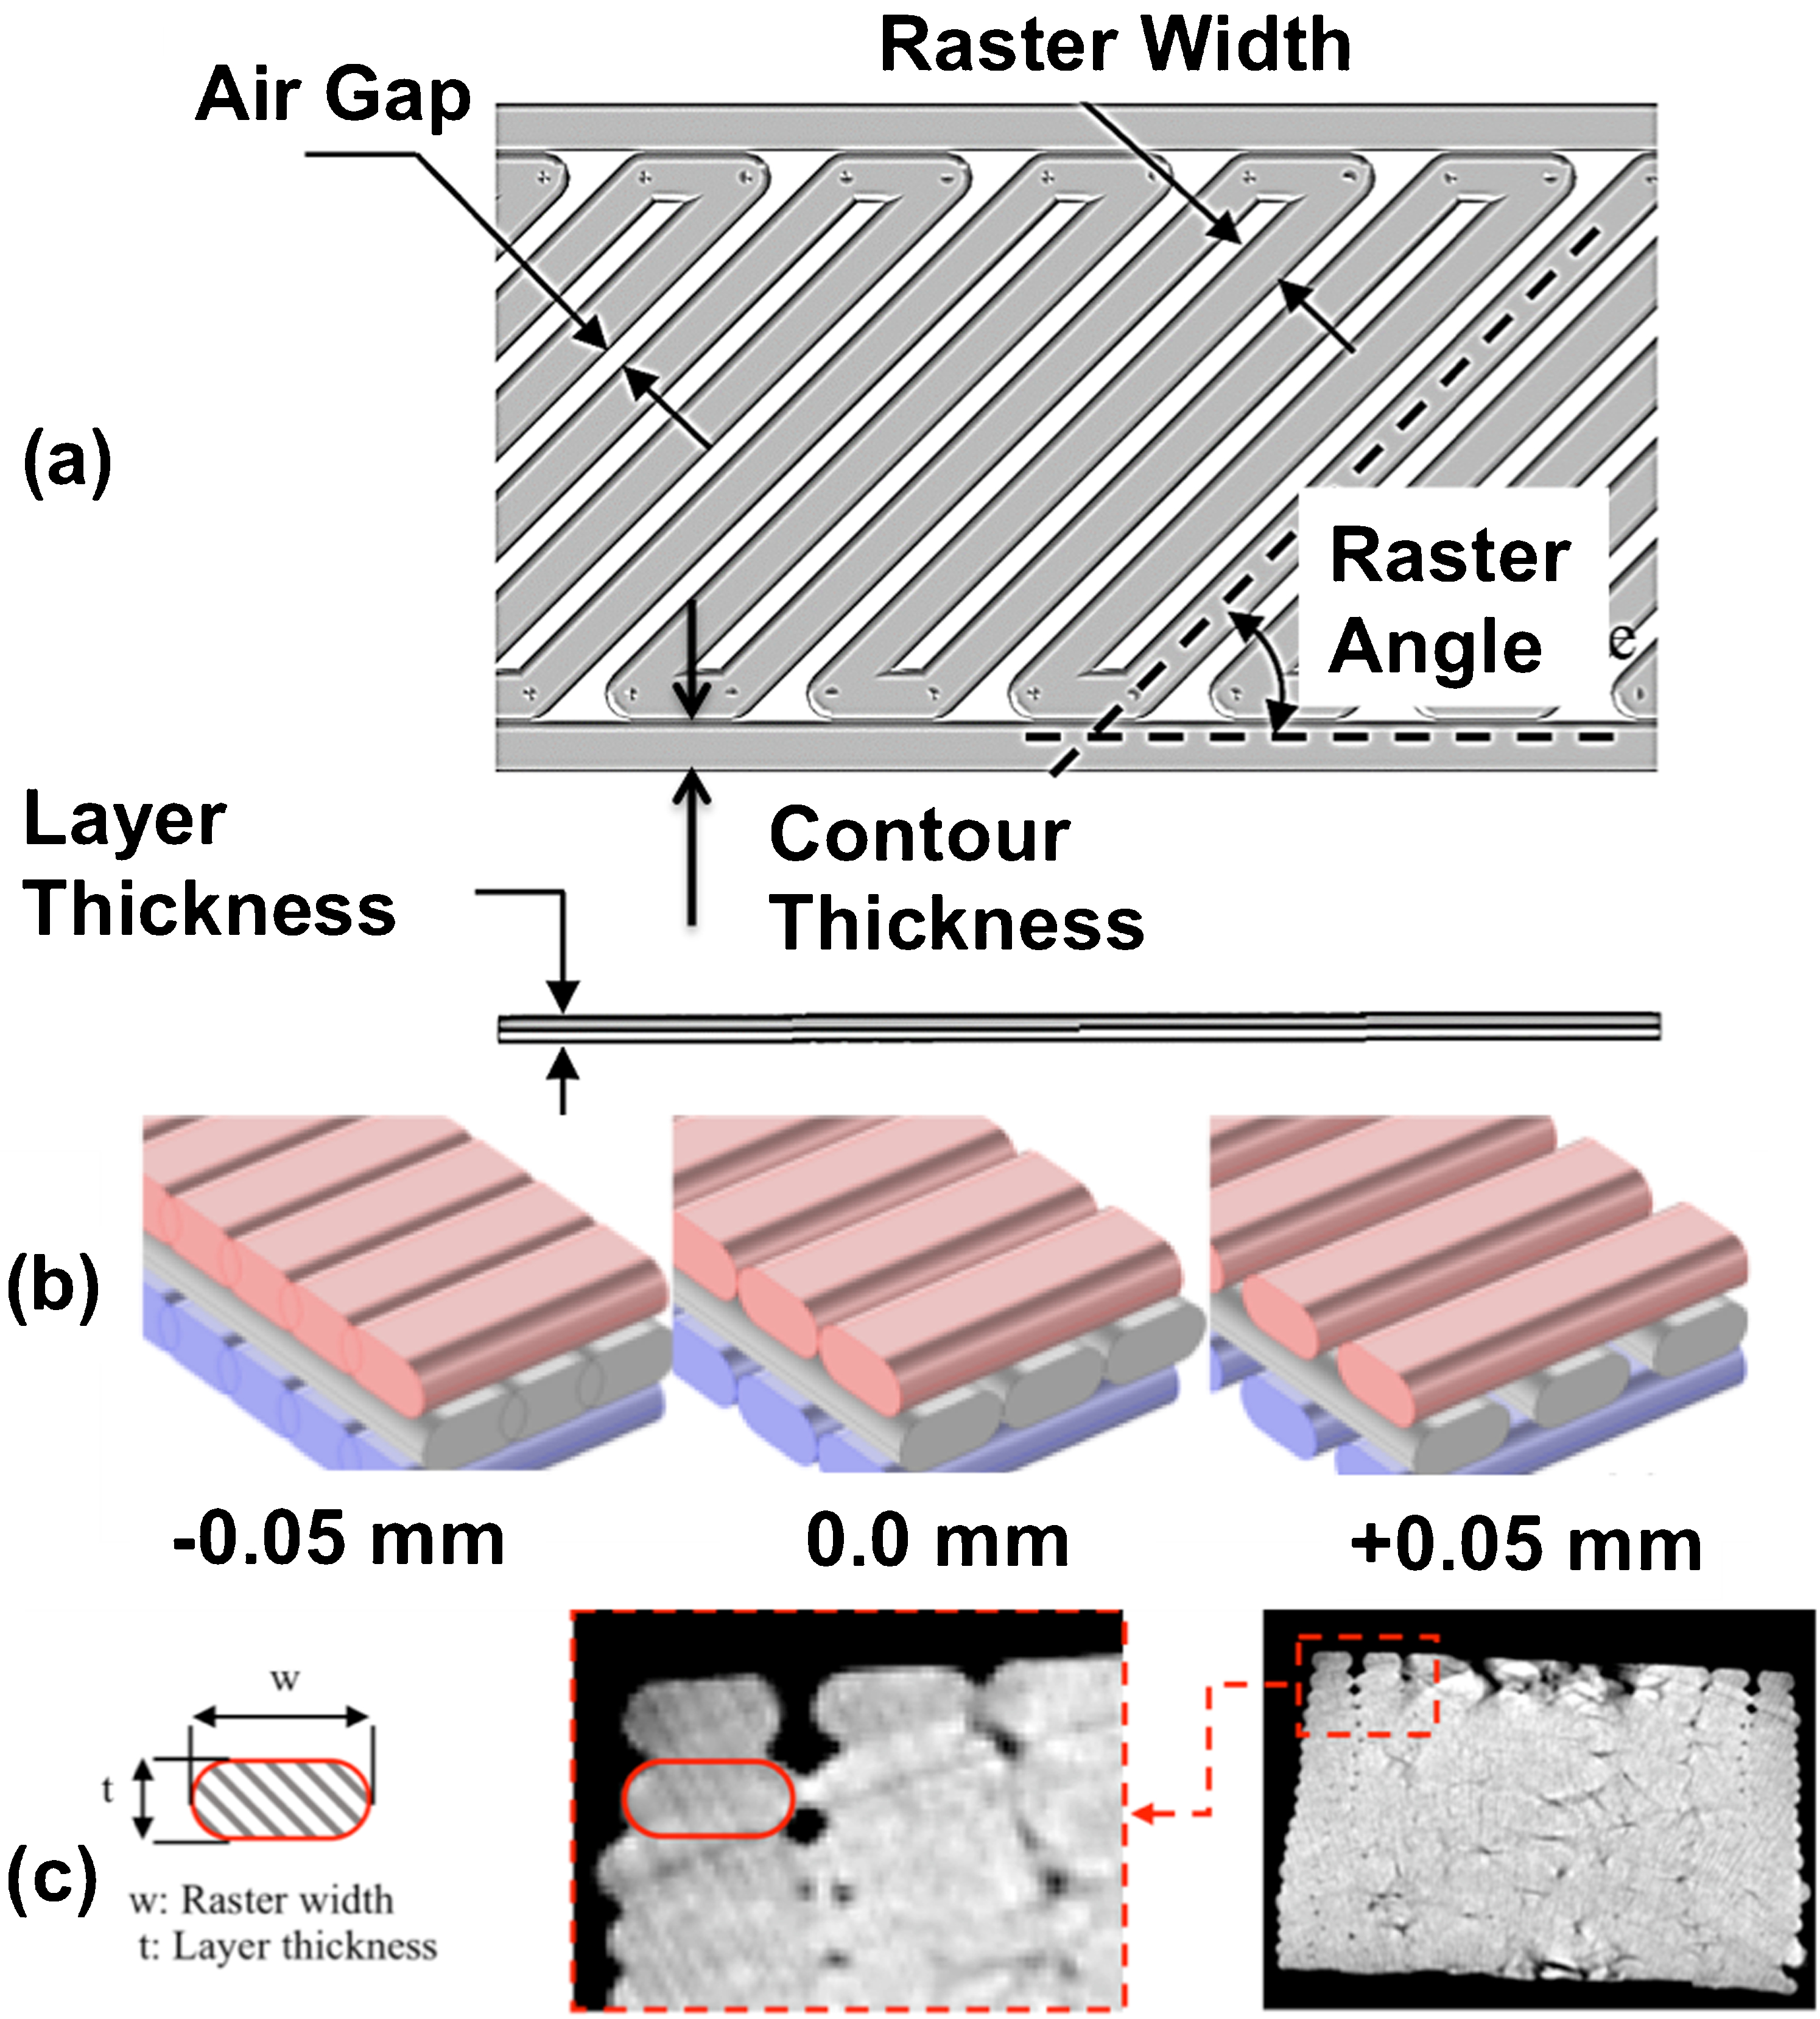
a illustration of FDM process parameters in FEA model; b 3D illustration of filament scale structure with negative, zero and positive air gaps respectively; c example cross-section of extruded filament obtained from computed tomography scanning image of dissected FDM part

Illustration of boundary conditions: geometric constraints on left end with uniformed distributed load on right end
Process parameters used in this study for layer made by FDM
Boundary conditions and meshing
The boundary conditions are set up to simulate the FDM part under tension with uniform geometrical constraints (i.e. a roller constraint) on one end in the axial direction and a uniformly distributed load on the other as illustrated in Fig. 2. Fixed constraints are added in the two corners to prevent the part from rotation or translation to fully constrain the problem. Tests of meshing independence have been conducted by comparing simulation results with three different mesh sizes using the 3D tetrahedral elements.
Materials
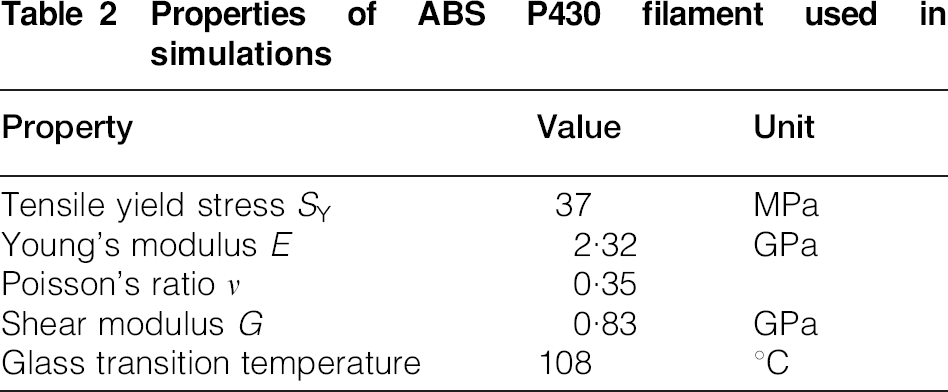
ABS is a thermoplastic polymer which is widely used in FDM process. Mechanical properties for ABS P430 provided by the manufacturer, Stratasys, which is used in this study, are presented in Table 2. It should be noted that although the properties of extruded filaments will differ from those of the original filaments before extrusion, the difference is neglected for this analysis.
Properties of ABS P430 filament used in simulations
Method of analysis
Materials respond to external mechanical load by converting the mechanical work into strain energy under isothermal conditions (i.e. the heat produced by the external work is assumed to be negligible in a tensile test). Therefore, we can examine the strain energy distribution in the materials to measure the local contribution of the materials in sharing the external load, for elastic loading conditions. In the ideal case, the load should be uniformly shared and the strain energy distribution should be homogeneous throughout the FDM part. However, it is expected that for FDM process the irregular geometry of the filament scale structure will change the local behaviour of the materials (i.e. the local strain energy stored in the materials) and lead to non-uniform distribution of the strain energy. Intuitively, the local utility of the materials should have strong influence on the capability of the FDM part in bearing external load, which can be measured by macroscopic properties, such as effective tensile modulus and failure strength. As a result, we can build an intuitive understanding of the multiscale relationship between the local filament scale material behaviour and the global effective property of the FDM part by studying a simple parameter such as the strain energy density for small or elastic deformations of a FDM part before failure. While the intuitive understanding of the multiscale relationship is simple, it is quite difficult to study the filament scale material behaviour due to numerous filament scale geometric features, which play a significant role in changing the local material behaviour. In this paper, two most apparent geometric features, the rasters and the contours, were studied in detail, to correlate the change of a scalar such as strain energy distribution or a spatial strain tensor variation with external tensile loading for a FDM part.
FE results
The response of the FDM part under tension using the developed FE model with different raster angles and air gaps listed in Table 1 was conducted. One indicator that has been often used in the literature and practice is the porosity associated with a printed part to correlate with its mechanical response. The intuitive sense is to minimise the porosity to get better performance (i.e. closer to bulk material property). The porosity of the FDM part for each simulation case is shown in Fig. 3b. The porosity generally increases with larger air gap and there is very little difference between different raster angles, with a slightly larger porosity for the 45° raster angle. The effective Young's modulus in the load direction as a function of air gap is shown in Fig. 3a. As can be seen from these simulations, there is a large divergence between the case of 0° and the cases of 45 and 90°. As the air gap increases, the effective Young's modulus in the case of 0° raster angle has very little decrease and stays close to the Young's modulus of bulk ABS, while there is a significant drop for the cases of 45 and 90°.
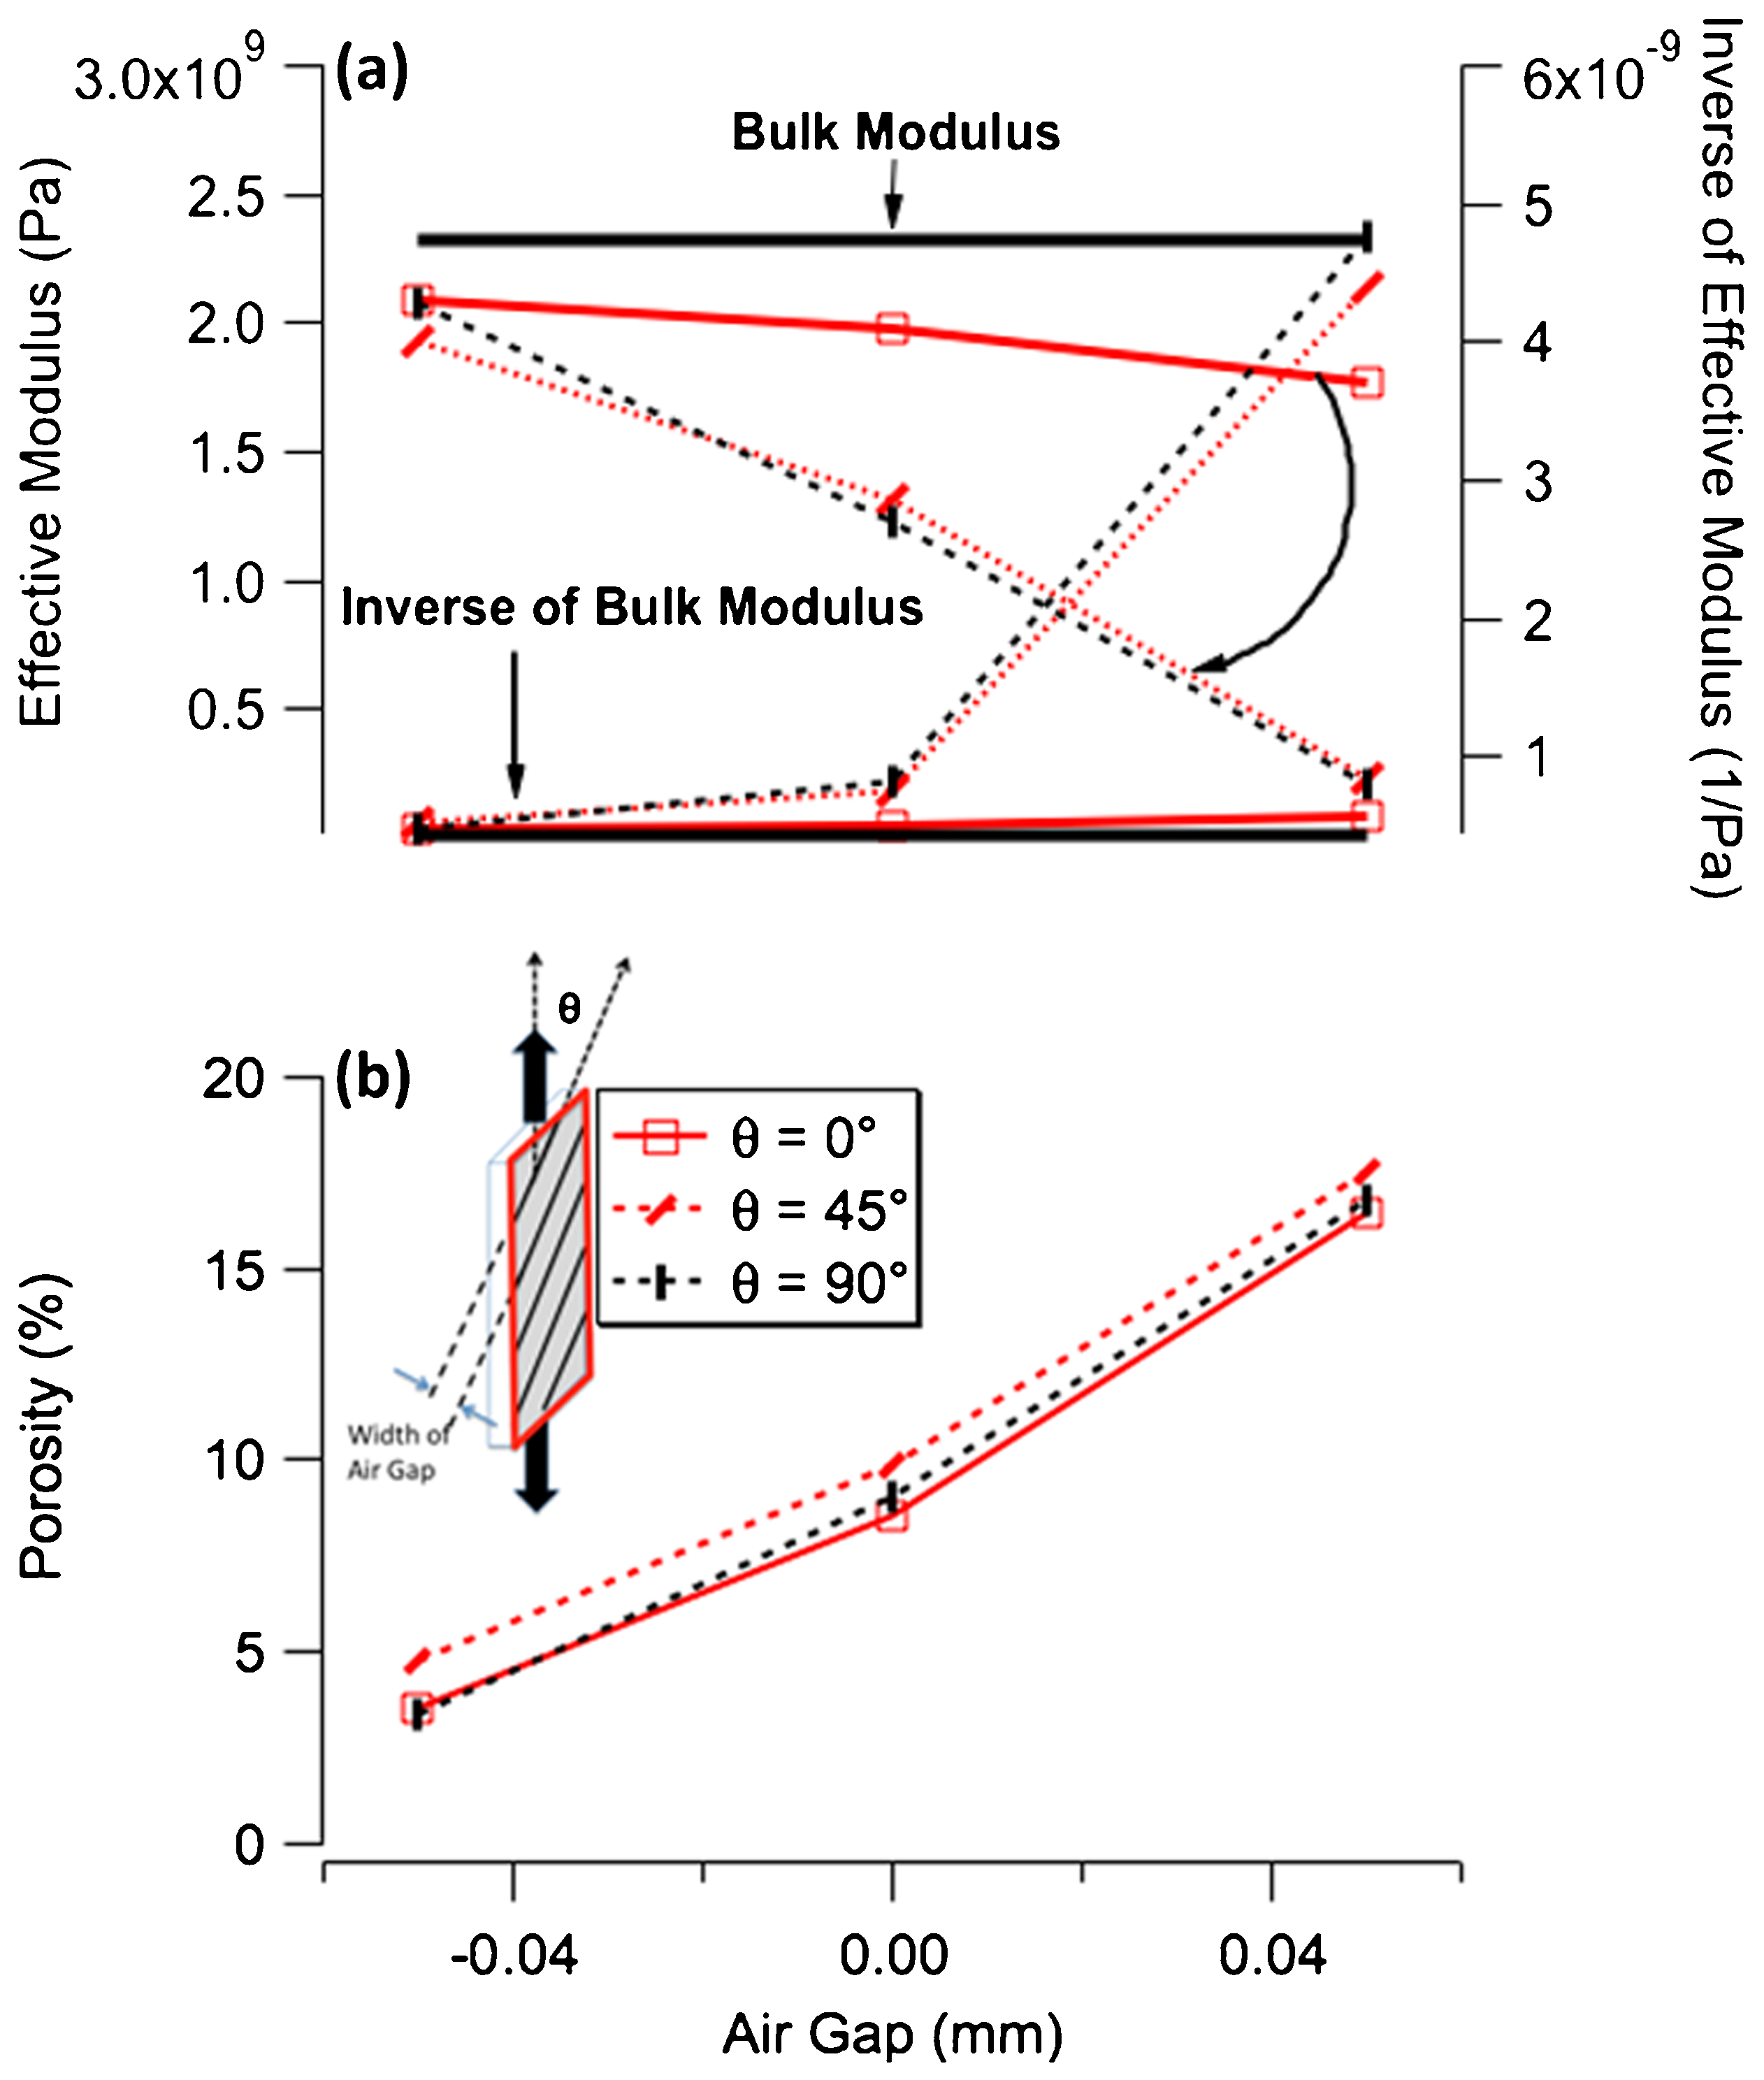
a effective Young's modulus (left) and its inverse (right) as function of air gap with different raster angles: from FE solution, and b porosity as function of air gap with different raster angles
The results suggest porosity cannot be used in its isolation to predict the performance of a FDM part. Figure 4 shows the strain energy density distribution on the filament scale for each simulation as the air gap increases, the strain energy localises significantly especially for the raster angles of 45 and 90°. If we zoom into the filament scale, we can find the concentration of work done during deformation process mostly is in the region a of the FDM part that includes non-negative air gaps for cases corresponding to raster angles of 45 and 90°. As expected, the strain energy is uniformly distributed for the raster angle of 0° at different air gaps. This filament scale phenomenon explains why porosity cannot be a good indicator of the part performance associated with FDM at a lamina scale.

Strain energy density distribution in FDM part for different raster angles and air gaps
To further understand the observations, the total strain energy stored in the FDM part and the respective share in the rasters and the contour as a function of air gap is shown in Fig. 5. The total strain energy generally increases with larger air gap and there is an apparent jump when the air gap becomes positive for the raster angles of 45 and 90°. The larger total strain energy means the FDM part is deformed more and thus more compliant, which corresponds well to the decrease of the effective Young's modulus as shown in Fig. 3b. The share of the strain energy in the rasters drops from 80 to 20% when the air gap goes from negative to positive for the raster angles of 45 and 90°.
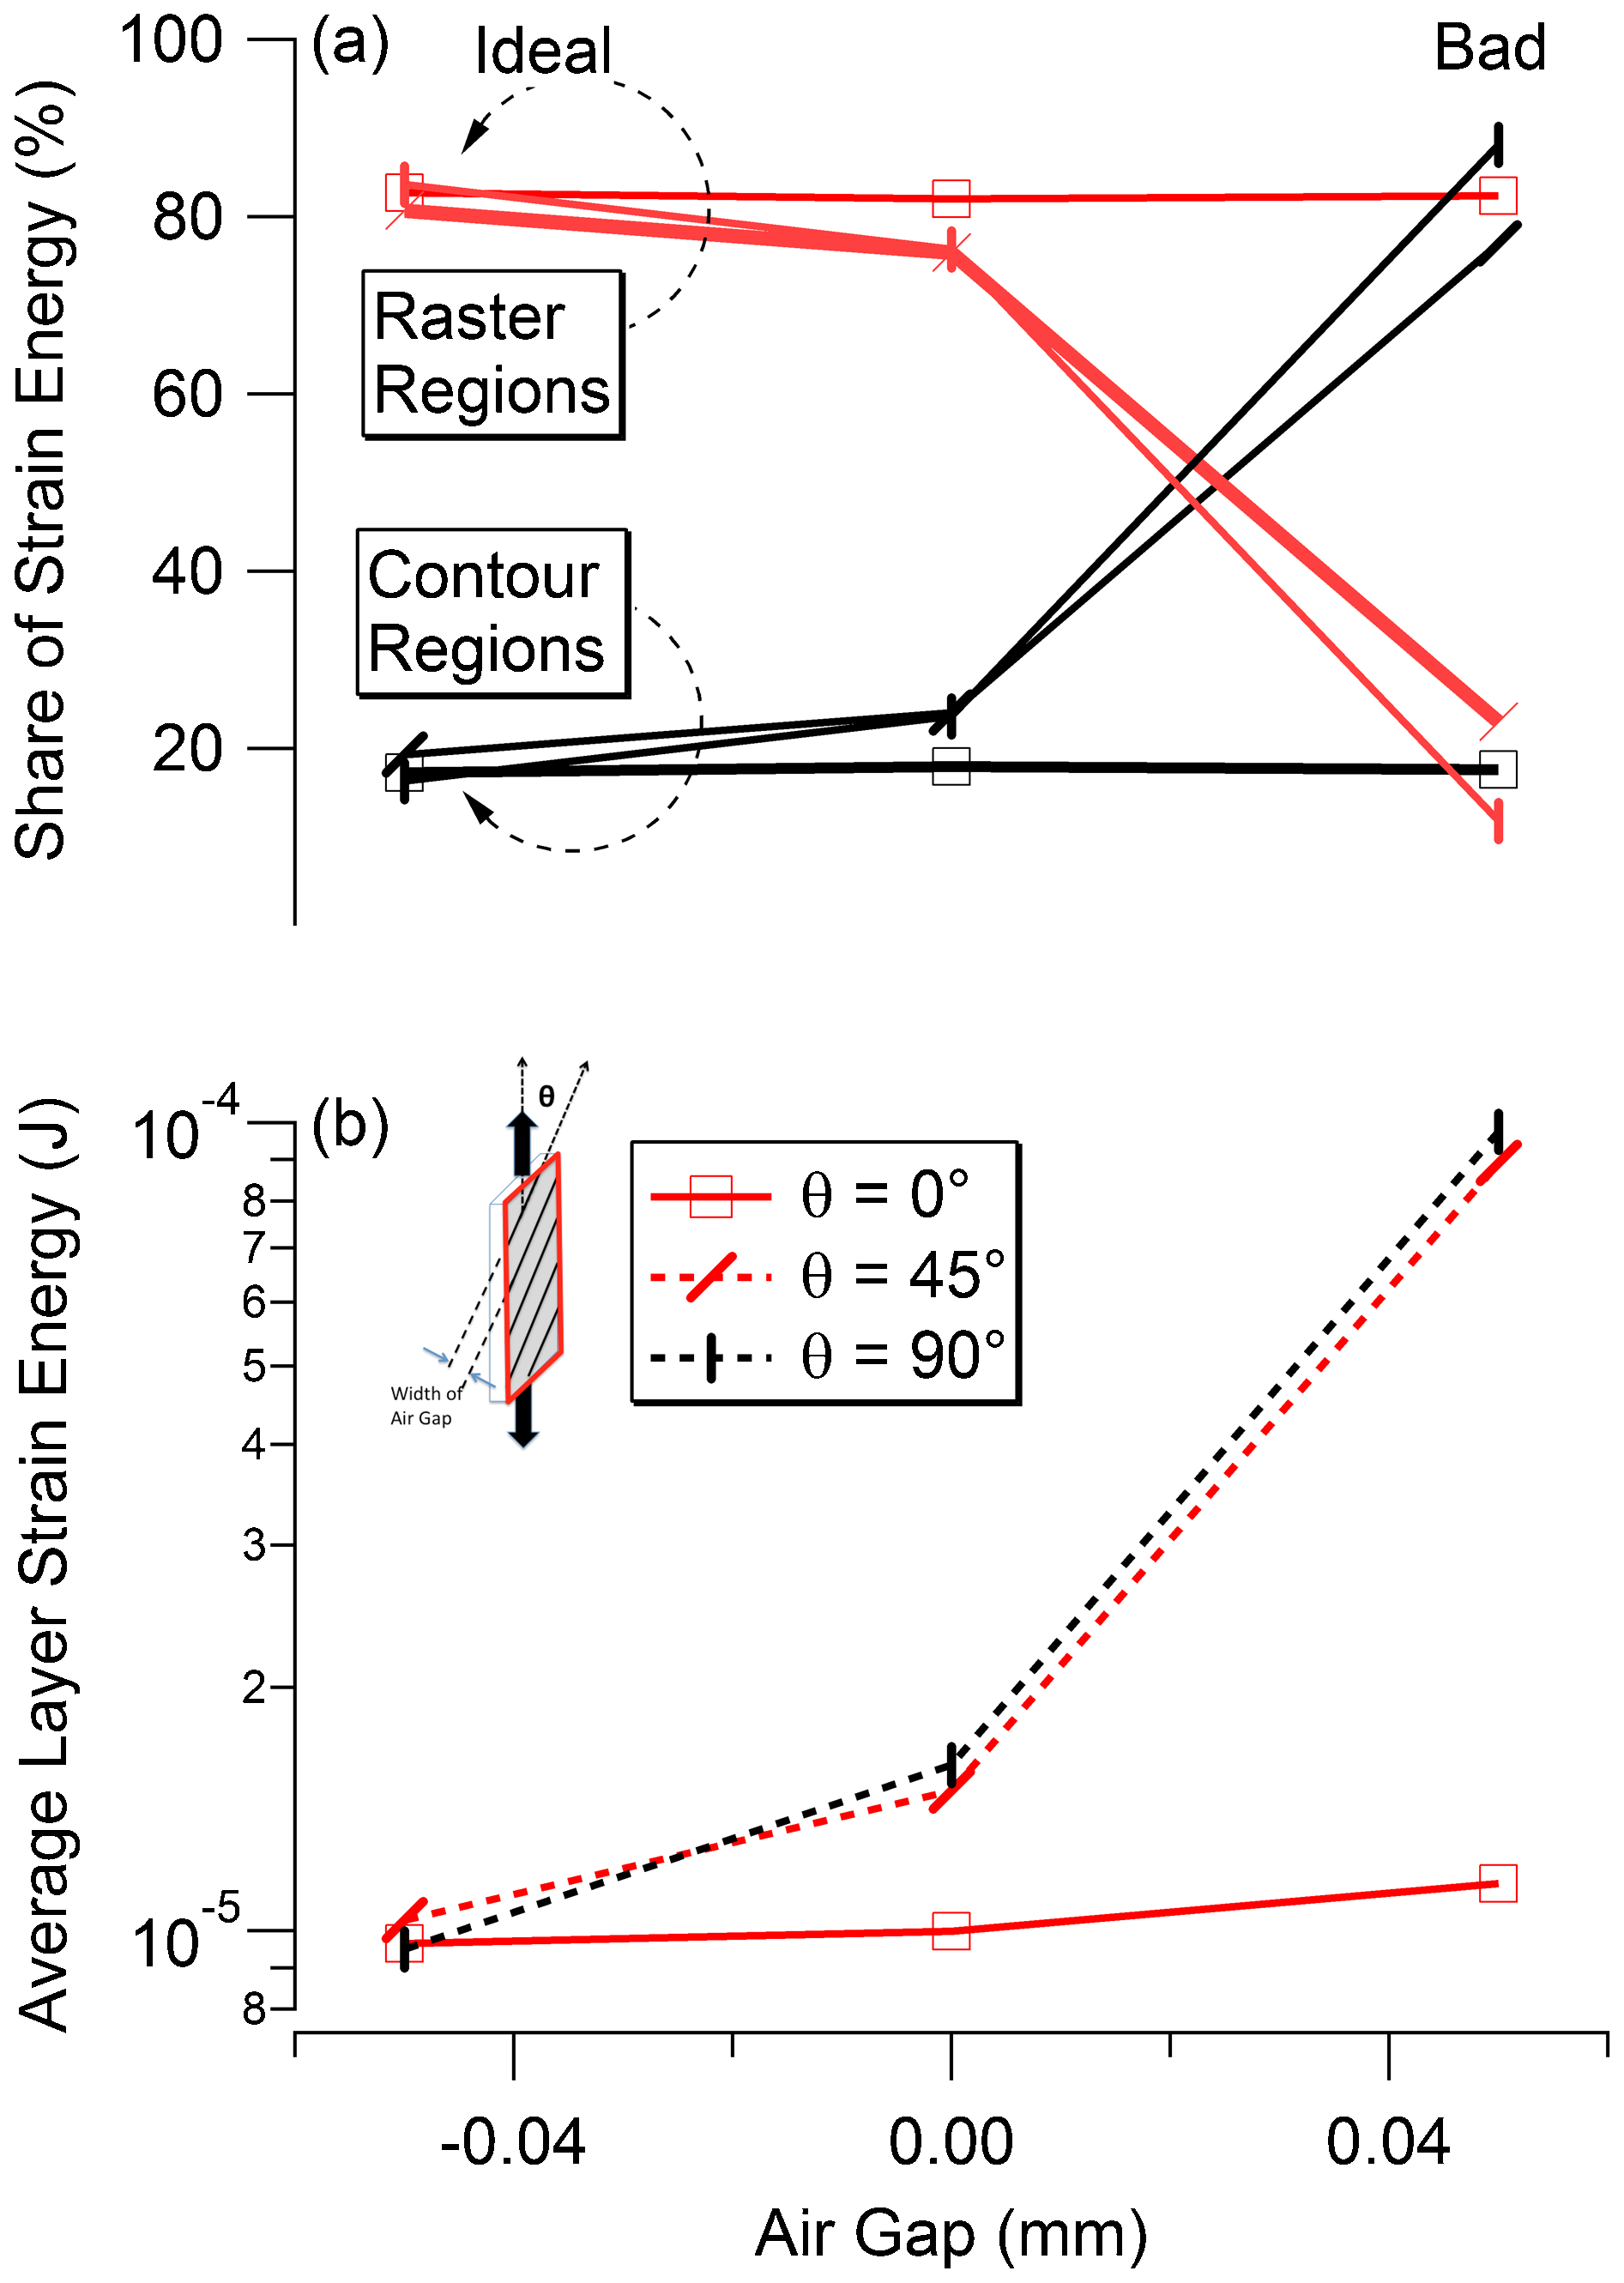
a share of strain energy stored in rasters and contours respectively; b total strain energy stored in FDM part as function of air gap
Considering the volume of the materials contributing to the portion used in the rasters and the contours to be around 80 and 20% respectively, it can be seen that the utility of the materials in the rasters is nearly negligible compared to the load carrying ability of the portion of the material in the contour region for the raster angles of 45 and 90° with positive air gap. The material usage can therefore be optimised for positive gap build settings for FDM process using simulations as introduced in this paper with more realistic constitutive properties for the extruded filament and bond strength. The compliance of the FDM part also shown in Fig. 3b corresponds well to the change of the share of strain energy in the contours indicated in Fig. 5b. This provides direct evidence to support the hypothesis that the load shift phenomenon on the filament scale is the cause of the change of the compliance, affecting the macroscopic mechanical property of the FDM part.
The results from FE models presenting the variation of strain energy density distribution over the considered domains are plotted in Fig. 6. Increasing the raster angle increases the regions of the part with higher amount of strain energy density. Moreover, the number of points having higher amounts of strain energy density for layers made with positive air gap is higher than those for zero and negative air gap. Since the points with the higher amounts of strain energy density are more prone to reach the failure energy of the material, these points can be the failure initiating regions.
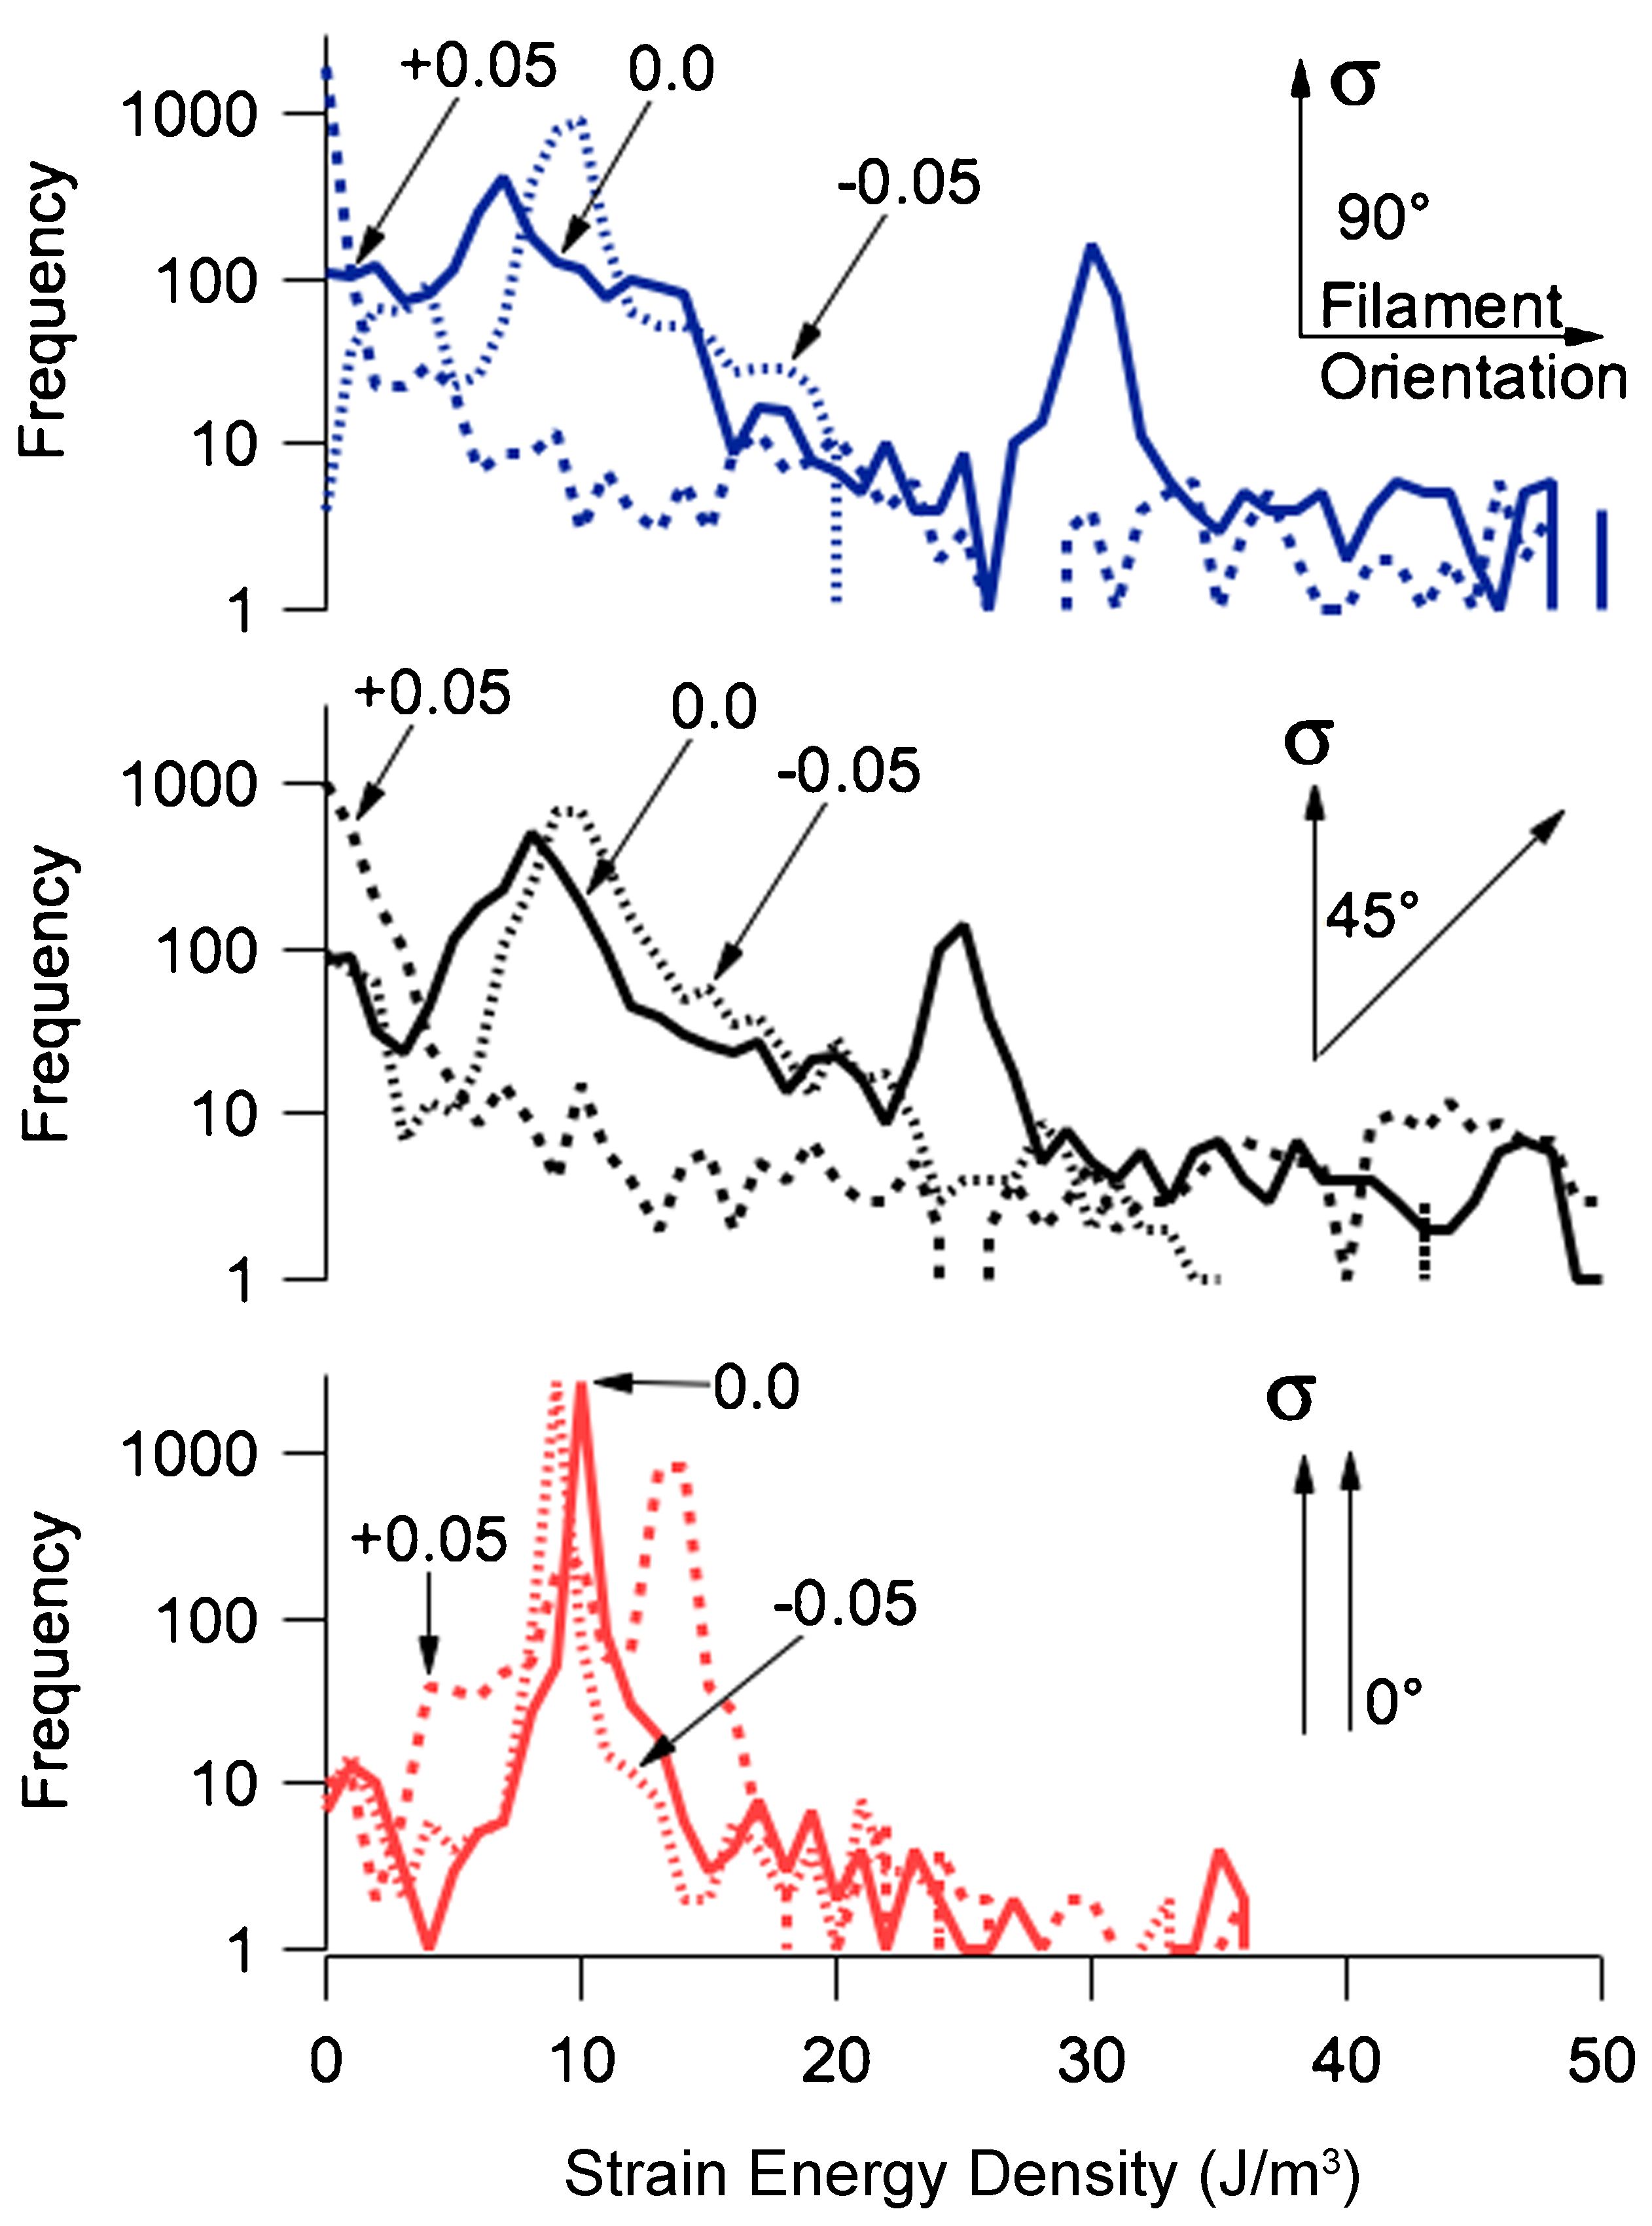
Strain energy density distribution for samples with various raster angles and air gaps
Tensile testing with full field strain mapping of FDM parts
Experiments were conducted to evaluate the mechanical properties including true strain behaviour and spatially resolved strains for the constructed samples geometrically identical to those used in FE models. Tensile tests integrated with three-dimensional digital imaging correlation technique were performed on these samples under carefully controlled conditions and parameters of interest, i.e. strain energy density and effective Young's modulus were obtained.
Design, fabrication and preparation of samples
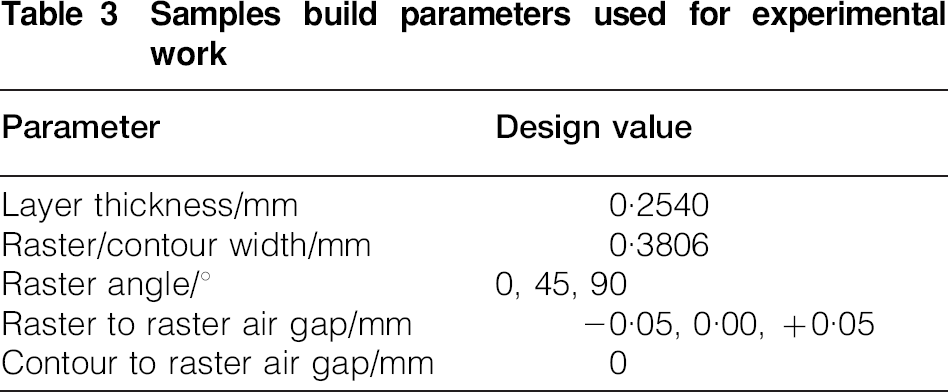
Tensile dog bone single layer planar samples having dimensions specified by ASTM D638, (Type IV) were fabricated using parameters shown in Table 3 by utilising Stratasys Fortus 250mc FDM machine. ABS P430 and SR-30 provided by Stratasys were used for the part and water soluble support material, correspondingly. Stratasys predefined raster and contour deposition strategy with single contour was chosen for all the samples to ensure the geometric similarity with the models used in the FE simulations described earlier. The nozzle temperature and the envelope temperature were set by the manufacturer. The aforementioned support material was later removed from the main structure by submerging samples in the solution bath.
Samples build parameters used for experimental work
Servohydraulic testing and DIC set-up
Final parts made by FDM machine were utilised with a custom developed grip system that ensures alignment in and out of the loading plane and facilitates simultaneous full-field displacements and related strain tensor using 3D Digital Image Correlation technique by tracking a random black speckle pattern on white surface. VIC-3D DIC system from Correlated Solutions was utilised for this set of experiments. The DIC method tracks the grey value patterns using a small subset of pixels to track surface deformations and is an established and proven technique. For current experiments, the size of this tracking region corresponded to a square whose side was 20 pixels or 0·2 mm. Figure 7 demonstrates the experiment set-up used for this study.
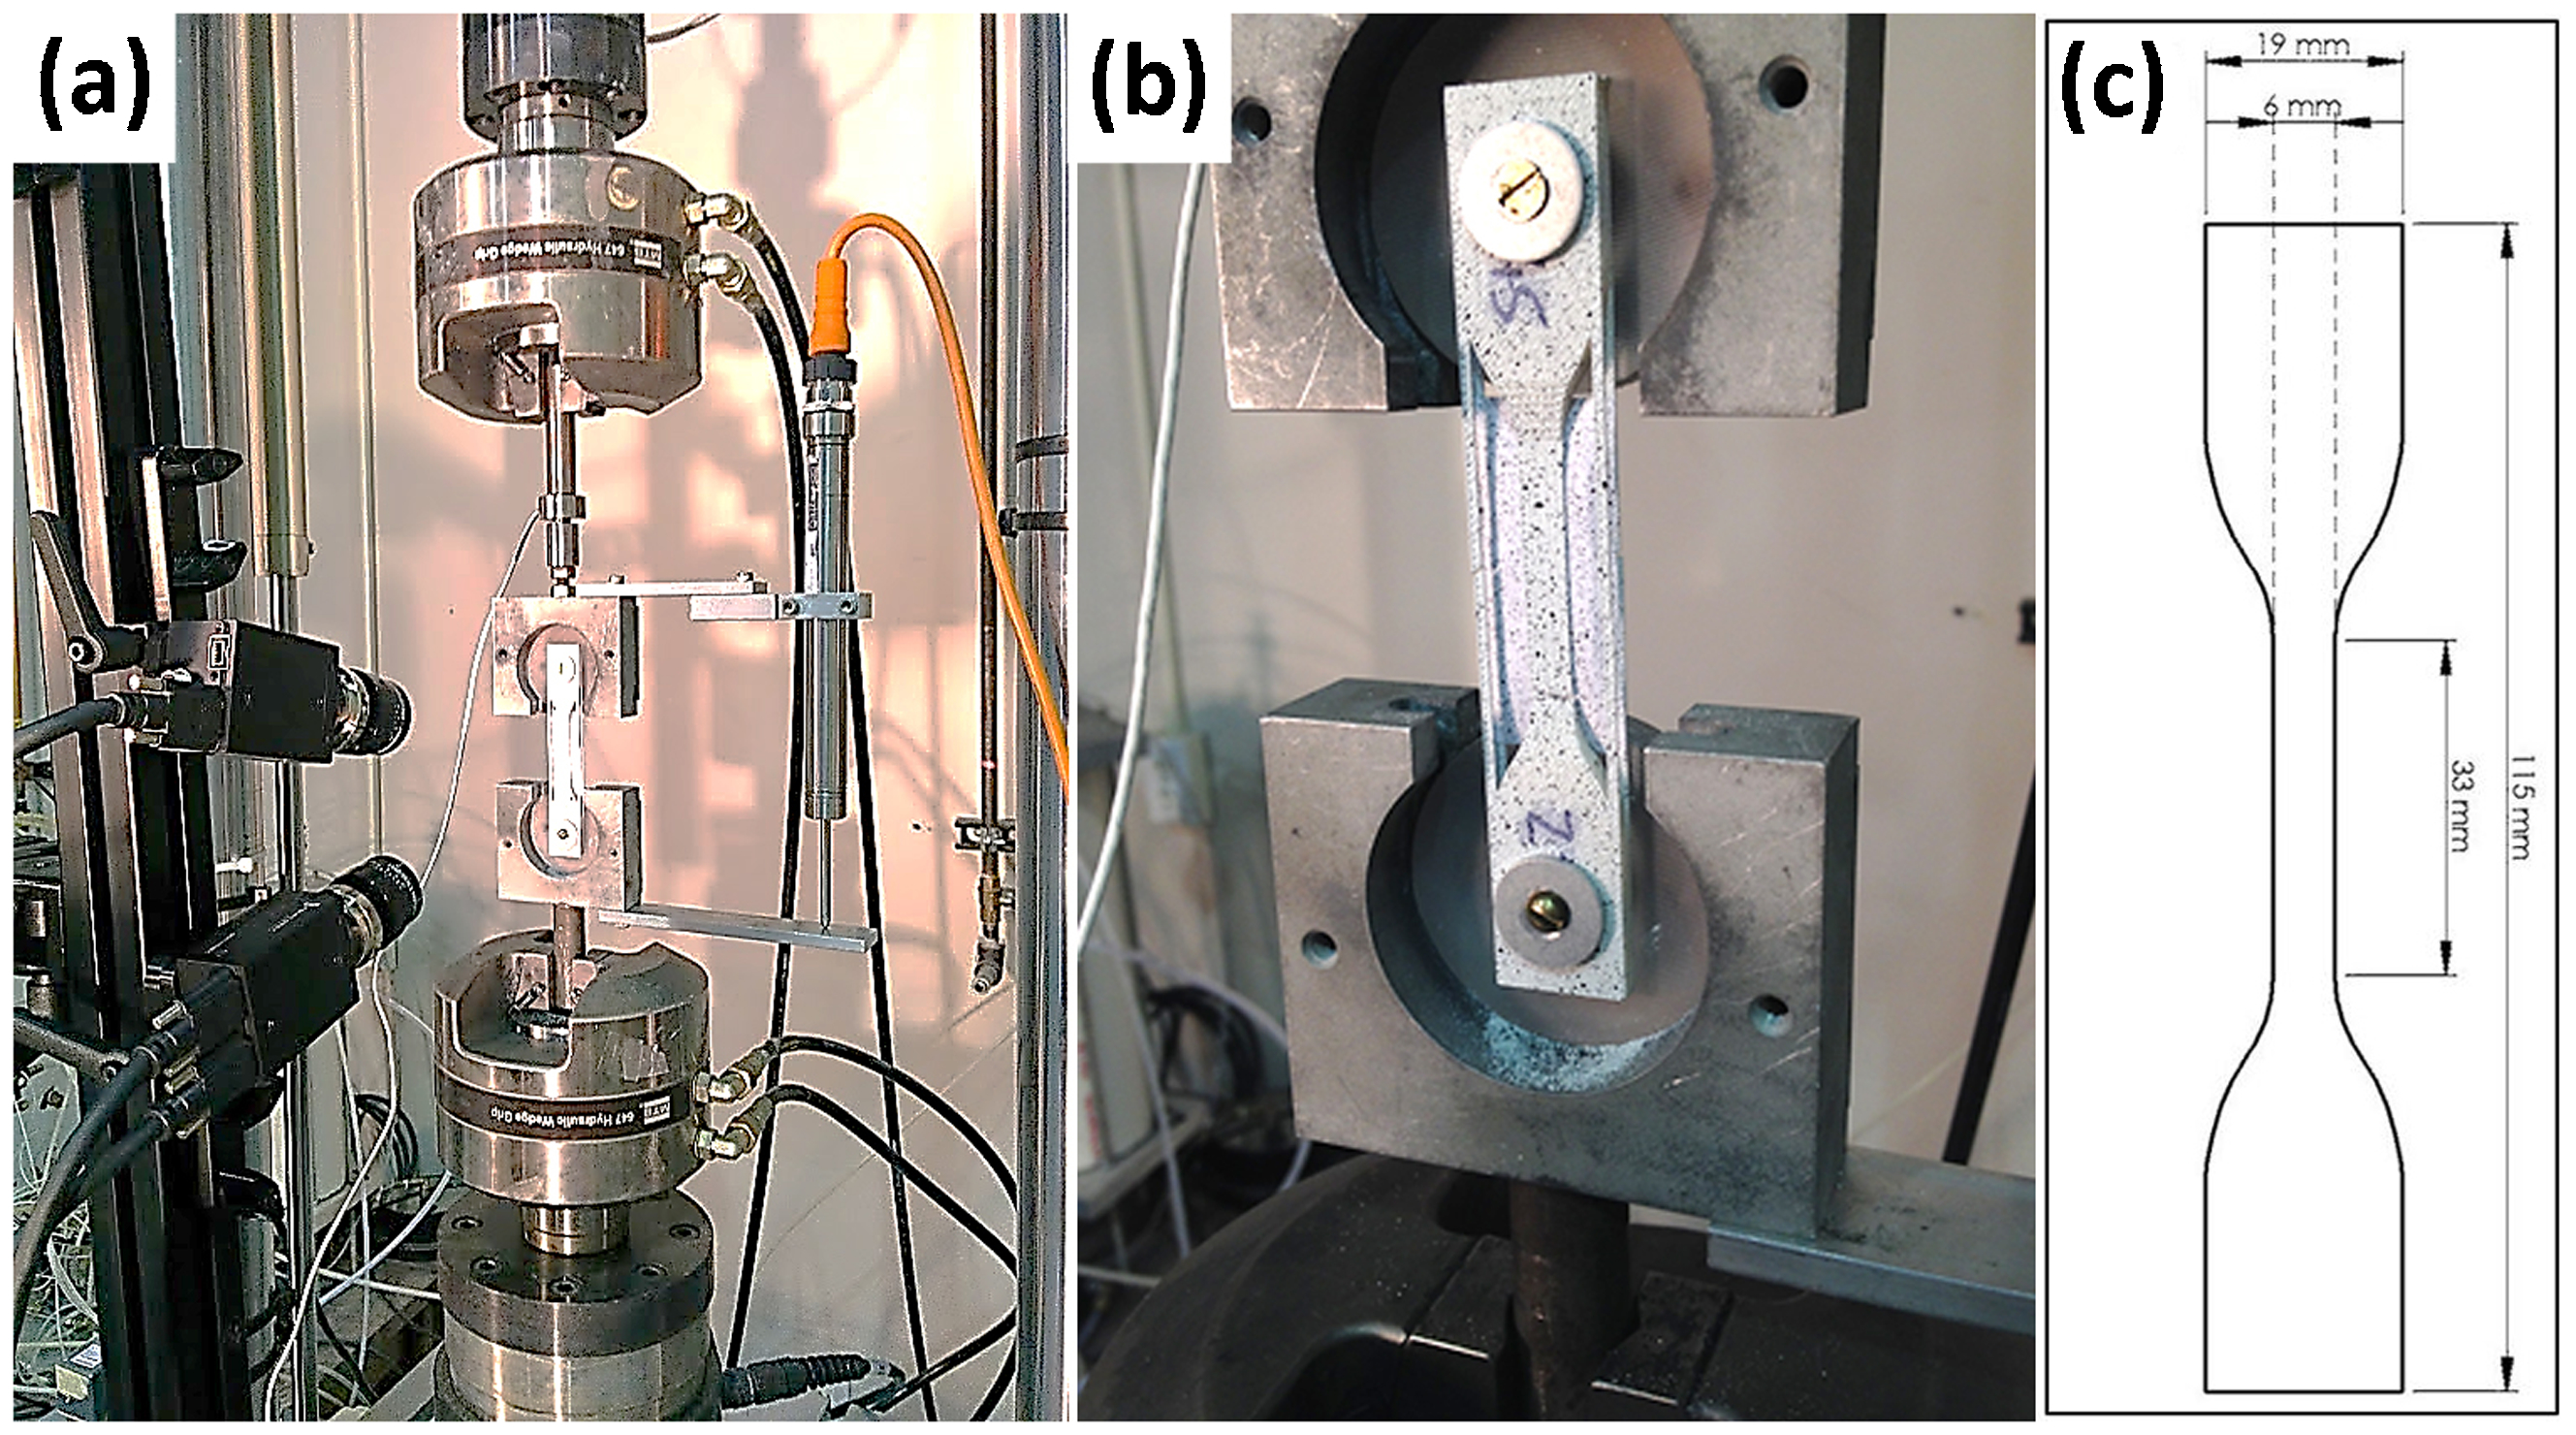
a, b demonstration of test set-up: tensile test machine and DIC system; c sample set-up and speckle patterns
Experimental results
Effective Young's modulus
The results obtained from experimental study for the effective Young's modulus are presented in Fig. 8. The trend of modulus dependency with raster angle measured from experiments is found to be similar from numerical simulations using simple linear elastic based FE methods as shown earlier in Fig. 3. An increase in raster angle resulted in a decrease in the value of the effective Young's modulus under tensile loading for all the samples. This rate of decrease in effective properties from FDM becomes significant when the air gap changes from negative to positive amount. However, this sharp change in effective properties was not in numerical simulations due to the simplified assumptions used for representing bonding between adjacent filaments. Experimental data resulted in effective Young's modulus values lower than those obtained using FE method. This is likely associated with inability to model progressive failure and will require non-liner local properties for representing observed behaviour in the numerical simulations. Effective Young's modulus strongly depended on raster angle and air gaps used in FDM process as expected and values in the range of 10–90% of the modulus of the bulk material were observed for varying raster angles and gaps between fused deposition filaments in the FDM process.
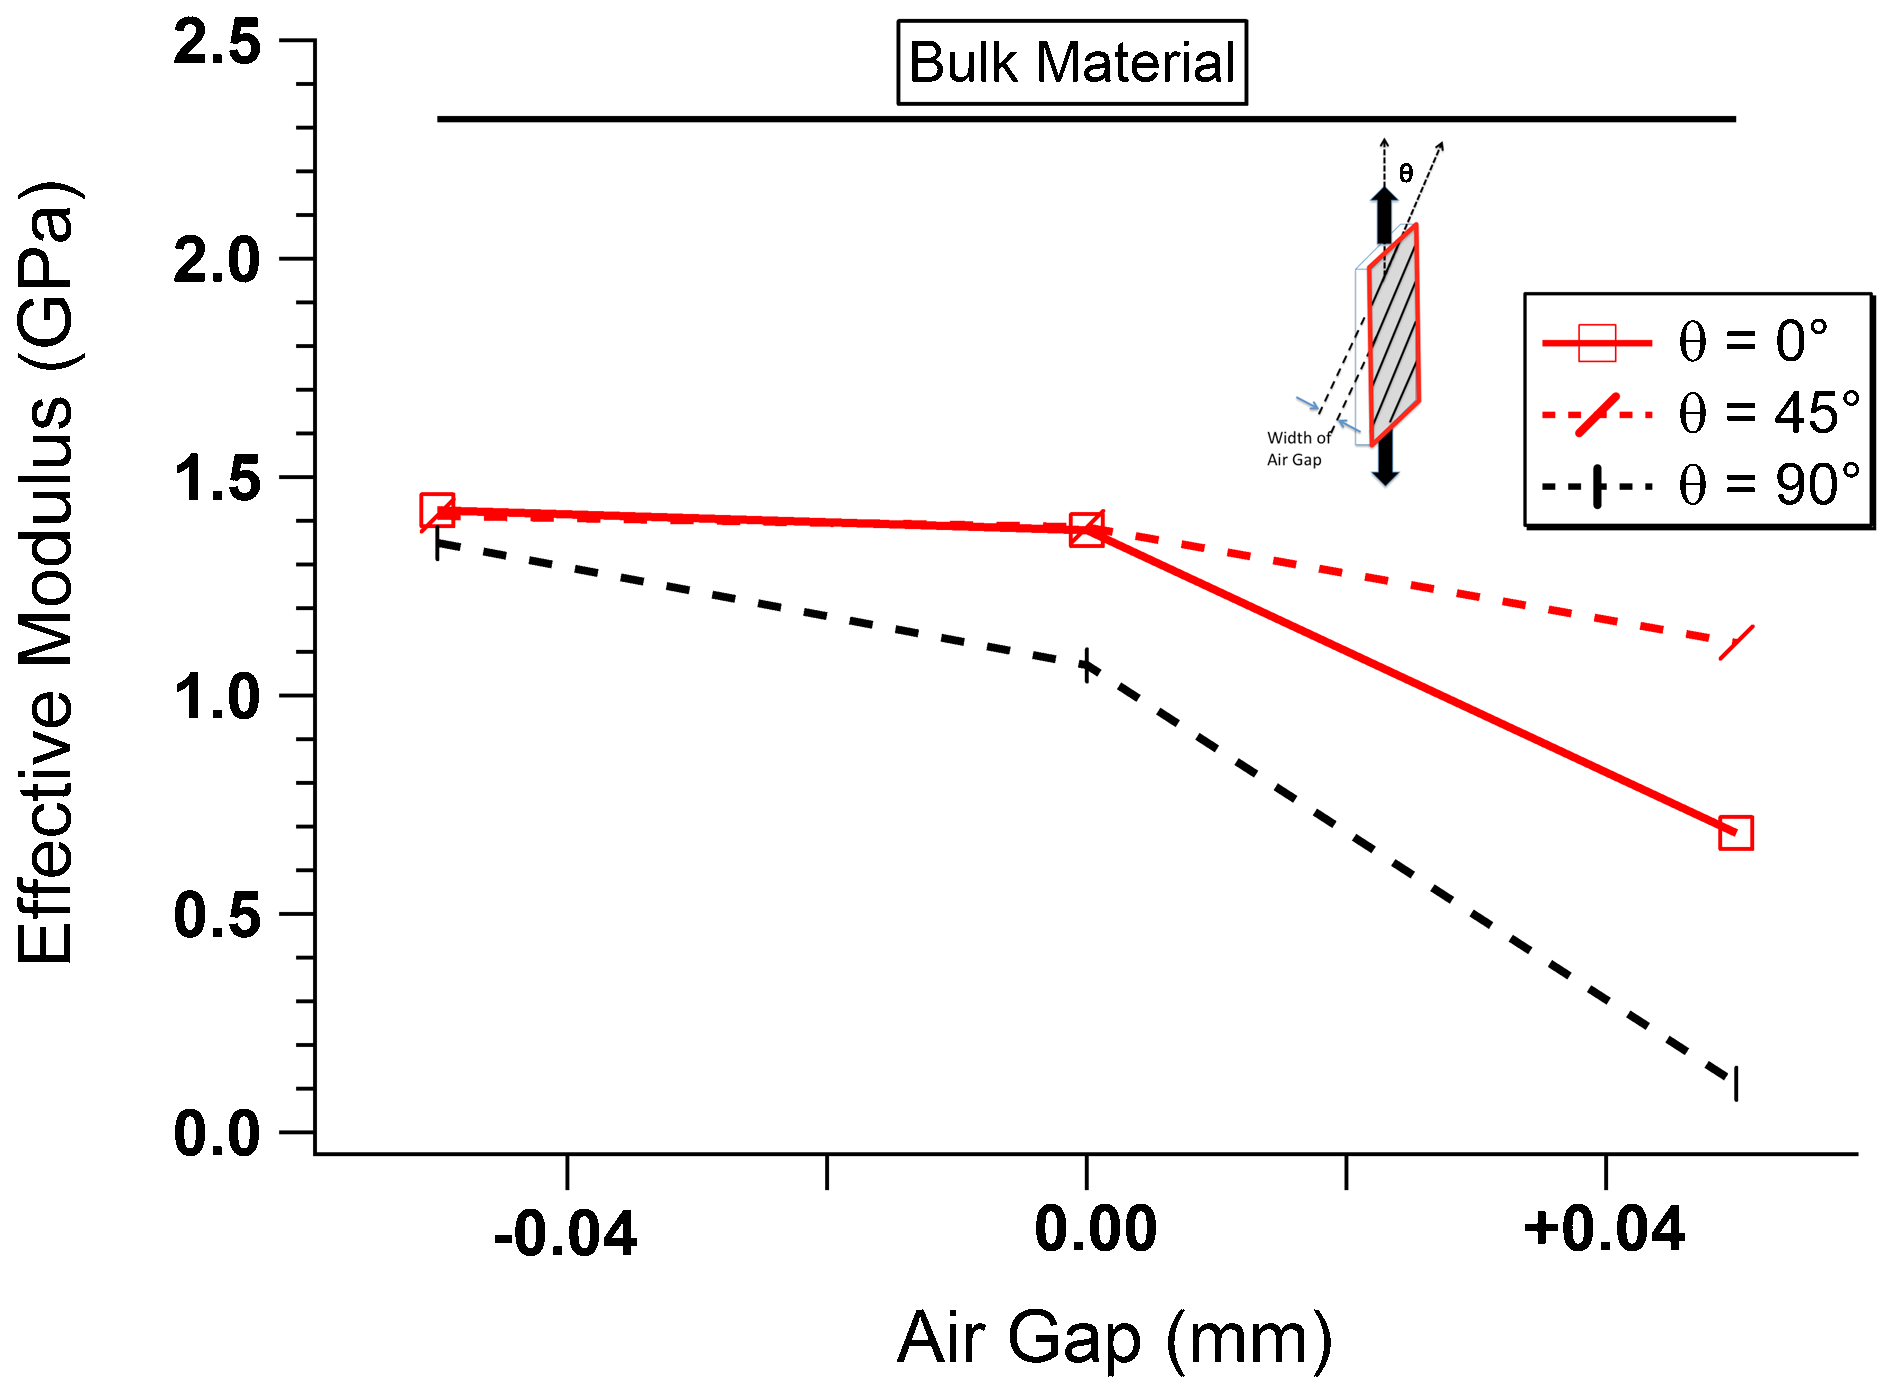
Experimental effective Young's modulus versus air gap for various raster angles
Full field strain distribution
In Fig. 9, the full -field strain distribution along the loading direction for each sample is presented. The results correspond to the case for axial applied force of 2 N so that a relative comparison on deformation evolution as a function of FDM process parameters can be made. Strain field was observed to be relatively uniform in the horizontal direction for most of the samples made with different build parameters except for parts made with 45° raster angle where the strain localisations are clearly evident at the bonding between adjacent rasters. Increasing the air gap from a condition of overlap (−0·05 mm) to the presence of a gap (+0·05 mm), the amplitude of axial strain is substantially increased with clearly visible areas of deformation localisation, leading to premature failure. For a fixed amount of air gap, increasing the raster angle from 0 to 90° leads to similar observations. If one were to interpret such results as a function of axial load or strain value, high strain concentrations were observed initially on the contour region of a deforming sample followed by strain localisations extending into the raster area leading to sample failure. Based on these observations from single layer FDM part, it is expected that for those additively manufactured or 3D printer complex parts made with several layers having different raster angle or air gaps, those layers with higher raster angle or air gap may initially reach higher values of the localised strain and could act as the failure initiation points, reducing the overall mechanical integrity of the part. This observation demonstrates the importance of developing rational observations on a filament scale (mesoscale) process for a lamina based understanding and analysis, to be extended later to a 3D printed FDM part scale which is often built in layers, to predict performance under complex loading conditions.
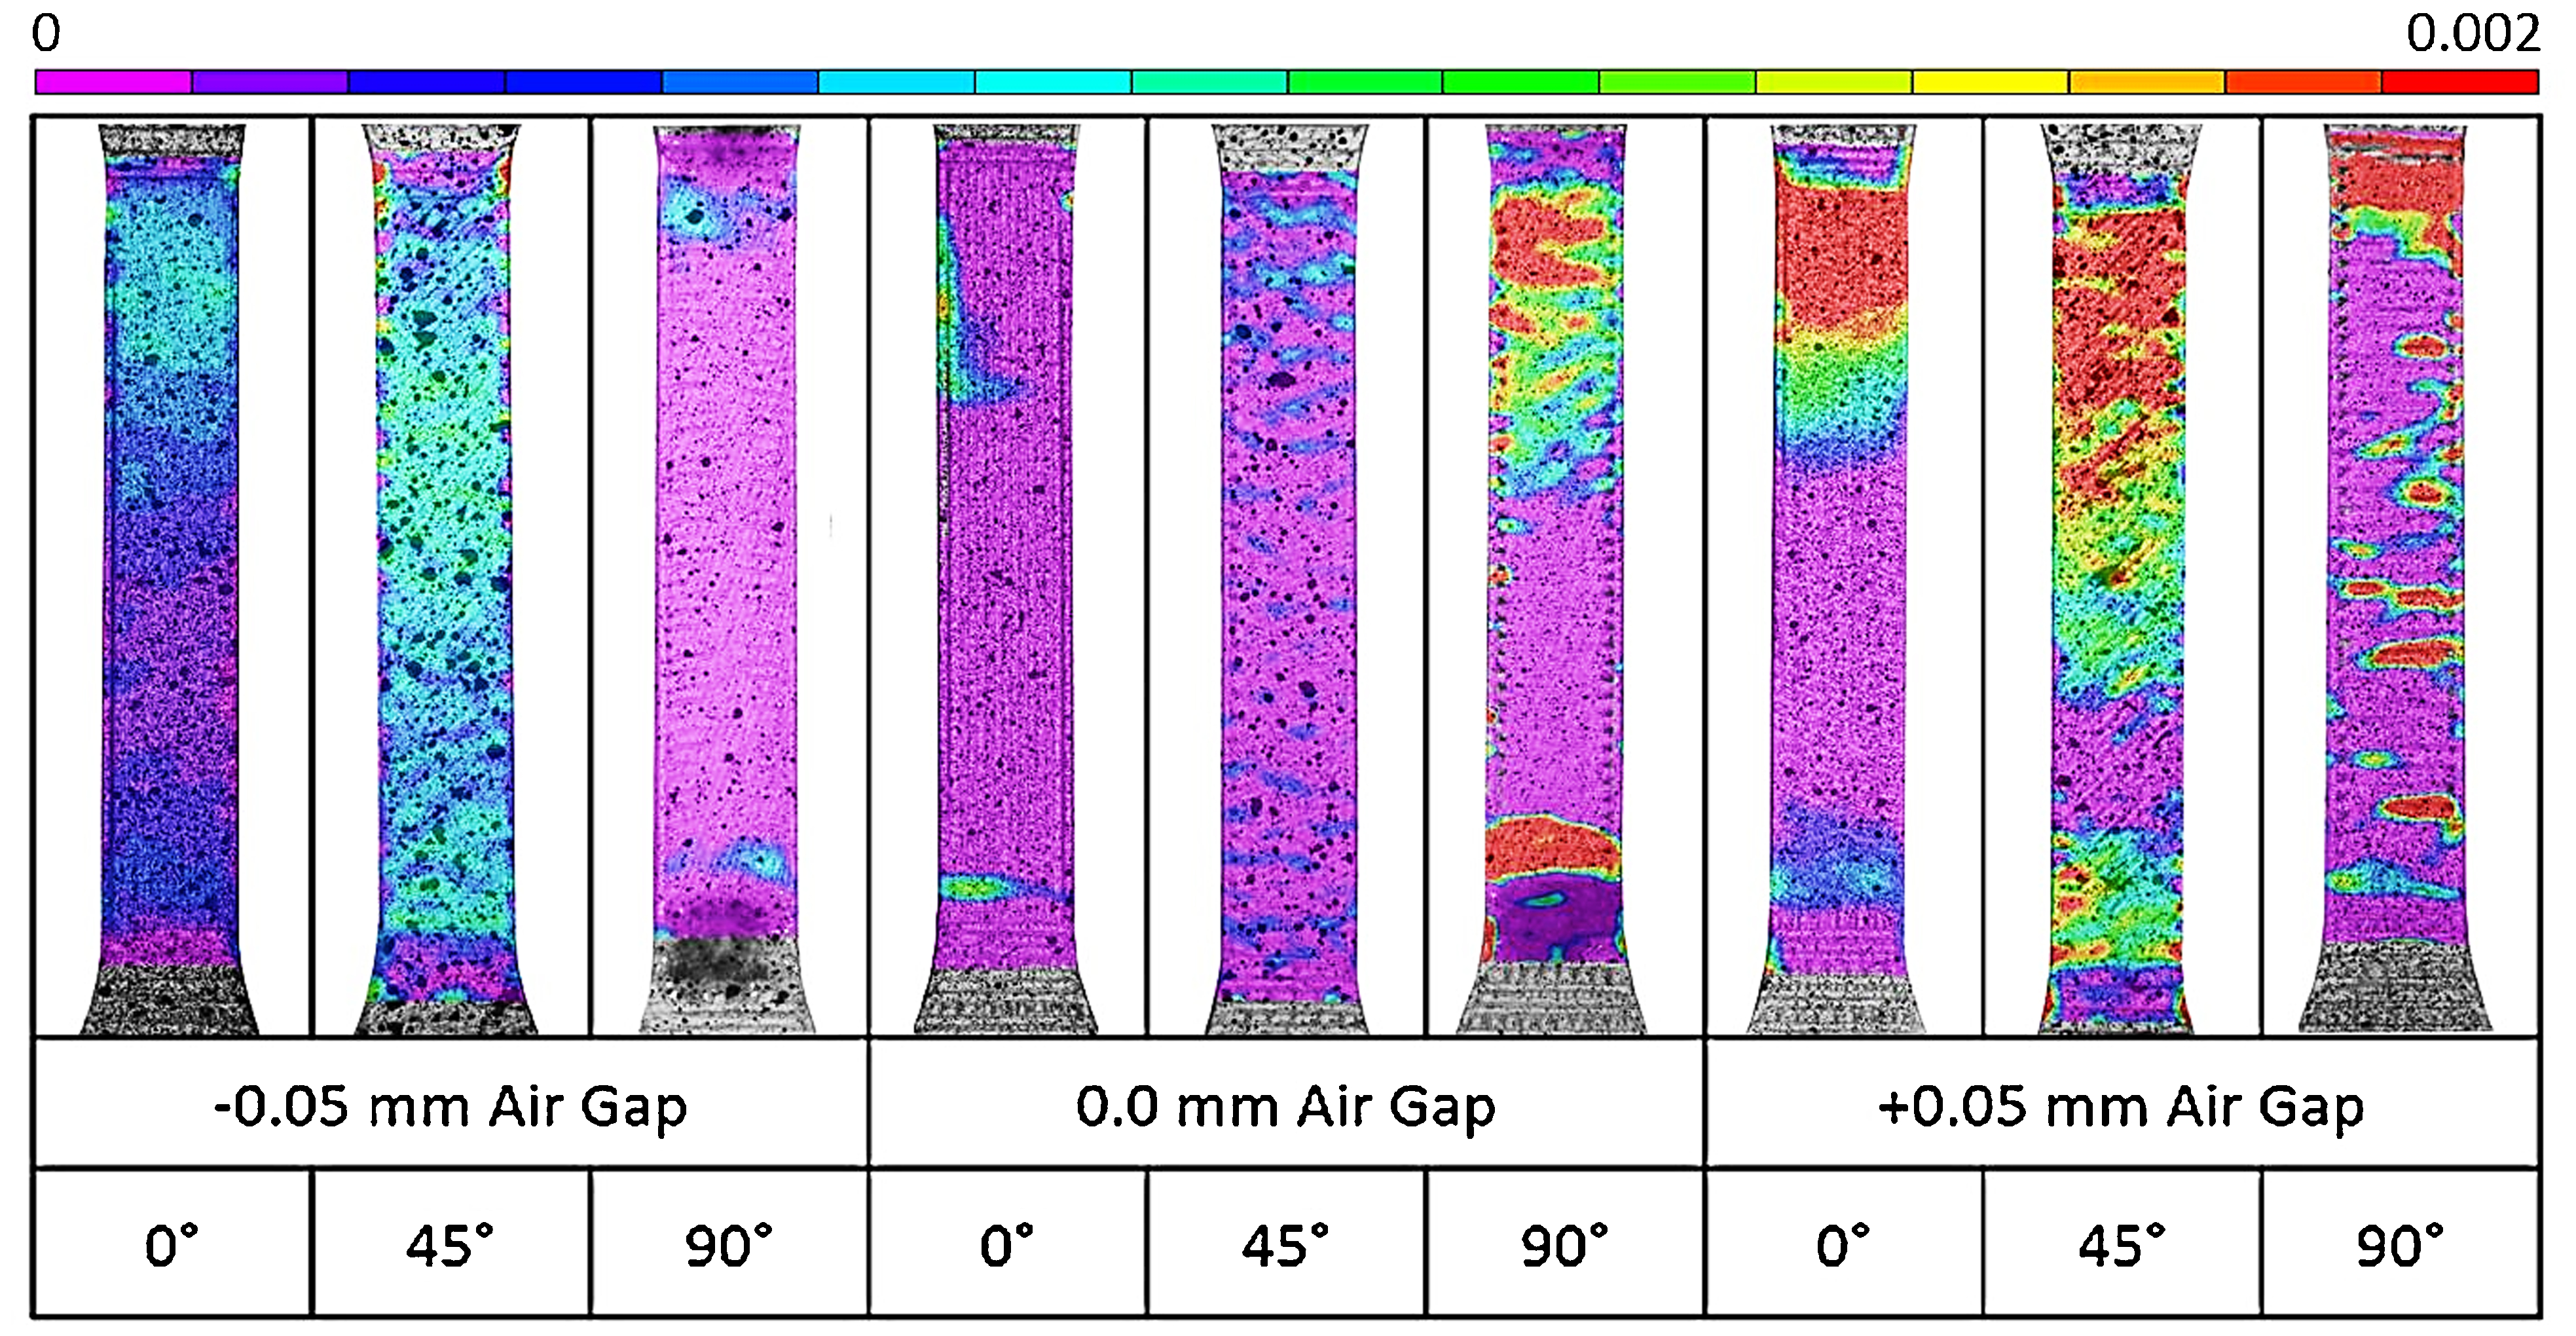
Axial strain field (in direction of applied load) obtained from experiments for samples with various raster angles and air gaps
Strain energy density distribution
The strain energy density (u) for the surface of each sample is related to axial, lateral and shear strains can be written as below in equation (1).
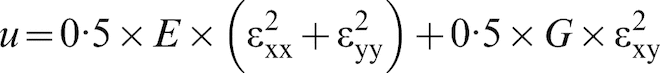
By considering a constant thickness for the single-layer and using the contour to raster volume ratio (80∶20) obtained from the FE models, comparisons can be made between the strain energy density in features of the layer, i.e. contour and rasters. Therefore the amount of strain energy density on the surface can be considered to represent the strain energy density in volume of the features. Figure 10 demonstrates the strain energy density distributions over the surface of the FDM samples. The non-uniform distribution of strain energy density and its concentration on the contour is obvious. The result from the DIC tests shows that when this energy density exceeds a certain amount of energy, contour fails at the first point followed by progressive failure and modelling of FDM parts need to accommodate such complex failure criterion. For all samples excluding the one with raster angle of 45° and air gap of zero, increasing the raster angle or the air gap increased the strain energy density on the surface especially on the contour regions of the samples. The regions with highest amount of strain energy density are observed to be at the contours with a high difference in energy density when compared with the rasters area. This indicates contour region experiences a significantly higher amount of energy density when compared with the raster area. Energywise, the ratio of energy to mass for contours has a higher amount in comparison to that of the raster area, meaning that the material utility of the features of FDM single layer, i.e. rasters and contours, is varying by altering the targeted build parameters giving the designer the opportunity to optimise the mechanical properties of the FDM parts with optimising the filament scale mechanical properties.
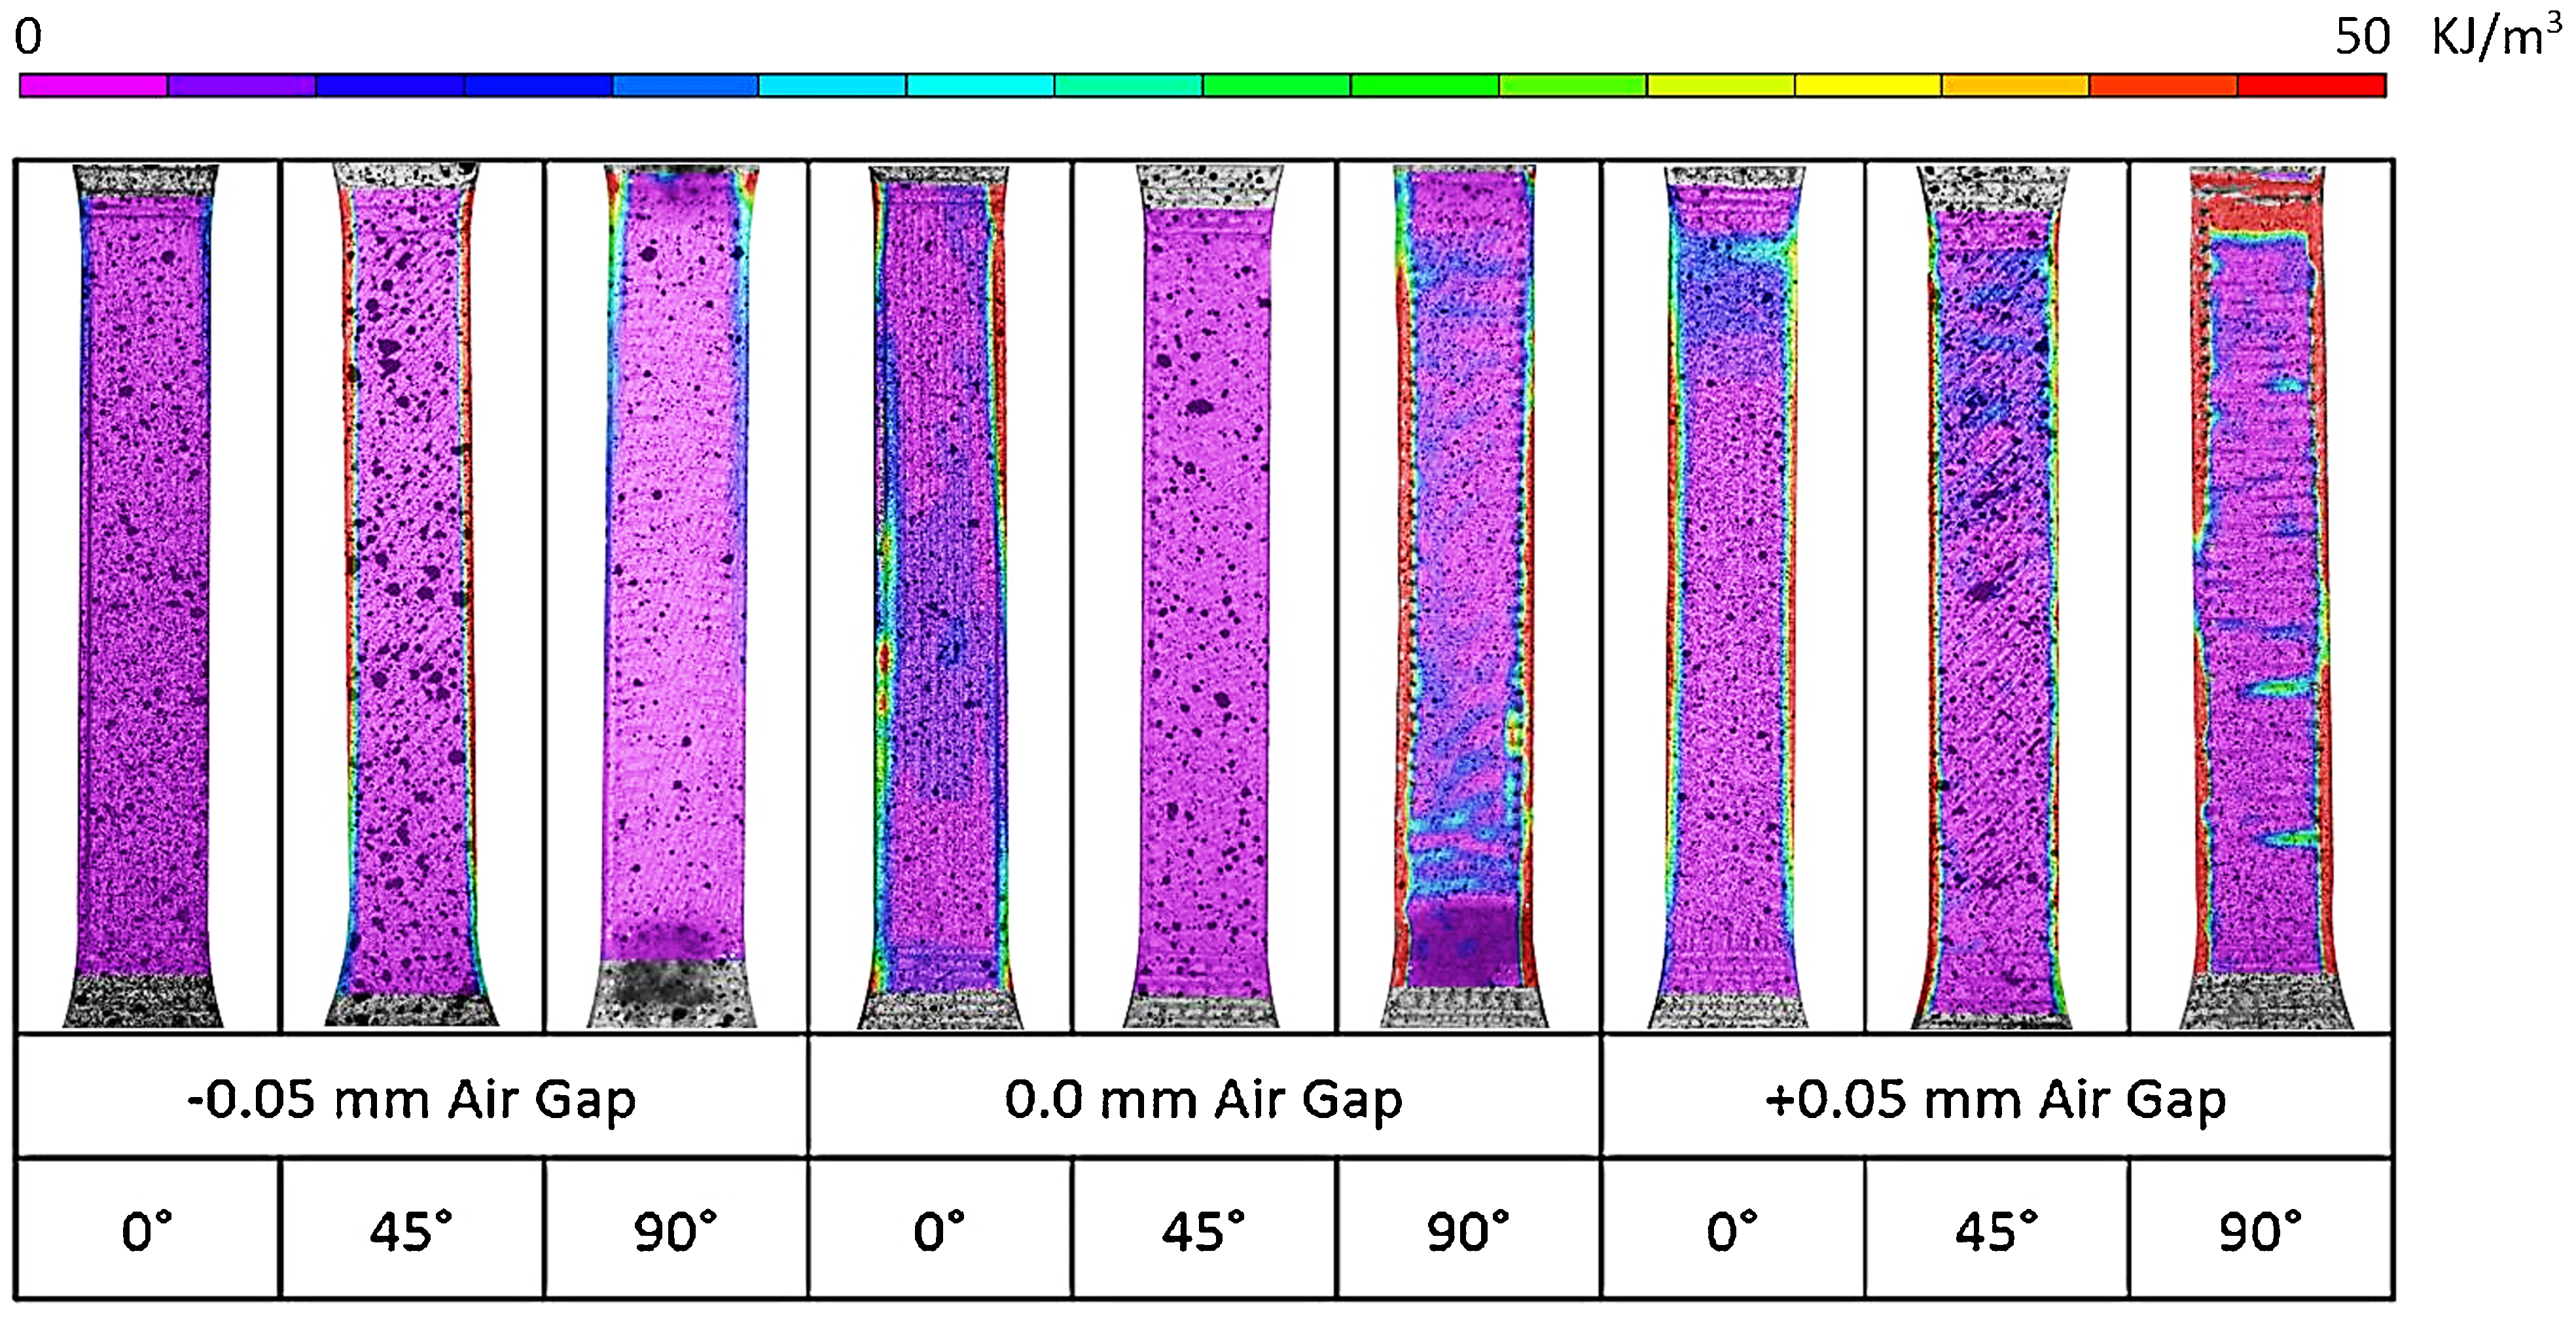
Strain energy density distribution from experimental study for samples with various raster angle and air gaps
Mechanical strength
Engineering stress versus strain obtained for various FDM based tensile coupon samples are shown in Fig. 11. As can be seen, the failure strength decreases as the air gap increases from overlap condition to a positive value. As it can be seen in this figure, increasing the air gap or raster angle for all samples leaded to reduce in the strength of the single layer. The effect of air gap on the strength is more drastic for layer made with 90° raster angle as it can be seen from the difference between strength for various air gaps. It can be said that by increasing the raster angle increases the sensitivity of the layer's strength to the air gap between adjacent rasters. In other words, for higher amounts of the air gap since the angle between rasters axes and the load direction increases, the capability of the rasters to carry the load decreases and the bonding between adjacent filaments play a bigger role to carry the load. By changing the air gap the strength of these bonds changes and therefore the strength of the layer lies more on this bonds when compared with layers which have less amount of raster angle and material of raster area holds more load. The sensitivity and role of the bonds increases as the raster angle increases.
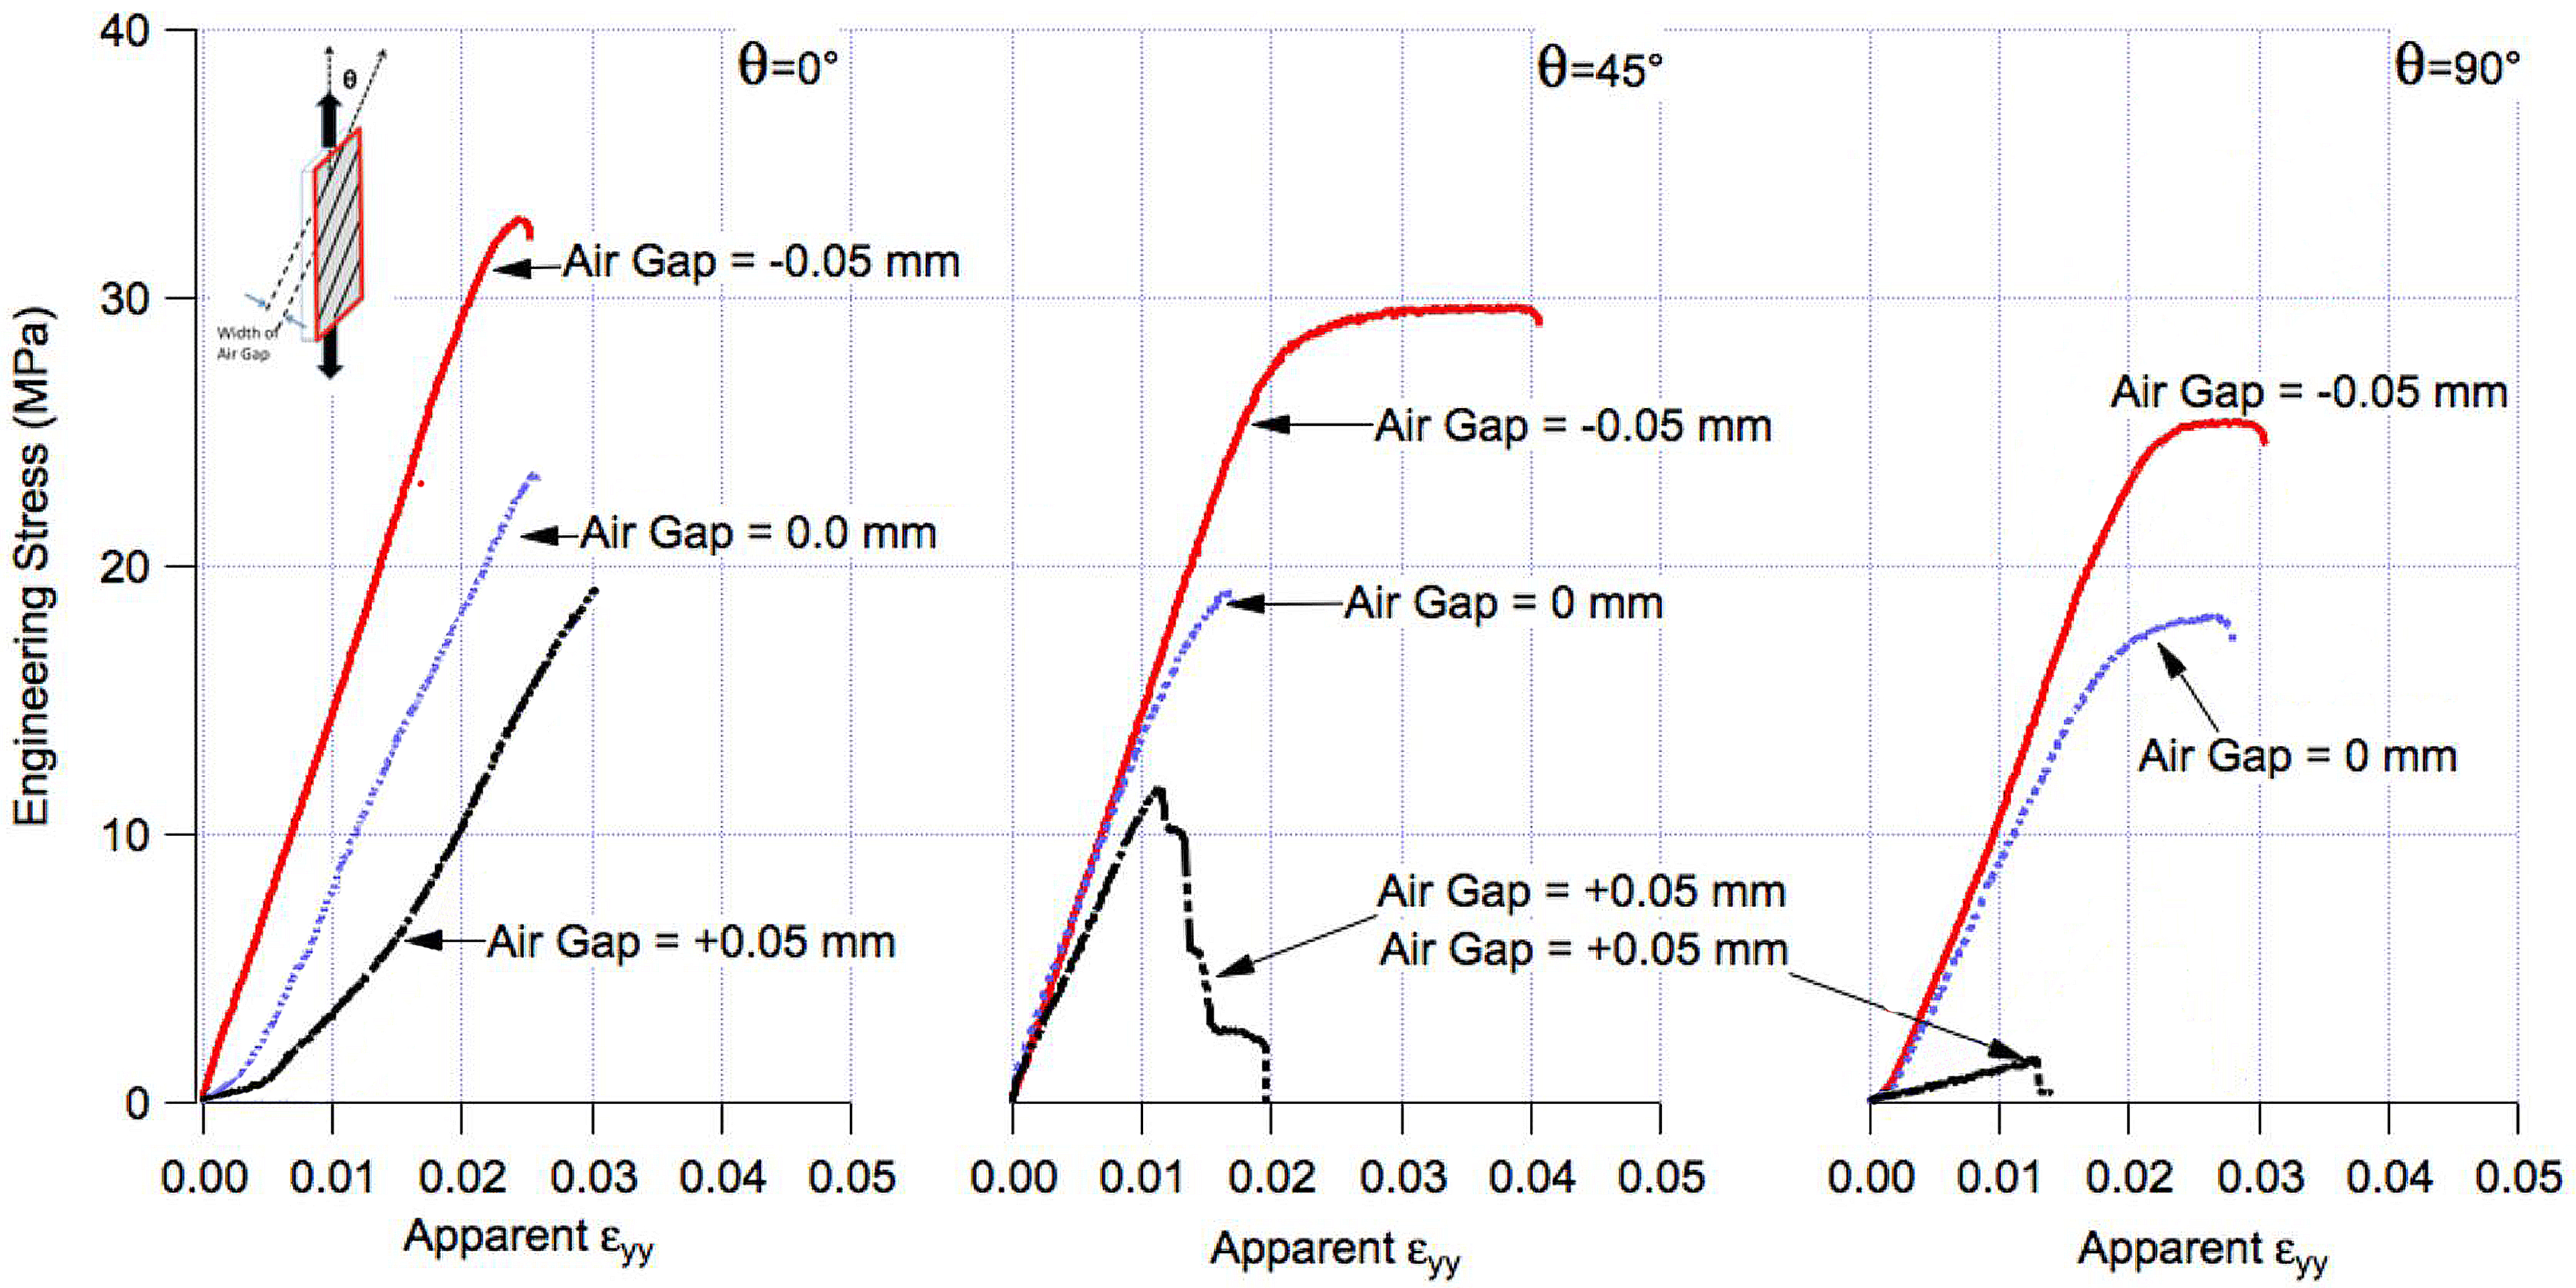
Engineering stress versus apparent strain in loading direction obtained from experiments for samples with various raster angle and air gaps
Numerical and experimental methods comparison
The simulations of the change of effective Young's modulus have been extensively investigated by several research groups in the past.3,8–12 Although the numerical model is not quantitatively validated by the experiments due to the simplifying assumptions used in modelling to represent the material state as homogeneous, qualitative comparisons can be inferred at this stage. The effective Young's modulus increase as the air gap reduces from positive to negative and the improvement is most evident when the raster angle is 90°, which qualitatively agreed with our simulation results. In the future work, we can take into account of the imperfect filament bonds by treating the filament bond as an artificial material with experimentally calibrated material properties so that the multiscale relationship between the inhomogeneous material property at the filament scale and the macroscale property of the FDM part can be systematically studied as a function of key manufacturing process variables. In addition, plasticity and failure criteria need to be taken into consideration to enable the formation of progressive failure based on strain localizations clearly observed using the full field strain mapping approach introduced first time for additively manufactured material through the current study. Moreover, the stochastically distributed defects can be incorporated for studying the influence of the stochastic characteristics of the FDM process by integrating high resolution and non-invasive damage diagnostics using X-ray computed tomography.
Summary and conclusions
A study of the multiscale relationship governing the mechanical properties of fused deposition modelled planar parts has been conducted for a commonly used thermoplastic (ABS). A simplified finite element model was used to examine the response of the fused deposition modelled part to tensile loading, considering filament scale. A novel experimental method was implemented to study full field deformation patterns of tensile samples while subjected to deformation, to relate spatial variation to material location and process variables and to evaluate the insights gained from the finite element simulations.
At the filament scale, it was found that the load transfer mechanism shifted from the rasters to the contour when the air gap was changed from a negative value, corresponding to overlap in the fusion zone of filaments, to a positive value for varying raster angles of 0, 45 and 90°. At the full (part) scale, the effective compliance of the fused deposition modelled part followed similar trends to those observed at the filament scale. The findings suggest that an opportunity exists to improve the mechanical properties of fused deposition modelled parts by redesigning the raster contour patterns that are currently employed in the polymer additive manufacturing field.
The proposed multiscale study, combining cleverly designed specimens and an innovative experimental procedure, provides a new approach to develop fundamental understanding of the process–property relationships during fused deposition modelling. This approach is potentially much more effective than the knowledge gained from the expensive and limited results available through the currently used empirical approach.
Acknowledgements
The authors would like to thank Dr Matthew Young, Eastman Professor or Practice at the University of Tennessee, for assistance in making the FDM samples used in the analyses, as well as Dr. C. Duty and Dr V. Kunc of Manufacturing Demonstration Facility at Oak Ridge National Laboratory for helpful discussions related to design issues with polymer additive manufacturing.