
Abstract
Free end torsion was carried out on extruded Mg alloy AZ31. Subsequently, tension or compression was implemented on pretorsion specimens. The microstructures of samples with 100 and 200° of pretorsion reveal that no obvious change has occurred; however, samples with 300 and 400° of pretorsion show that there are extensive twins. Compressive yield stress of pretorsion samples increases with increasing pretorsion angle. However, their tensile yield stress exhibits practically the same value with extruded samples. Consequently, yield asymmetry ratio increases from 0.55 of extruded sample to 0.84 of sample with 400° of pretorsion. Both textures rotated around the radial axis by free end torsion, and different deformation mechanisms of compression and tension deformation result in decrease in yield asymmetry.
Introduction
Magnesium alloys are lightweight structural materials whose densities are ∼75 lower than steel and ∼35 lower than Al alloys. 1 Mg alloys have been increasingly used for portable electronic devices, automotive and aeronautical parts and structure because of their excellent physical properties such as high specific strength, high stiffness and low density.2,3 Nevertheless, the application of Mg alloys was restricted due to their poor ductility, which resulted from the limited slip systems during plastic deformation. 4
Most Mg alloys display obvious anisotropy and tension–compression yield asymmetry due to their texture and the polar nature of deformation twinning. 5 Yield asymmetry is always used to describe the difference of yield strength between tension and compression. 6 The ratio between tensile and compressive yield strength (hereinafter, referred to as the yield asymmetry ratio) is used to describe the extent of yield asymmetry. 7 It was reported that yield asymmetry ratio can increase from 0.4 to 0.6 in coarse grain Mg alloys to 0.8 to 0.9 in fine grain samples. 8
Great effort has been made to reduce the yield asymmetry in Mg alloys, such as weakening texture,9,10 grain refinement,11,12 alloying and precipitation6,13 and heat treatment. 14 It has been expected that weakening or randomising the basal texture for Mg alloys might improve formability and reduce the tension–compression yield asymmetry.8,15,16 It is well known that plastic deformation can not only obtain a desired shape but also tailor microstructure and crystallographic texture. 17 Furthermore, large plastic deformation could improve the mechanical properties of Mg alloys. 17 It is possible to achieve large uniform deformation without rupture or strain localisation by free end torsion. 18 For cubic materials 19 as well as some hexagonal closed packed (hcp) metals like zirconium 20 and titanium, 21 the behaviour under torsion is well known.
In particular, a great deal of experimental studies have been conducted on Mg alloys under torsion or simple shear deformation. Beausir et al. 18 reported that Swift effect will occur in the Mg alloy AZ71 under free end torsion. The Swift effect, 22 a particular phenomenon first described by Swift (1947), refers to an irreversible length change (shorten or lengthen) of metallic specimens during monotonic free end torsion. Beausir et al. pointed out that texture evolution associated with torsion deformation is caused by pyramidal < c+a> and < a> slip systems. Guo et al. 23 investigated the behaviour of free end torsion in Mg alloy AZ31 at room temperature. They found that the specimen shortened if twisted along the rolling direction, but it elongated if twisted along the normal direction. The axial effect is due to tensile twinning, which induces texture evolution. Nowadays, it is generally accepted that the Swift effect is because of texture induced anisotropy. However, Cazacu et al. 24 demonstrated that the yield asymmetry ratio dictates whether permanent shortening or lengthening of the specimen occurs. In other words, for a given orientation, if the tensile yield stress (YS) is larger than compressive YS, the specimen will shorten when twisted along that direction. However, if the compressive YS is larger than tensile YS, axial elongation will occur. 25 To some extent, the yield asymmetry ratio would dictate the Swift effect of sample under free end torsion. Conversely, would the Swift effect (free end torsion) affect the yield asymmetry of Mg alloy?
The main objective of the present paper is to investigate the influence of free end torsion on yield asymmetry of an extruded Mg alloy AZ31. The evolution of the microstructure and texture of Mg alloy AZ31 during free end torsion was examined by optical micrograph, X-ray diffraction (XRD) and electron backscattered diffraction (EBSD).
Experimental
The material used in the present study is an extruded AZ31 rod. Free end torsion deformation was performed on cylindrical dog bone specimens with a gauge section 70 mm in length and 10 mm in diameter. The specimens were prepared from extruded rod with their longitudinal axes parallel to the extrusion direction (ED). The geometry and dimensions of sample are shown in Fig. 1.
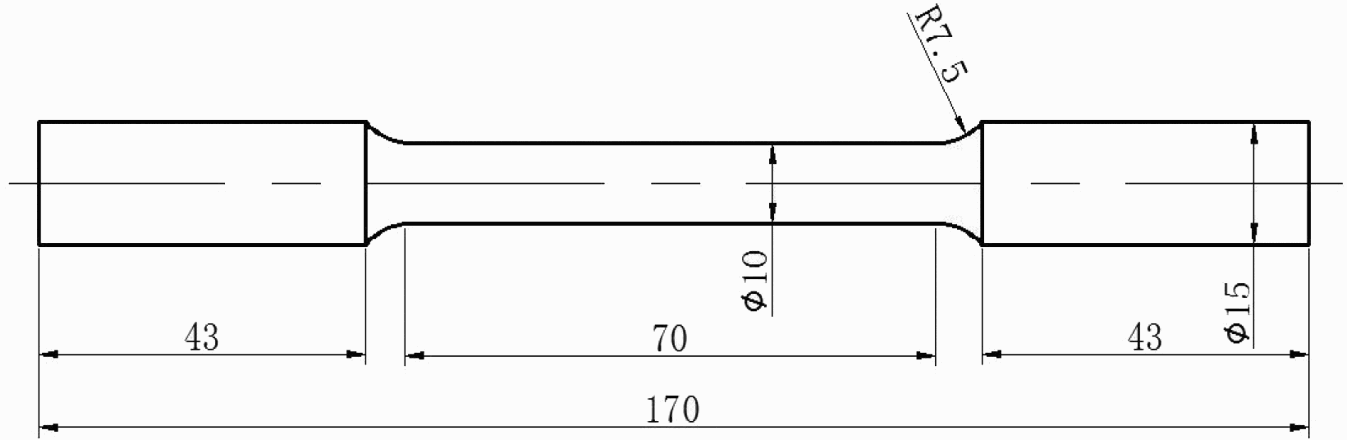
Geometry and dimensions of sample, all dimensions in mm
Torsion tests were carried out using specially designed computer controlled torsion test machine NDW3050 with axial freedom of motion. The actual picture of the torsion test machine is shown in Fig. 2. The torsion test machine is comprised of servo motor, force measurement unit, photoelectric encoder, singlechip, driving (slave) three jaw chuck, computer, etc. Torque is measured by force measurement unit. Twist angles are measured by photoelectric encoder. Initial data of torque and twist angles are processed by software on computer. The values of torque and twist angles can directly be obtained from the computer at last. Each end of the sample was fixed to grips with the help of three jaw chuck on the apparatus as illustrated in Fig. 2. The frictional forces of the axial bearing for twisting are negligibly small with respect to the measured torque.
17
For free end torsion, it is assumed that there is no axial constrain, and the lateral surface of the sample is traction free.
23
After torsion, the sample remains axisymmetric and homogeneous along the axial direction.
23
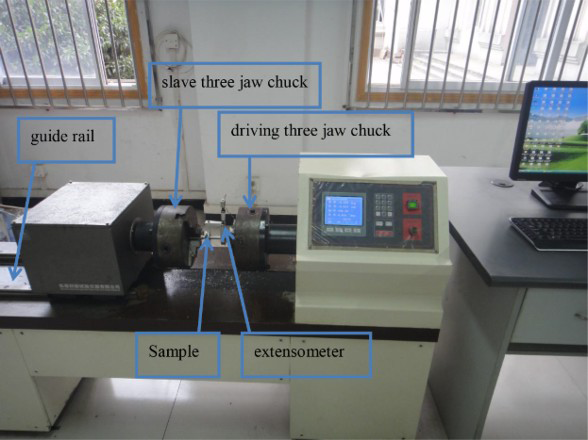
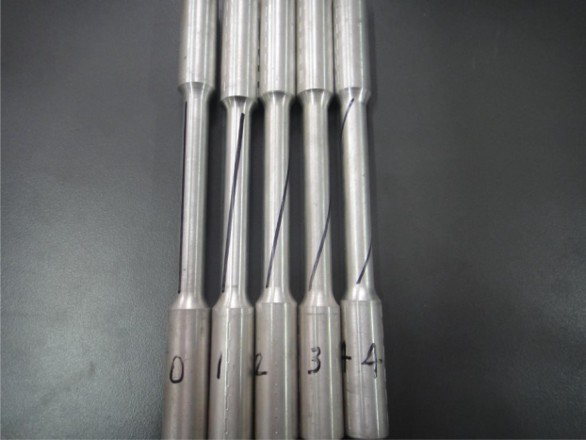
Four group samples were twisted at room temperature and with a revolution rate of 10− 3 rad s− 1 to different torsion angles such as 100, 200, 300 and 400° as shown in Fig. 3. If the torsion angle is bigger than 500°, the sample will rupture. The torque–twist angle curves were measured at different twist angles as shown in Fig. 4a. Using the following equations,
23
shear stress versus shear strain curve can be calculated from the measured twist angle–torque curve.
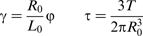
Actual picture of torsion test machine
Pretorsion samples (‘0’ indicated the initial, ‘1’ indicated 100° of pretorsion, ‘2’ indicated 200° of pretorsion, ‘3’ indicated 300° of pretorsion and ‘4’ indicated 400° of pretorsion; draw black line on sample to make torsion deformation clear)
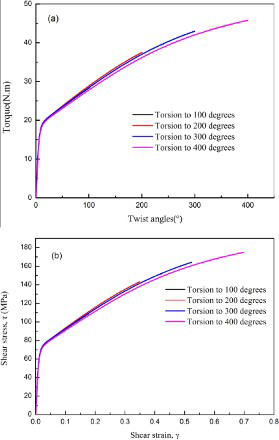
a torque–twist angles curves, b shear stress versus shear strain curves obtained from measured torque–twist angles curves
Shear stress versus shear strain curves in this test, which are similar to that reported in Refs. 23 and 26 as illustrated in Fig. 4b. They exhibit a linear hardening behaviour when loaded monotonically under free end torsion. After torsion, some pretorsion samples were directly used as tensile samples, and other samples were used as compressive specimens (15 mm in height and 10 mm in diameter) that were prepared using wire cut electrical discharge machining. After being rotated to 400°, the samples remain a circular column with little twist. Axial shortening is ∼1 mm. The diameter has almost unobvious change. Shear strain is ∼0.7 as shown in Fig. 4b. Beausir et al. 18 pointed out that shear deformation is very limited at room temperature reaching only γ = 0.2 in the Mg alloy AZ71 and ∼0.4 in the pure Mg alloy. Thus, there is no need to take Swift effect into consideration. Compression and tension tests were carried out on a WDW3100 material test machine at a constant rate of 10− 3 s− 1. Each test was repeated three times to get representative results.
Specimens were manually ground, polished and etched with picric acid solution (5 g picric acid+10 mL acetic acid+10 mL distilled water+100 mL ethanol). The microstructure of the specimens was characterised by optical microscopy. Pole figures of samples were determined using XRD (Rigaku D/max-2500PC) in order to identify the crystallographic orientation. Electron backscattered diffraction analysis was carried out to analyse the twinning behaviours on a FEINova 400 scanning electron microscope equipped with an HKL-EBSD system using a step size of 1 μm. Samples for EBSD were ground mechanically followed by electrochemical polishing in commercial AC2 solution. The HKL Channel 5 software was utilised to process the data obtained from the EBSD, and the indexing percentage was 81.
Results
Mechanical response
The tensile and compressive stress–strain curves of the extruded sample and four pretorsion samples are given in Fig. 5. For the extruded sample, the tensile YS σ0.2 and the peak strength (PS) are 230 and 370 MPa respectively. In addition, the compressive YS and the PS are 126 and 340 MPa respectively. The tensile and compressive stress–strain curves of the extruded sample are similar to those reported in Ref. 27. One can see clearly from Fig. 5a that the flow stress–strain curves of all the pretorsion samples and the initial sample present a typical concave down shape. There is only little fluctuation of the tensile yield strength in the five samples. However, the compressive YS of the pretorsion samples are nearly proportionate to the pretorsion angles as shown in Fig. 5b. The proportionality of compressive YS versus pretorsion angles is revealed in Fig. 6. Mechanical properties derived from the curves in Fig. 5 are listed in Table 1. The as received sample exhibits a large tension–compression yield asymmetry, and the yield asymmetry ratio decreases to a large extent for pretorsion samples. From Table 1, one can see that the CYS/TYS ratio increases from 0.55 of the extruded sample to 0.84 of the sample with 400° of pretorsion, i.e. the yield asymmetry ratio of Mg alloy AZ31 obviously decreases after pretorsion.
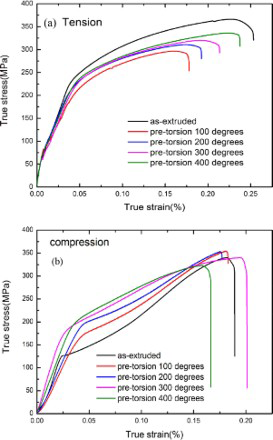
a tensile stress–strain curves of samples with different pretorsion angles and b compressive stress–strain curves of samples with different pretorsion angles
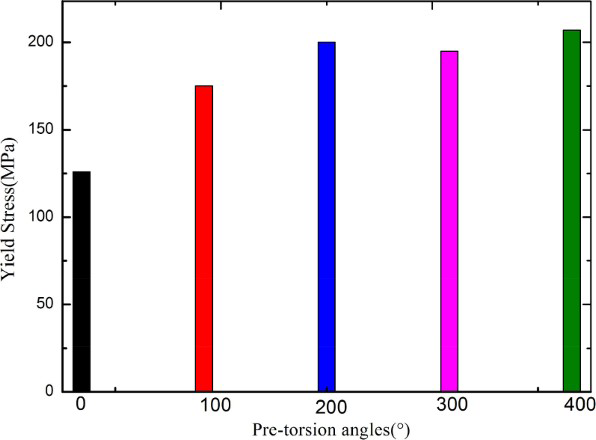
Compression yield stresses versus pretorsion angles
Tension–compression properties of as extruded and pretorsion samples*
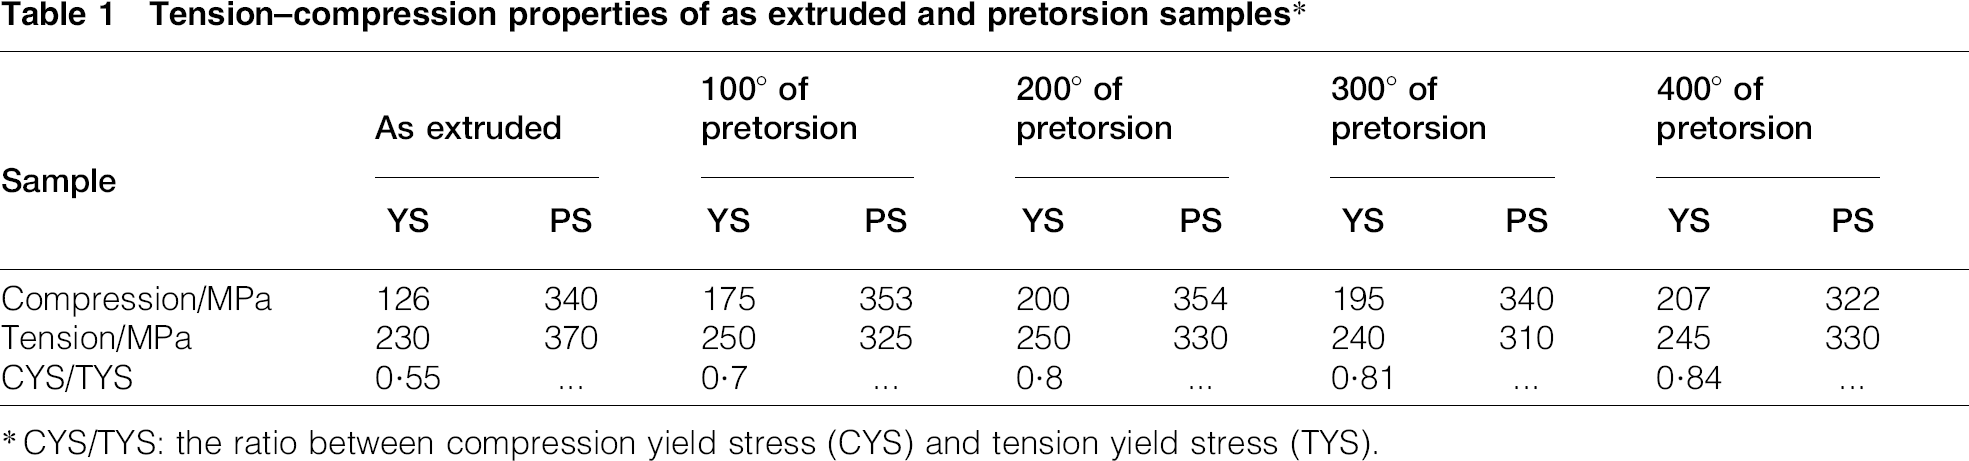
CYS/TYS: the ratio between compression yield stress (CYS) and tension yield stress (TYS).
Microstructure evolution
Fig. 7a–e illustrates the microstructures of the as received material and pretorsion samples respectively. From these figures, one can see that the extruded Mg alloy AZ31 consists of some fine grains closed to equiaxed grains. The average linear intercept grain size is ∼10 μm measured from the optical micrograph. The microstructures of samples with 100 or 200° of pretorsion illustrate no obvious change compared with initial extruded samples as shown in Fig. 7b and c. In order to get more accurate information about the pretorsion sample, the EBSD technique was applied. The EBSD map of the sample with 200° of pretorsion is exhibited in Fig. 8. It was defined that extensive twin boundaries are coloured in red, contraction twin boundaries in green and double twin boundaries in yellow. From Fig. 8, one can see that most grain boundaries are black lines, so there are no twins in the sample. Simple shear is the main deformation mode in torsion deformation, and basal and non-basal slips (prismatic and pyramidal slip) are the main deformation mode at low shear strain. Studies were carried out using elastic–viscoplastic self-consistent model to predict slip/twinning activities under free end torsion.23,28 The results demonstrated that basal and non-basal slips are more active than twinning at low shear strain. Twinning occurred in the samples with 300° of pretorsion as shown in Fig. 7d. From Fig. 7e, one can see that thin and lenticular shaped twins obviously appeared in the sample with 400° of pretorsion, and many twins paralleled to each other in a grain. The previous research results have indicated that they are {10–12} type twins.29,30
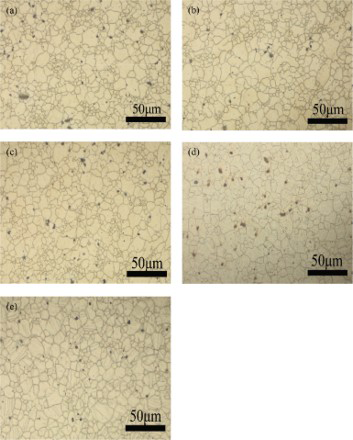
a as received material; b 100° of pretorsion; c 200° of pretorsion; d 300° of pretorsion; e 400° of pretorsionOptical micrographs of samples
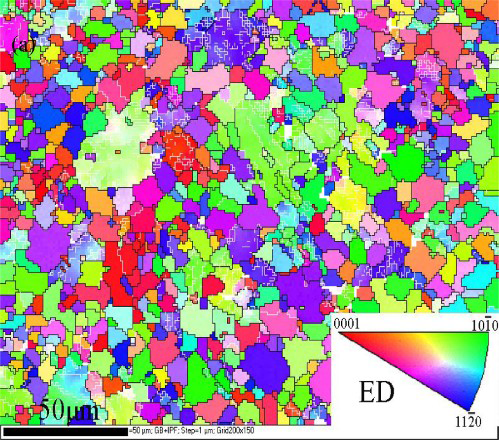
Image (EBSD) of specimen with 200° of pretorsion observed on cross-section
X-ray diffraction scans of the samples after free end torsion deformation are shown in Fig. 9. One can see clearly that the XRD intensity of {0002} peak increases with the increasing torsion strain, but the intensity of {10–10} and {10–11} peak has no obvious change. According to Fig. 9, one can see that the increment of {0002} peak is not obvious. Slip is the main plastic deformation mechanism for torsion deformation, and there is a little twinning deformation as reported in Refs. 23 and 28. Slip and twinning will lead to macroscopic plastic deformation, and twinning will change the orientation of grains. Figure 10 shows the {0002} and {10–10} pole figures of Mg alloy AZ31 before and after pretorsion respectively. For pole figure, the projection plane is with normal R (the radial axis), the shear direction is horizontal (θ axis) and the axial direction Z is vertical. 18 Textures in the samples were measured within a 8 × 5 mm surface, paralleling to the longitudinal axis of the sample, which is near the outer surface of the rod. Under torsion deformation, the outer surface of cylindrical sample subjected to severely shear deformation can represent the texture evolution. As revealed in Fig. 10a, basal planes of most grains in the extruded magnesium alloy are nearly parallel to ED, that is to say, c-axes of most grains are nearly perpendicular to ED. According to the {10–10} pole figure shown in Fig. 10a, the six equivalent {10–10} planes are orthogonal to ED, but only two out of the six equivalent {10–10} planes are nearly perpendicular to ED, i.e. there is a classical ED// < 10–10> component in the extruded alloy that lies in the shear plane during torsion. 18 For sample with 200° of pretorsion, the initial texture with the c-axes aligned perpendicular to ED becomes weaker, and the texture is tilted to the axial direction with the torsion angle enlargement as shown in Fig. 10b. Figure 10c exhibits the texture in a zone of the specimen with 400° of pretorsion. It seems that the orientation was rotated by an angle of ∼30° around the radial axis compared with the initial texture. The texture rotated ∼30° in this test is identical with that in Ref. 18. When the sample is subjected to free end torsion deformation, there is not only shear stress on the cross-section (radius) but also normal stress along the longitudinal section (axial direction). Albinmousa et al. 26 reported that, in the simple shear test, equal and opposite normal stresses along the c-axis and perpendicular to the c-axis accompany the shear stress. The presence of normal stress in a simple shear test can lead to extension along the c-axis. That is why twins were observed in these tests. The principal stress along the axial direction (ED) tilted 45° is the greatest one than other directions. It is probably that complex stress leads to texture rotation and twinning.
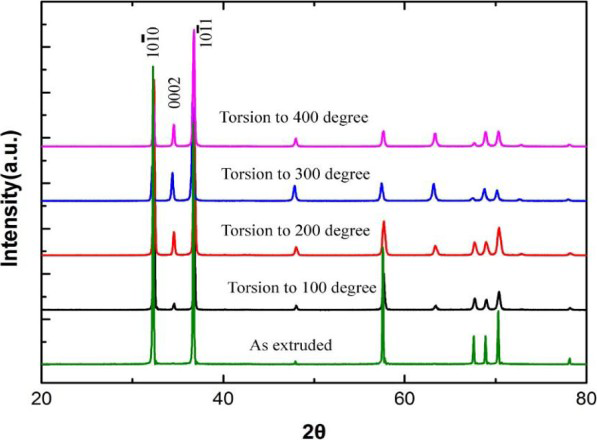
X-ray diffraction scans from cross-sectional plane of extruded magnesium alloy AZ31 after torsion deformation
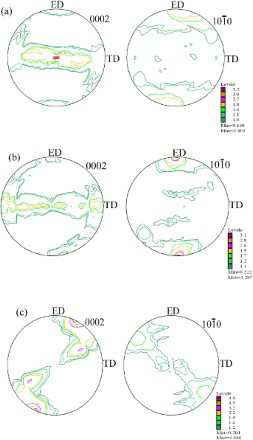
a extruded sample; b 200° of pretorsion; c 400° of pretorsion, textures at outer radius of solid bars under free end torsion Pole figures of sample
Effect of pretorsion on compressive deformation behaviour
The compressive stress–strain curves of the extruded Mg alloy AZ31 are given in Fig. 5b. The compressive YS and the PS of the extruded sample are 126 and 340 MPa as shown in Table 1. The stress–strain curves exhibit a sigmoidal shape during compression deformation, which is known to be a typical feature of the twinning dominated deformation.2,31 Compressive YS of the pretorsion samples increased because of the existence of pretorsion strain as indicated in Fig. 5b. Obviously, compressive YS of the pretorsion samples increases with the increasing pretorsion deformation.
Twins did not appear in the samples with 100 or 200° of pretorsion as shown in Fig. 7b and c. It is generally accepted that, at room temperature, the critical resolved shear stresses (CRSS) corresponding to the various slip and twinning systems increase in the order CRSSbasal < CRSS{10–12}twinning < CRSSprismatic < CRSSpyramidal. 32 When samples with 100 or 200° of pretorsion are compressed along ED, the main deformation is not basal slip but prismatic < a> slip, pyramidal < a+c> slip and extension twinning. 27 Although the c-axes of most grains are tilted about a few angles along the radius as shown in Fig. 10b, most of the basal planes are still parallel to ED. When the samples with 100 or 200° of pretorsion are compressed along ED, the compressive stress is parallel to the basal plane. The angle between the loading direction and the normal direction of basal plane is nearly 90°, and consequently, the Schmid factor is nearly equal to zero. This orientation is unfavourable for basal slip but favourable for non-basal slip and extension twinning. Compared with the initial extruded sample, the pretorsion samples have accumulated a great number of dislocations. Previous studies reported that dislocations may act as barriers of twinning nucleation, resulting in enhanced activation stress for twinning.29,33 When pretorsion samples are subjected to compression, the dislocation slip probably transforms from glissile dislocations to sessile dislocations.3,34 Most grains are tilted about few angles along the radius to form new texture, which will lead to texture strengthening.18,35 Therefore, it is possible that both the dislocation and texture strengthening contribute to enhanced YS in pretorsion samples.35,36 As a consequence, the compressive YS of pretorsion samples increases compared with that of the initial extruded sample.
From Fig. 7d, it can be seen that twin occurred in the sample with 300° of pretorsion. In the sample with 400° of pretorsion, thin and lenticular shaped twins appeared obviously, and many twins paralleled to each other in a grain as shown in Fig. 7e. When samples with 300 or 400° of pretorsion are compressed along ED, {10–12} extension twinning and {10–11} contraction twinning will occur in the untwinned matrix and the twined regions, which generated during pretorsion. 36 It is well known that extension twinning in Mg alloys takes place under compression stress perpendicular to the c-axis, and contraction twinning takes place under compression stress parallel to the c-axis.37,38 Therefore, both the twinned regions and the untwinned matrix in pretorsion samples lie in favoured orientations for twinning during compression along ED. The influence of {10–12} twin on microstructure can be summarised as two points: 36 {10–12} twin can cause grain rotation (∼86.3°) affecting activation of slips and twin lamellae subdivide grains, leading to grain refinement. Twin lamellae subdivide the grains, thereby enhancing the activation stress of {10–12} twinning in the untwinned matrix during reloading. Previous studies reported that dislocations may act as barriers to twin nucleation, resulting in enhanced activation stress for twinning.29,33 Once twins are formed, twin boundaries will act as barriers for dislocation slips and become a source of workhardening. 15 Therefore, both dislocation and grain refinement caused by twinning contribute to enhanced YS in pretorsion samples, while the contribution from the two factors are influenced by the strain level of pretorsion. As a consequence, the compressive YS of the samples with 300 or 400° of pretorsion increases when they compared with that of the initial extruded one. Namely, the increase in compressive YS of pretorsion sample is in proportion to the pretorsion angles.
Effect of pretorsion on tensile deformation behaviour
From Fig. 5a, it can be seen that the flow stress–strain curves of the five samples present a typical concave down shape, which is usually found in Mg alloys with {0001} parallel to the loading axis under uniaxial tension or in Mg alloys with {0001} perpendicular to the loading axis under uniaxial compression. 39 There is little fluctuation of the tensile yield strength in the five samples. The tensile YS and the ultimate strength of the extruded Mg alloy AZ31 are ∼230 and ∼370 MPa respectively. The tensile YS is ∼104 MPa higher than the compressive YS (126 MPa).
Compared with the initial sample, tensile stress–strain curves of the pretorsion samples exhibit little change. For the samples subjected to 100 or 200° of pretorsion, the new texture is a little different from the initial extruded specimens, which can be seen from Fig. 10b. That is to say, {0001} plane of most grains is parallel to the tensile axis. In this case, basal < a > slip and {10–12} tension twinning are unfavourable to be activated, while {10–11} contraction twinning, prismatic < a> and pyramidal < a+c> slips can be activated due to their favourable orientations 39 . In this type of texture, basal slip is suppressed under both tensile and compressive loading conditions since there is little or no resolved shear stress on the basal planes. 33 He et al. 3 used XRD to test the texture evolution during tension deformation at different strains. It was reported that no significant reorientation occurred in extruded sample because this process was mainly dominated by slip. For the samples subjected to 100 or 200° of pretorsion, the main deformation mode is dislocation slip. The texture has no obvious change compared with that of the extruded sample as shown in Fig. 10b. Accordingly, the tensile YS of the samples with 100 or 200° of pretorsion practically presents the same value compared with that of the extruded sample. Twinning occurred in the samples with 300 or 400° of pretorsion due to high torsion deformation. The basal planes of most grains in the extruded material are nearly parallel to ED. They are reoriented by 86.3° when the sample is subjected to 300 or 400° of pretorsion deformation. Twins appeared in this condition, as can be seen in Fig. 7d and e, i.e. the basal planes of the twinned regions were nearly perpendicular to ED. If tensile stress is applied along ED, the grain of the twinned regions is favourable for twinning because there is tensile stress along the c-axis, i.e. detwinning will occur in this process, and the crystals will be reoriented by 86.3°. The occurrence of detwinning in the twinned regions caused a decrease in tensile YS for the pretorsion samples. 40 As a consequence, the tensile YS of samples with 300 or 400° of pretorsion is nearly equal to that of the extruded sample as shown in Fig. 5a. It can be concluded that pretorsion deformation has no significant effect on subsequent tension deformation.
Conclusions
In the present paper, microstructure and texture evolution of extruded Mg alloy AZ31 under free end torsion at room temperature were investigated. The effects of free end torsion on subsequent tension and compression in extruded Mg alloy AZ31 were investigated. The major conclusions are summarised as follows.
When sample is subjected to 100 or 200° of pretorsion, the main deformation modes at low shear strain are basal slip and non-basal slips. When sample is subjected to 300 or 400° of pretorsion, {10–12} extension twin is the main deformation mode. The compressive YS of the pretorsion samples increased compared with that of the initial extruded alloy. However, tensile YS of the pretorsion samples is nearly equal to that of the extruded sample. Therefore, the yield asymmetry ratio increases from 0.55 of the extruded sample to 0.84 of the sample subjected to 400° of pretorsion. Finally, it can be concluded that free end torsion can effectively reduce the yield asymmetry of extruded magnesium alloy AZ31.
Acknowledgements
The present work was supported by the Fundamental Research Funds for the Central University (grant no. XDJK2013C106) and in part by the National Natural Science Foundation of China (grant no. 51201140).