
Abstract
The mechanisms involved in the abnormal grain growth of the iron based oxide dispersion strengthened alloys are analysed in the present work. Its microstructural evolution takes place at high temperatures (0.9Tm) and is characterised by an initial submicrometre size microstructure and a strong < 110>|| rolling direction (RD) texture that evolves into a few extremely coarse grains (mm sizes) with < 112>||RD orientation. The analysis of the observed grain boundaries has been completed by molecular dynamics simulations. Microstructure evolution consists of an extended recovery process, followed by an abnormal grain growth stage, consequence of the orientation pinning mechanism and the proximity to a symmetric tilt boundary family between the < 110>||RD and < 112>||RD grains.
Introduction
Recovery, recrystallisation and grain growth in alloys play a central role in metallurgy, being of great technological interest and relevance. The mechanical response of materials can dramatically change by means of different grain structures. Consequently, the thermal or thermomechanical treatments necessary to promote these processes have increasingly become of scientific attention. Their understanding has increased concomitantly with the development of better characterisation techniques and improvement of computational and analytical tools. Despite the deep knowledge of the physical mechanisms controlling these processes, further investigations are still required for its complete description.
This is the case of the exceptional abnormal grain growth behaviour of the mechanically alloyed FeCrAl oxide dispersion strengthened (ODS) alloys. Abnormal grain growth (also named recrystallisation for some authors) occurs at remarkable high temperatures (∼0.9Tm) in ODS alloys 1 in contrast to the large amount of stored energy into the material, induced by the extrusion and hot rolling treatments applied, which should promote this process at lower temperatures.
The microstructure in the as extruded condition of the ODS alloy PM2000 consists of textured [ < 110>|| rolling direction (RD)] fine (∼0.5 μm long) grains of ferrite slightly elongated in the extrusion direction.2–4 After heat treatments at ∼0.9Tm, the resulting microstructure consists of coarse elongated millimetre sized grains with < 112>||RD orientations 2 due to an abnormal grain growth process. This process involves the extreme growth of a very limited amount of grains, which consume the remaining part of the matrix. This enhances creep resistance, since creep deformation occurs by grain boundary sliding; thus, the reduction of grain boundary area increases creep resistance in addition to the high temperature strengthening effects of the oxide dispersion. 5
The increase in the creep resistance at high temperatures, combined with their excellent oxidation and corrosion resistance from Cr and Al additions, makes them good candidates for high temperature heat exchangers, burners and combustion chambers 6 where material properties stability is required. For this reason, the full control and understanding in these alloys is fundamental.
The investigation of the mechanism controlling abnormal grain growth in steels has been continuing for many years7,8 and continues up to now.9–13 Recently, Pimentel et al. 2 suggested that abnormal grain growth in FeCrAl ODS steels can be due to the combination of two phenomena; first, the pinning of the boundaries of grains with a specific orientation ( < 110>||RD) (orientation pinning), and second, the large differences in grain boundary mobility. The first one is substantially triggered by the presence of a strong texture. It implies the pinning of the high angle grain boundaries (HAGBs) of the grains with the preferential orientation. The selective growth of grains with a specific orientation ( < 112>||RD) is combined with their exceptional mobility, providing the conditions for abnormal grain growth.
Nevertheless, the reason why just some of the grains presenting < 112> orientation grow abnormally is unclear, and a dedicated analysis must be carried out. The analysis of the grain boundaries involved in this abnormal process has been made by molecular dynamics (MD) simulation in the present work. Textures showing different experimentally observed behaviours have been used to define the simulated boundaries and describe their different motion response and characteristics. As a result, the combination of textures displaying an abnormal grain growth has been related to the proximity of such boundaries to the < 110> symmetric tilt boundary family. This family showed a special migration behaviour, 14 principally in the vicinities of the singular boundaries, where a special migration mechanism displayed a remarkable migration rate in such boundaries.
Material and experimental method
The material used in the present study was provided by Plansee GmbH. PM2000 is an yttria dispersion strengthened alloy (Fe19Cr5.5Al0.5Y2O3, wt-) manufactured by mechanical alloying as reported elsewhere.3,15–18 The material shows stability of the α phase until melting temperatures, an exceptional oxidation and corrosion resistance, due to the presence of Cr and Al and the formation of a surface alumina scale.19–22
The extruded tubes present an outer diameter of ∼100 mm, a wall thickness of 8 mm and a total length of 1300 mm. Cylindrical samples of ∼10 mm in length and 4 mm in diameter were extracted from the as received material and were subjected to isothermal heat treatments at 1350°C during 6, 10, 20 and 25 min. After heat treatments, both longitudinal and cross-sections of the treated samples were prepared for the study by transmission electron microscopy (TEM), scanning electron microscopy (SEM) and electron backscatter diffraction (EBSD).
Microstructural and microtexture characterisation was performed using a JEOL JSM-6500F field emission scanning electron microscope (FEG-SEM). Characterisation by SEM was carried out operating at 10 keV in the backscattered mode and 7 keV in the secondary mode with a working distance between 6 and 10 mm. Electron backscatter diffraction patterns were collected at different locations on longitudinal sections carefully polished with colloidal silica (50 nm particle size) in the final stage. 23 The EBSD patterns were generated at an acceleration voltage of 20 kV and collected using a CRYSTAL detector of Oxford Instruments. The Kikuchi patterns were indexed and the orientations determined using CHANNEL 5 software.
Examination by TEM was performed in a JEOL JEM-200 CX transmission electron microscope operating at 200 keV. Cylindrical samples 3 mm in diameter were cut with a diameter parallel to extrusion direction and mechanically thinned to thickness < 100 μm. From these discs, TEM samples were electropolished in a Struers Tenupol 5 using 5 perchloric, 15 glycerol and 80 ethanol as electrolyte, at 267 K with an applied voltage of 20 V.
Experimental results
The microstructure in the as received state consisted in elongated grains across the RD with a high grain aspect ratio as observed in Fig. 1a. The submicrometre sized grains are subdivided by low angle grain boundaries (LAGBs) and present a preferential < 110>||RD texture as shown in Fig. 1b. As described above, the microstructural evolution of PM2000 alloy at 1350°C consists of two well defined stages: extended recovery and abnormal grain growth. 2 During the first stage, the evolution of which is shown at 0, 6 and 15 min in Fig. 2a–c, the alloy undergoes an extended recovery process. Initially, there is a geometrical change in the grain morphology from elongated to equiaxial. Nucleation events of new grains is not observed, and microstructure evolves by subgrain growth. No significant change in material texture during subgrain growth occurred, but a strengthening of the strong texture ( < 110>||RD) is observed, as seen in the inverse pole figure shown in Fig. 2a–c. This figure shows the contour maps and section φ 2 = 45° of the oriented distribution function.
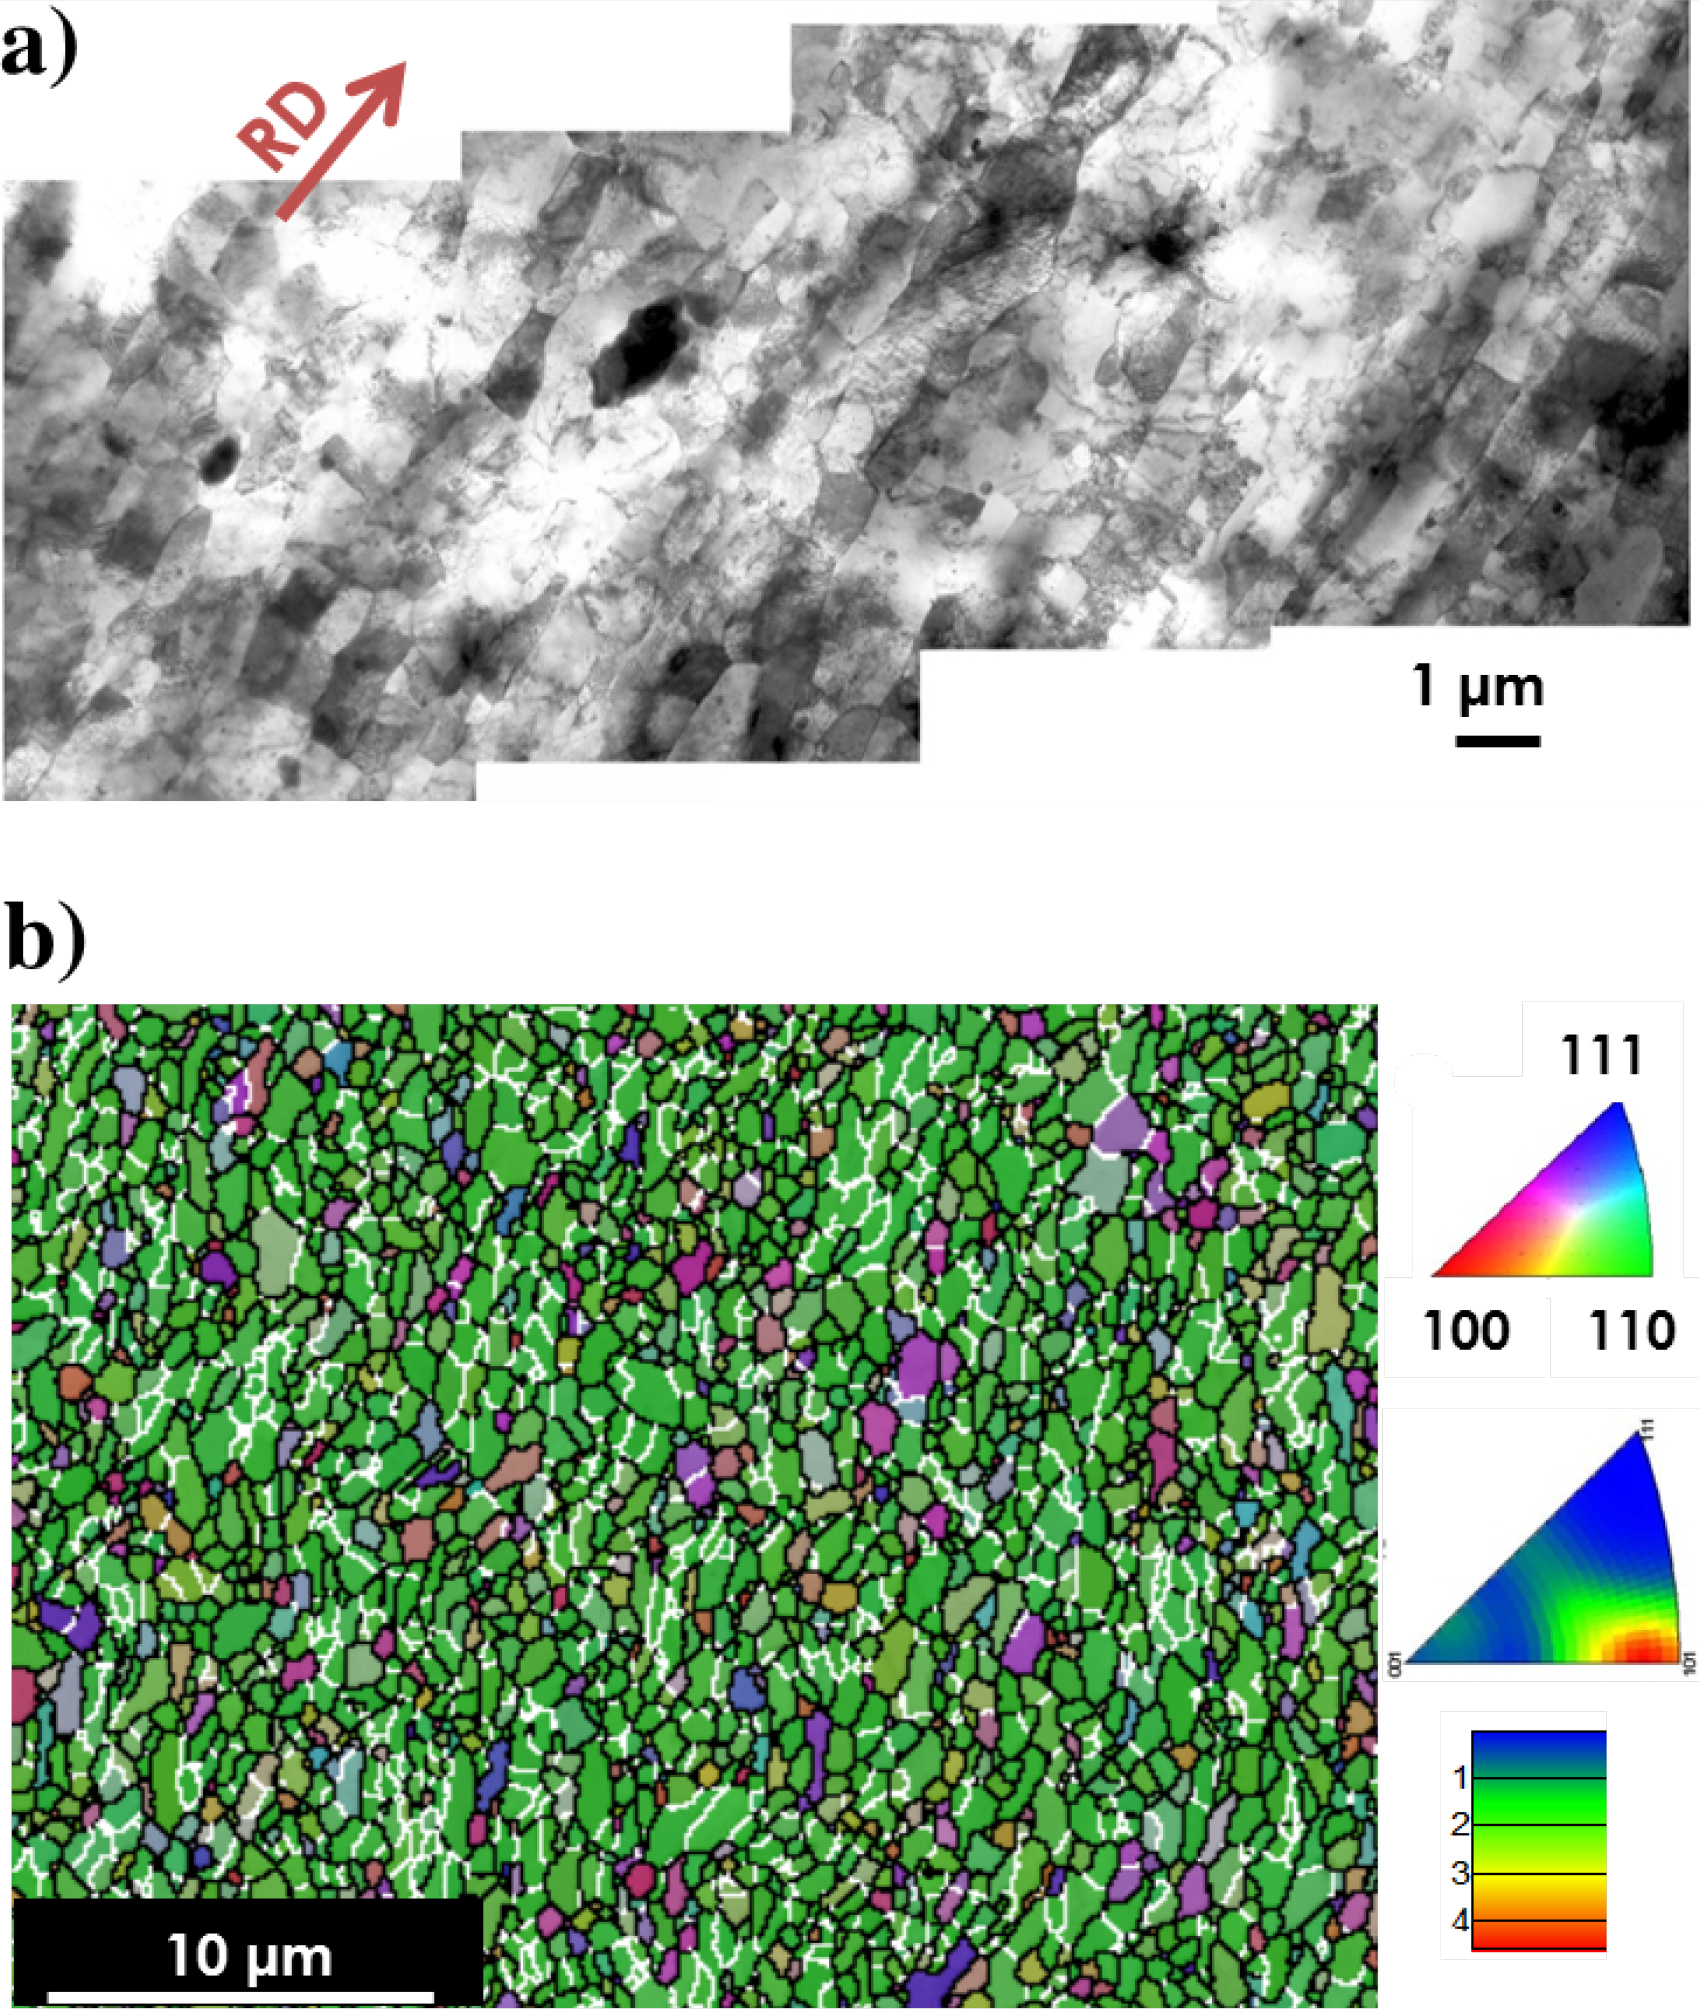
As received condition: a image (TEM) of wide view of microstructure in longitudinal section, red arrow indicates rolling direction; b inverse pole figure (IPF) map with HAGB ( < 15°) in black and LAGB (4–14°) in white and contoured IPF representing orientation frequency of transverse section
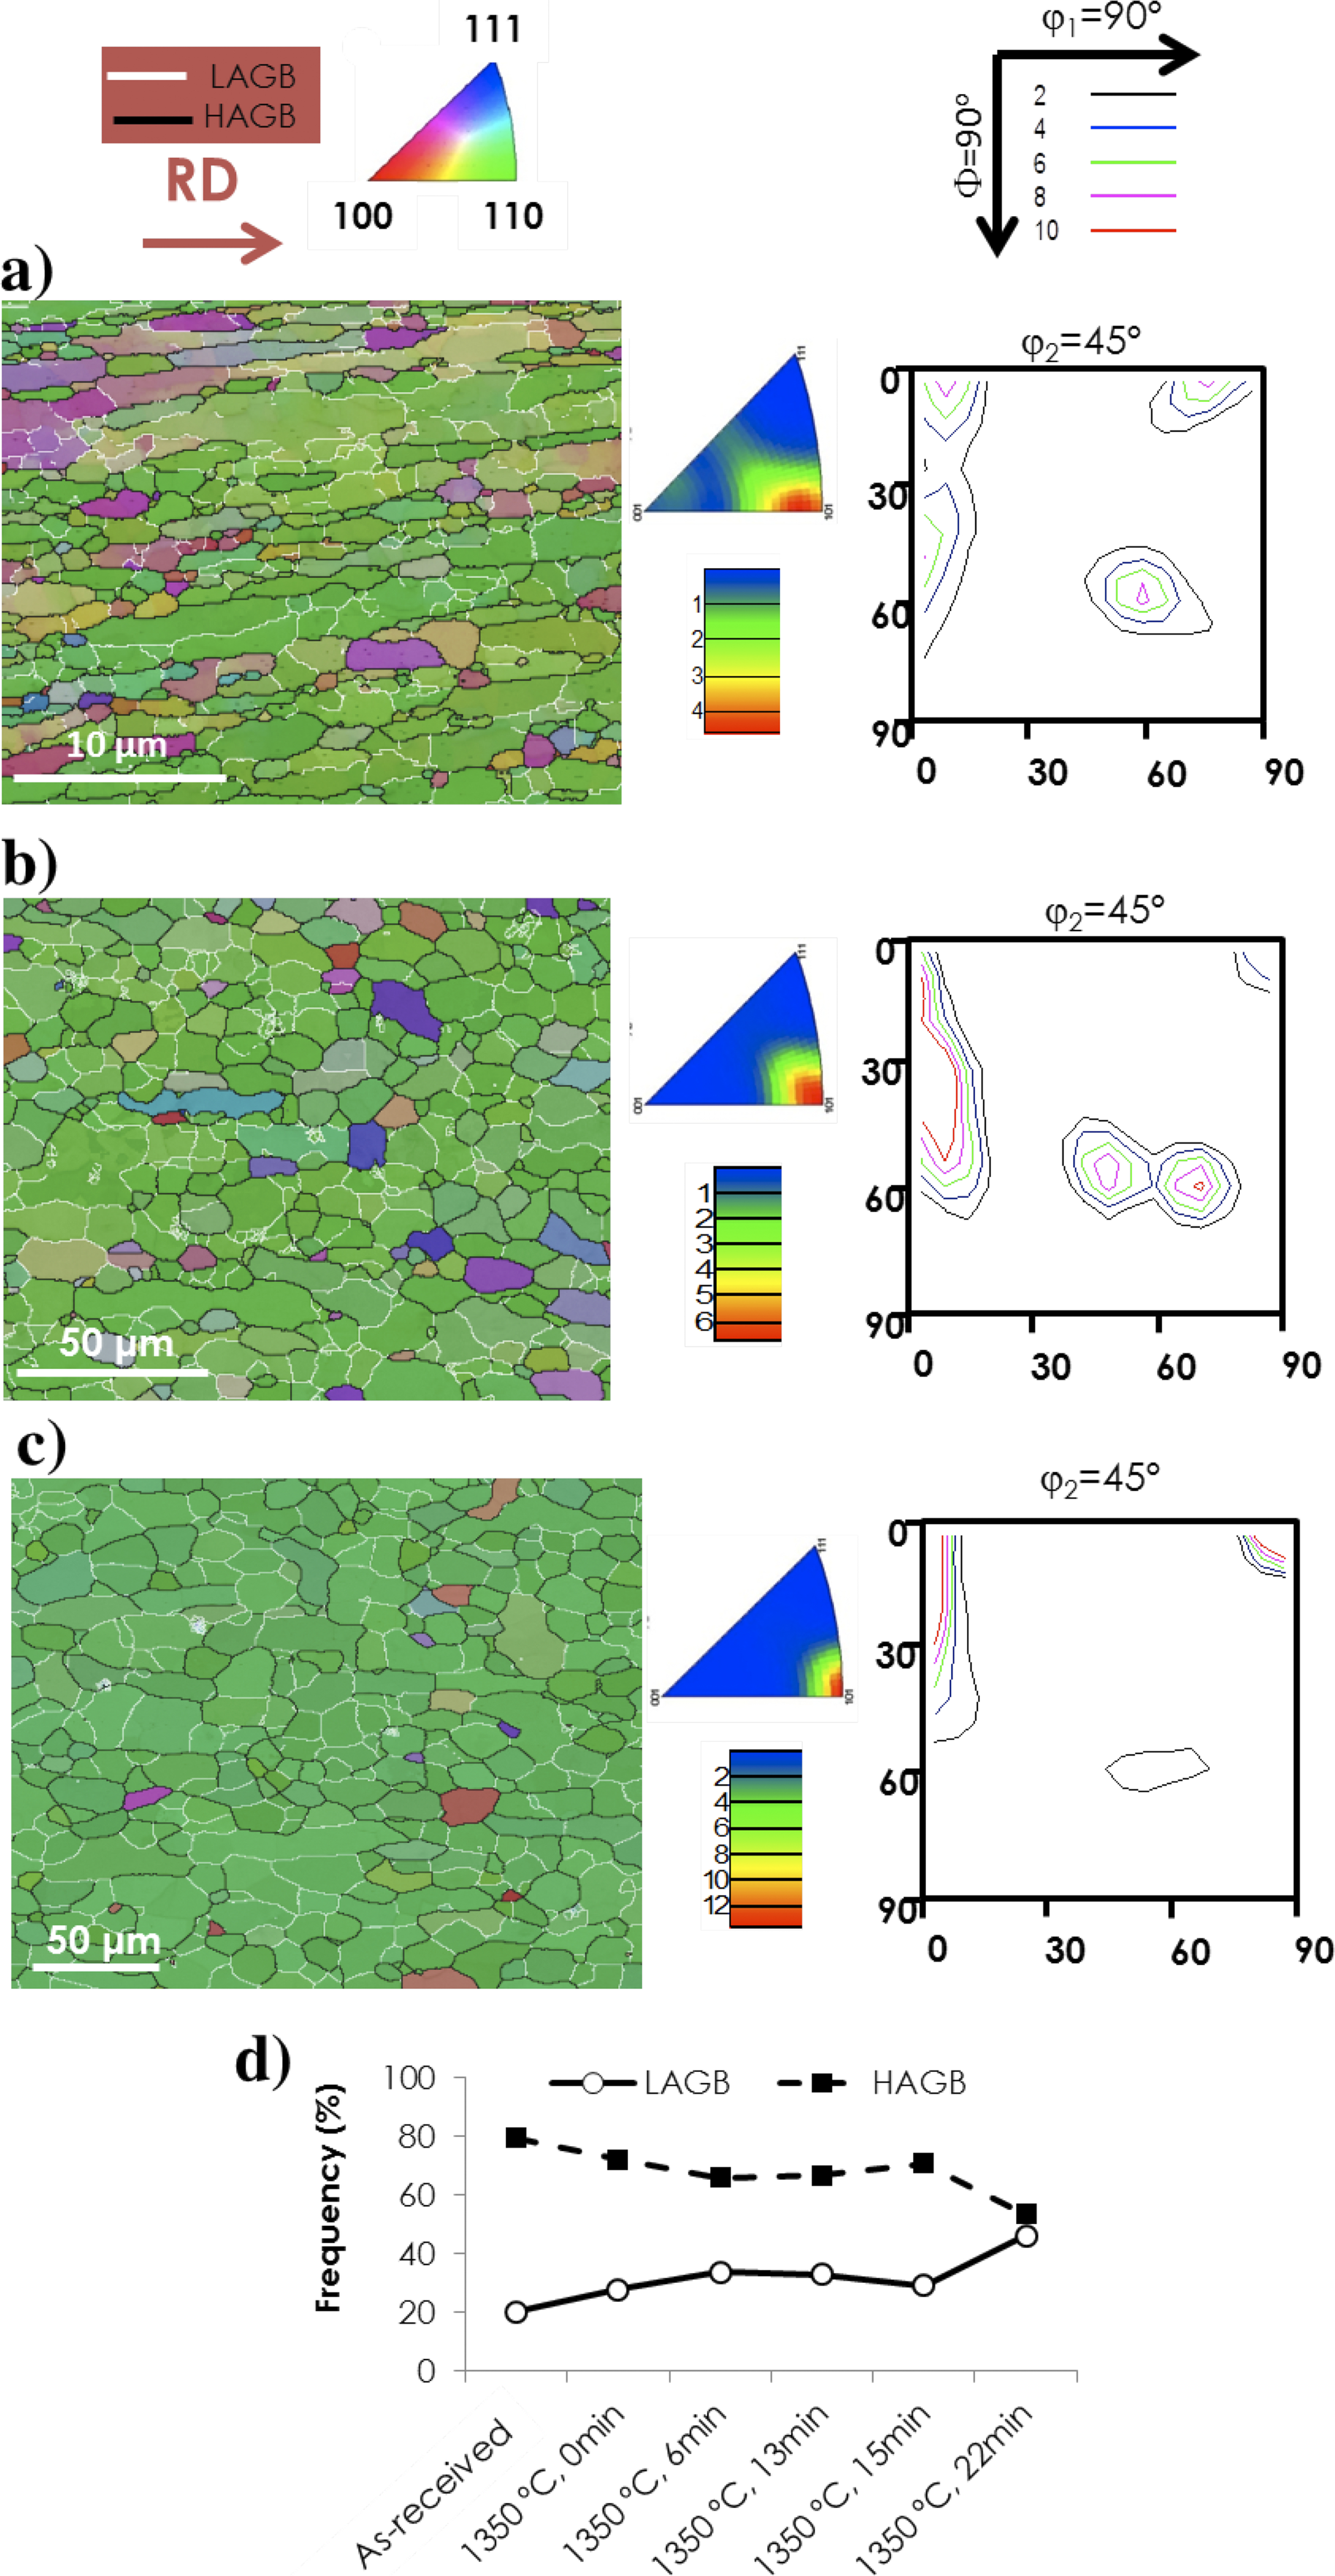
Inverse pole figure map with HAGBs ( < 15°) in black and LAGBs (4–14°) in white, contoured IPF and oriented distribution function (section φ2 = 45°) of longitudinal section after 1350°C annealing for a 0 min, b 6 min and c 15 min and d LAGBs and HAGBs frequency evolution during the extended recovery stage and before abnormal grain growth
Since there is no nucleation stage and the strong texture remains the same, the subgrain growth could be due to either subgrain coalescence or subgrain rotation. Figure 2d indicates that LAGBs not only remain in the microstructure but also their frequency increases with time, which is unexpected for a recovery process. This fact leads to the assumption that coarsening is due to subgrain rotation, as coalescence would imply a decrease in LAGBs frequency with time.
On the other hand, the particles located at the HAGBs, as shown in Fig. 3, impede the movement of the boundaries by the well known Zener particle pinning effect. 24 In addition to that, particle coarsening during the process occurs due to the Ostwald ripening mechanism 25 promoting the unpinning of the HAGBs. After 25 min of heat treatment, the microstructure evolve into coarse millimetre sized grains, present in the initial microstructure,with < 112>||RD orientations as seen in Fig. 4a (second stage of the microstructural evolution) leading to the abnormal grain growth. The rapid kinetic observed occurs as a combination of a recovery stage, 26 a high temperature of the heat treatments 27 and a high grain boundary mobility. 28
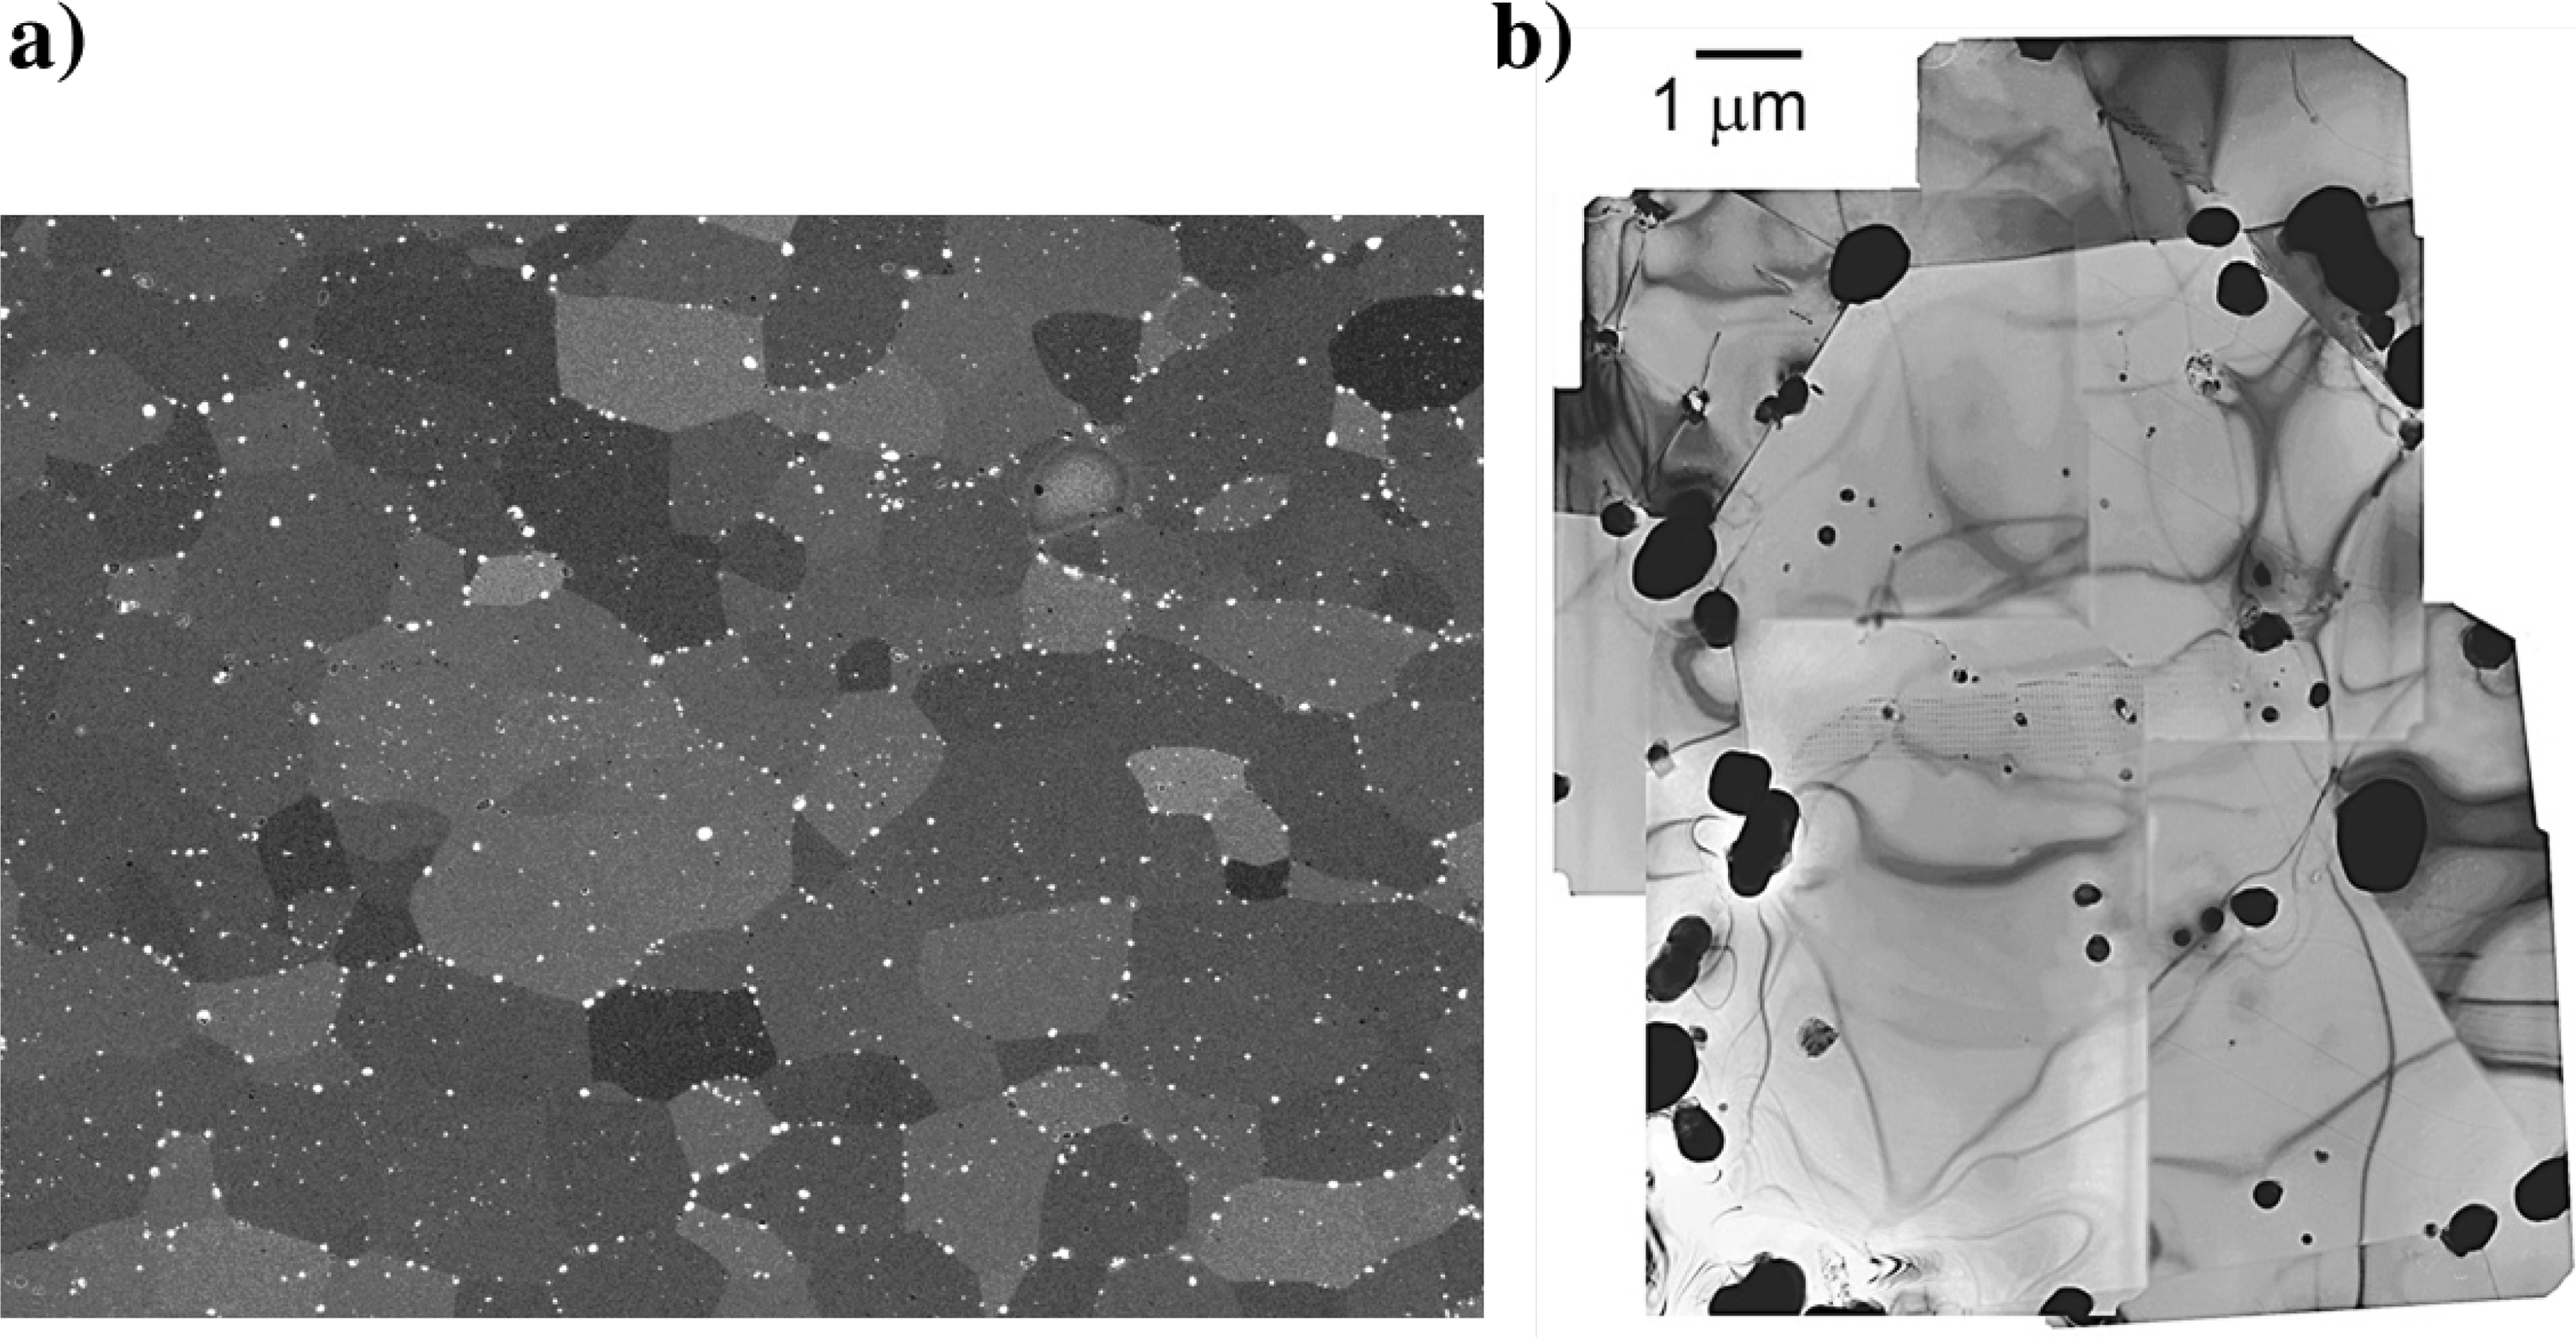
Oxide distribution after annealing at 1350°C for 10 min: a image (BS SEM) indicating grain boundary decoration by oxide particles, b TEM image indicating detail of one grain
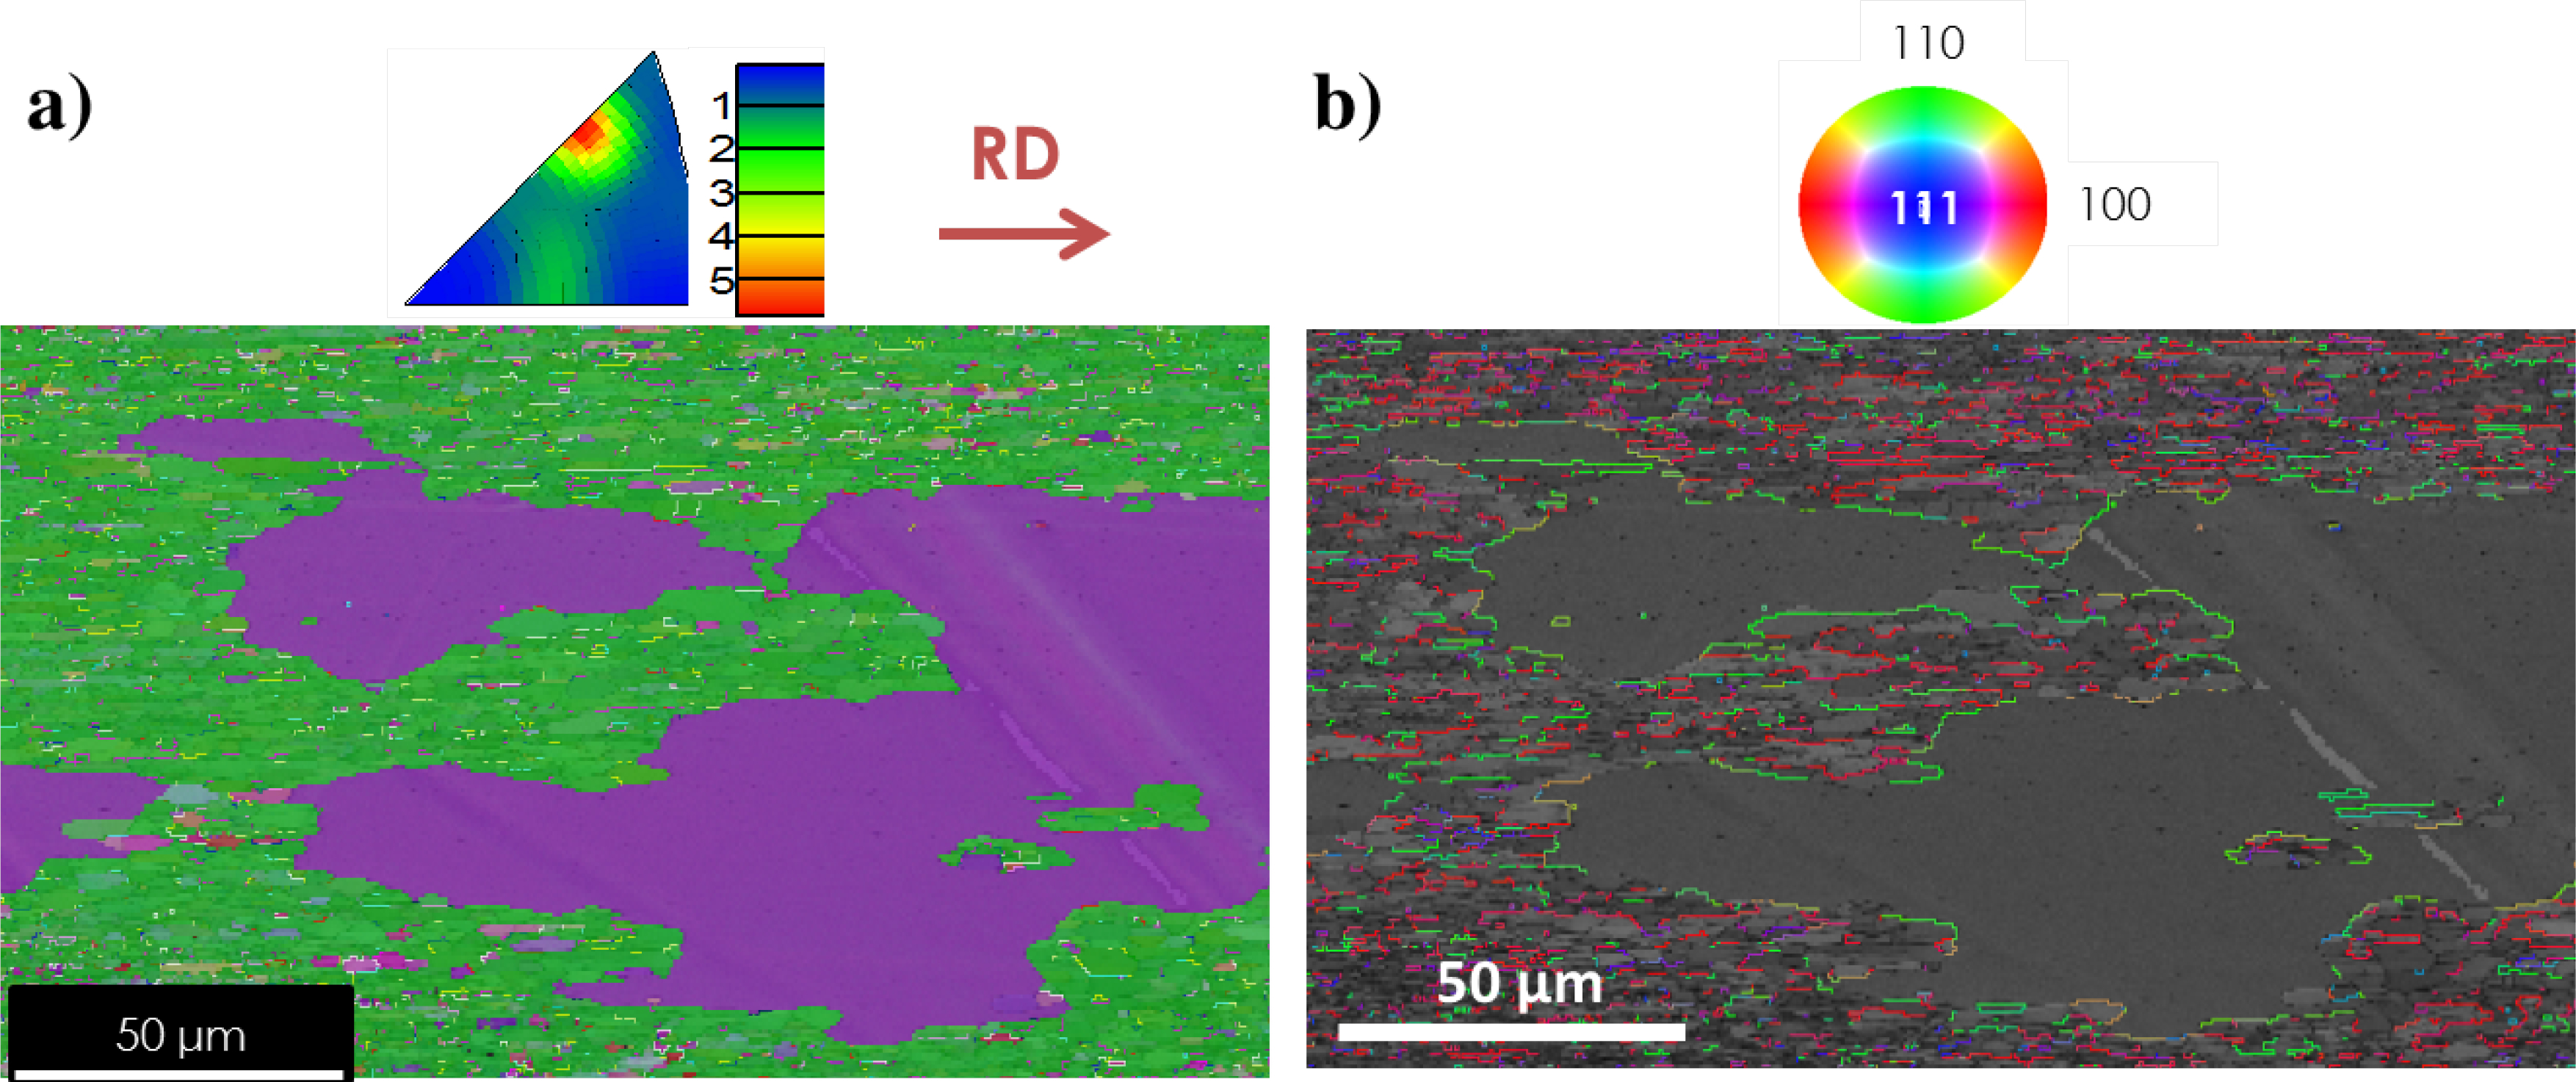
Initial stages of abnormal grain growth: a inverse pole figure map and contoured IPF; b EBSD map highlighting boundaries with specific tilt axis
The lack of new grains, combined with the intensification of < 110>||RD texture due to subgrain rotation, and the increase in the frequency of LAGBs, allows us to conclude that the mechanism taking place during the extended recovery stage is the so called ‘orientation pinning’. This mechanism was first introduced by Jensen 29 and has been used to explain the dominance of grains with a preferred orientation relationship. The microstructure will evolve in such a way that the HAGBs between grains with similar orientation can become LAGBs due to subgrain rotation, increasing in this way the frequency of LAGBs, 30 which display lower mobilities than HAGBs. The orientation pinning mechanism implies local pinning of the boundaries of grains with the strong texture ( < 110>||RD). Consequently, the HAGBs of the weak texture grains ( < 112>||RD) will not suffer this pinning since they are not surrounded by neighbours with the same orientation, and their boundaries will not become LAGBs, providing the seeds for the abnormal grain growth. Since particles are coarsening during the process, the Zener pinning effect decreases, promoting the fast evolution of grains showing high mobility. However, as it is observed from Fig. 4a, only some of the grains, which are not pinned by this mechanism, grow consuming the remaining matrix. Figure 4b highlights the distribution of HAGBs and the corresponding tilt axis. As observed, the abnormal grain growth of the < 112>||RD texture grains is more common for the < 110> tilt axis (in green) than in the < 100> (in red) and < 111> (in blue). It can be anticipated that a set of special boundaries with extraordinary high mobility exist with such tilt axis, facilitating the process of abnormal grain growth. This is analysed by atomistic simulations in the next section.
Grain boundary simulations and analysis
Molecular dynamics has been widely applied to model and understand grain boundary structure and migration (for an overview, see Mishin et al.). 31 There is a special difficulty on measuring mobility from atomistic simulations due to its complexity and the scale at which this parameter works.
The simulation considered here is a cylindrical boundary, where the driving force is the free energy difference across the boundary, which arises naturally from the boundary curvature. A realistic value of the mobility cannot be extracted from curved simulations, but an averaged value of all boundaries across the curved boundary can be considered instead.14,32–37 The reduced curvature in the simulation compared to real boundaries induces a problem of scalability of the obtained results. In spite of these obstacles, a large amount of information can be extracted from atomistic simulations. The analysis carried out in the present paper aims at identifying the fundamental differences between the variety of grain boundaries found in the ODS alloys and helps in the understanding of the remarkable grain growth behaviour. The simulations will compare boundaries separating < 110> versus < 110> and < 110> versus < 112> grain orientations. The orientations will be extracted from adjacent grains from EBSD data, so that the simulated boundaries will not be an idealised family of boundaries, but experimentally observed ones.
Simulation method
A classical embedded atom (Embedded Atom Method (EAM)) description of the interatomic forces was used in the form of Finnis–Sinclair potentials, 38 allowing simulations on a sufficiently large length and timescale. The EAM potentials have been used successfully in previous studies to model point defects, impurities, surfaces and grain boundary motion.37,39–41
The composition of the simulation is an Fe–20Cr alloy in a bcc solid solution, very close to the experimental alloy composition. The interaction parameters for the Fe–Fe and Cr–Cr atom pairs are taken from Finnis and Sinclair38,42 and are appropriate for the bcc structure. The Fe–Cr interaction parameters have been computed using the Lorentz–Berthelot mixing rule, 43 the application to EAM potentials of which is described in Shibuta et al. 44
The calculations were performed using the DL_POLY molecular simulation package 45 with an NPT Berendsen thermostat. The model set-up consists of a bicrystal whose boundary lies in the surface generated by a cylinder, with its main axis normal to the RD and transverse direction. In this way, the pressure on the boundary will act in the same plane where the abnormal grain growth is detected. Then, the possible features observed in the simulation will correspond to the boundaries involved in the abnormal grain growth. The geometry is shown in a graphical representation in Fig. 5 with the approximate measures of the simulating box, where the boundary corresponds to the curved surface of the cylinder. The number of atoms is around 300 000–400 000 depending on the boundary simulated.
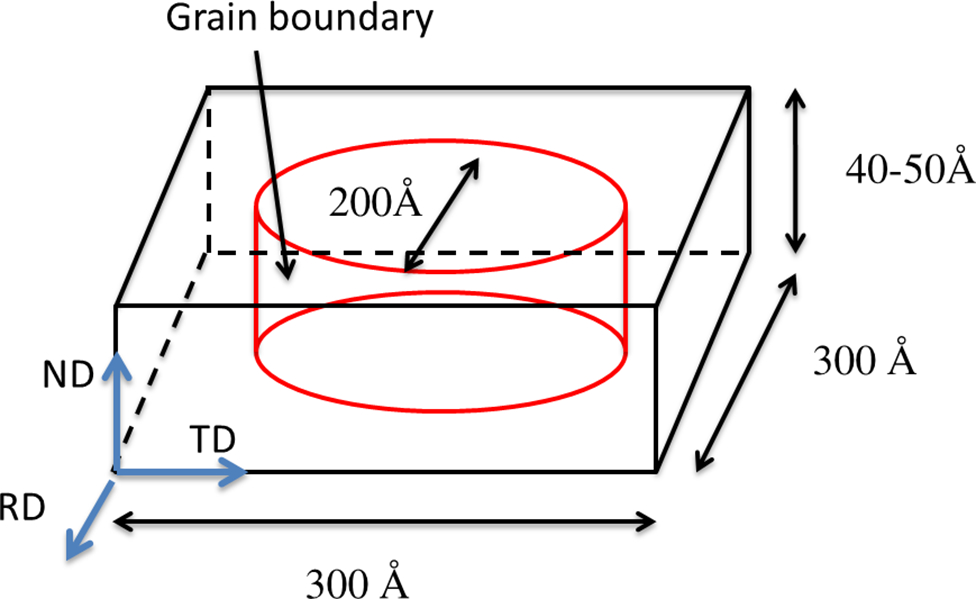
Graphical representation of geometry used for MD simulations; red cylinder stands for boundary separating both orientations
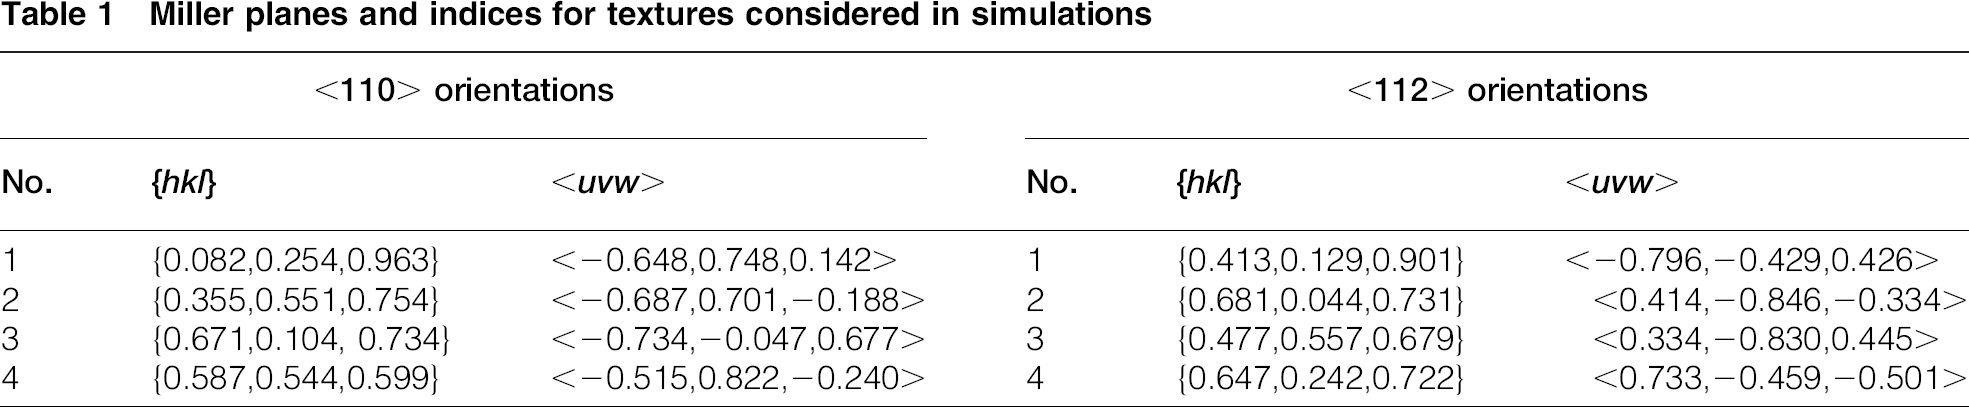
This geometry has been applied to generate different misorientations, with some orientations extracted from EBSD maps, as shown in Table 1.
Miller planes and indices for textures considered in simulations
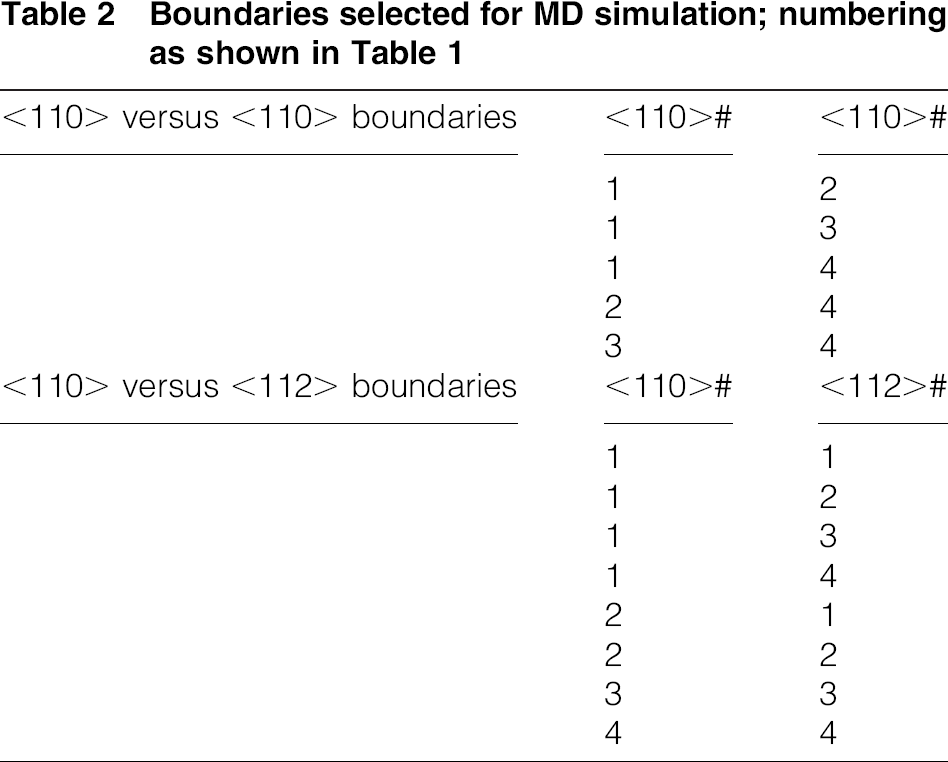
This permits six combinations of < 110> versus < 110> orientations and 16 combinations of < 110> versus < 112>. Nevertheless, the mandatory periodic boundary conditions necessary in the simulation make it difficult to find periodicities in both real textures in the same simulating box. A numerical optimisation has been applied to modify the orientations with maximum deviations of 2° with respect to its original definition in Table 1, which enables the periodic boundary conditions. In addition to this, different possible random configurations and displacements of one of the two crystals with respect to the other along the three coordinate axes are computed until a prerelaxed configuration is obtained, which is energetically favourable. Thirteen suitable solutions have been found and are shown in Table 2.
Boundaries selected for MD simulation; numbering as shown in Table 1
The simulations have been run for 1000 ps at 0.9 of the melting temperature, similar to the experimental temperature, allowing the movement of the boundary towards the centre. This permits the presence of the moving steady state boundaries, which could be different to static flat boundaries.
Results of the MD simulations
The results of the simulations are shown in Fig. 6 in terms of the hydrostatic pressure calculated on each atom, which describes the distribution of the pressure applied in the boundary. 46 Atoms in tension will display positive values, plotted in red colour, while atoms in compression correspond to negative values of pressure, displayed in blue colour. Atoms not located in the boundary display almost null values and are not displayed in order to clearly show the distribution of stresses across the boundary.
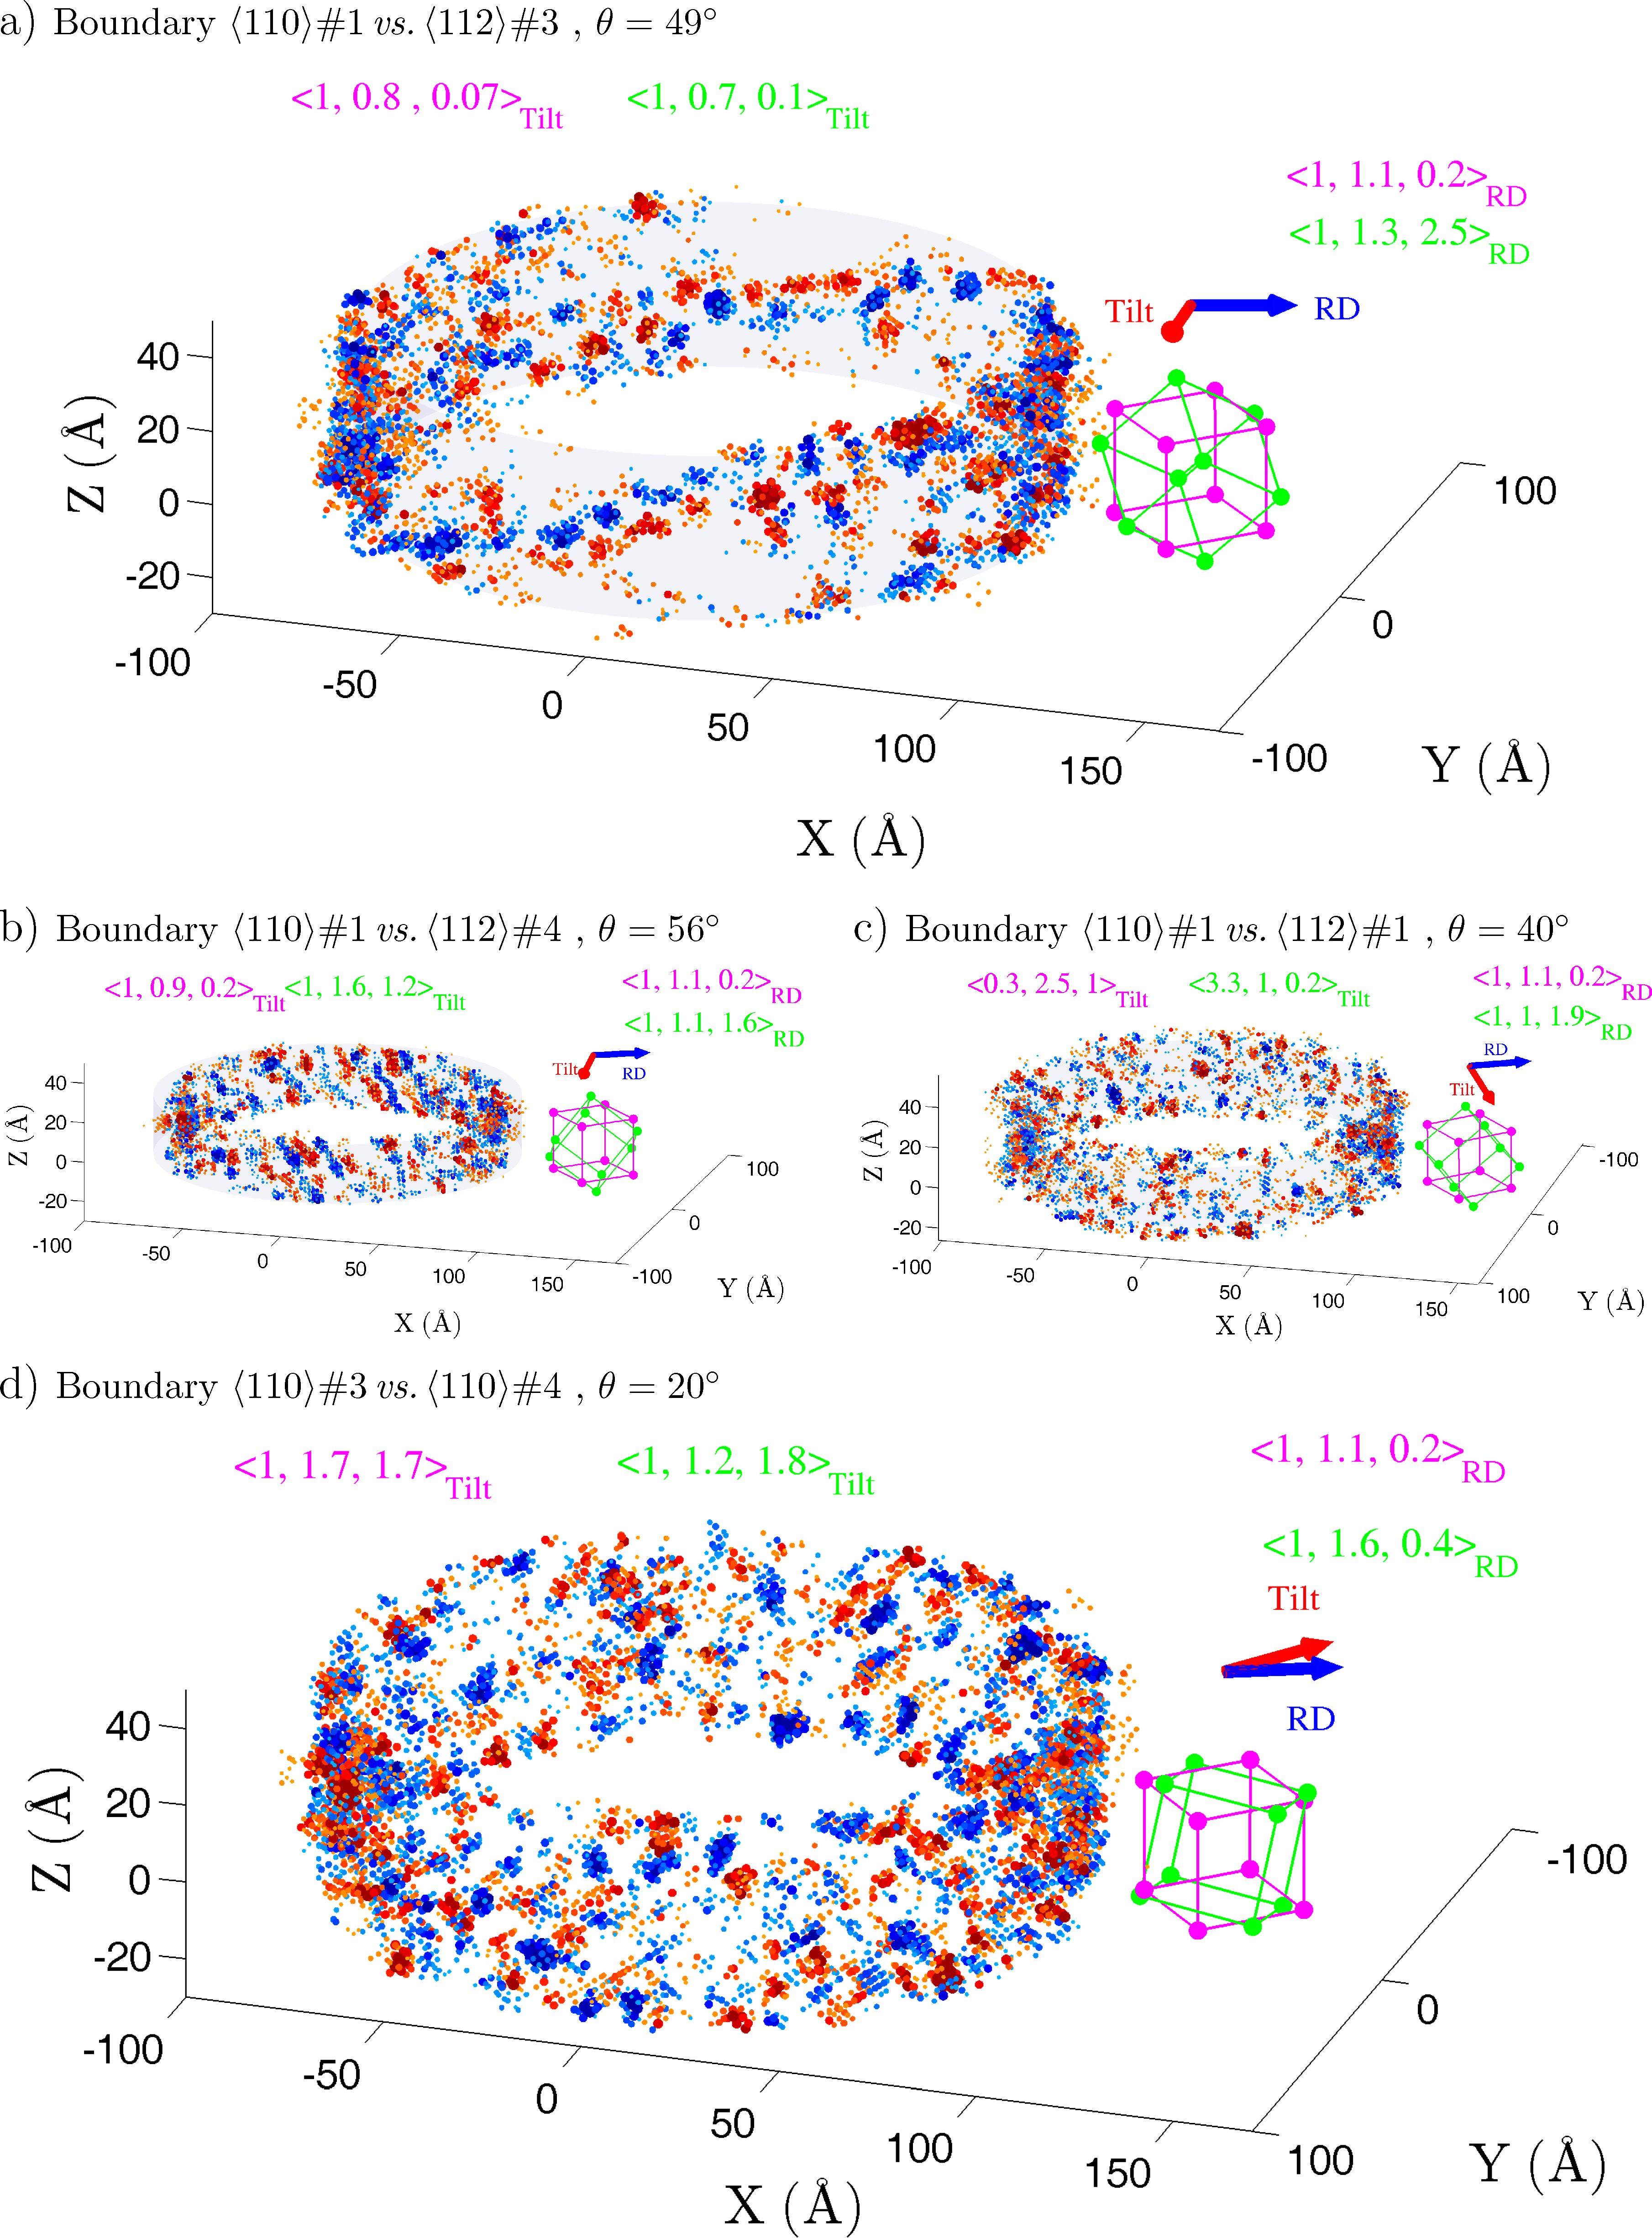
Simulated grain boundaries represented in terms of hydrostatic pressure on each atom (red atoms in tension with positive pressure and blue atoms in compression with negative pressure): both orientations are displayed by reference cubic system (magenta outside cylinder, green inside the cylinder); rolling direction (RD) and tilt axis are expressed in respective cubic reference system with its corresponding colour
Fig. 6a shows the simulated boundary created by the orientations < 110>#1 and < 112>#3, where < 110>#1 has been plotted by a representation of the reference unit cube in magenta, while in < 112>#3, it corresponds to the reference unit cube in green. The distribution of stresses along axis Y is homogeneously distributed, where positive and negative pressures are disordered. This is a common feature on non-singular HAGBs, where the energy, and consequently the pressure, follows this uniformly randomised pattern. On the other hand, the distribution of stresses along the X axis follows a well defined pattern. A sequence of negative pressures is located next and in parallel to a sequence of positive pressures, which, at the same time, both are surrounded by a large region of unstressed atoms. This indicates the existence of a close singular boundary. This can be analysed in terms of the relationship between both orientations.
The RD is indicated with a blue arrow. This direction can be expressed in the reference frame defined by the unit cubes, i.e. the respective orientations of < 110>#1 and < 112>#3 orientations. The obtained values are indicated in the figure, being < 1, 1.1 and 0.2>RD for < 110>#1 and < 1, 1.3 and 2.5>RD for < 112>#3. On the other hand, the tilt axis between both orientations, displayed with a red arrow, is also indicated in the figure, expressed in the respective orientation cubic reference frames. These are < 1, 0.8 and 0.07>Tilt for the < 110>#1 orientation and < 1, 0.7 and 0.1> for the orientation < 112>#3. Both tilt axes are very close to < 110>, which implies that both orientations produce a boundary very close to a < 110> symmetric tilt boundary. This corresponds to the boundaries shown in green in Fig. 4b, which are related to the abnormal grain growth.
This family of symmetric tilt boundaries has been analysed by the authors in Ref. 14 where a surprising migration behaviour of the singular boundaries, especially Σ3 boundaries (following CSL nomenclature), was observed. The boundary 109.5° (112) Σ3 coherent twist boundary displays a pattern made of a special arrangement of atomic positions between both orientations, which provides extremely low grain boundary energy (∼0.3 J m− 2). The migration mechanism of this boundary is characterised by repeated shuffle sequence on the (112) planes. Its migration velocity is orders of magnitude higher than the incoherent boundaries. Especially remarkable is the behaviour of boundaries close to this Σ3 boundary, as 115.5° < 449> Σ113 and 102.1° < 447> Σ81 boundaries. Secondary dislocations separated by coherent segments of Σ3 boundary were observed in these boundaries. The boundaries migrate by an uncorrelated shuffle mechanism at the secondary dislocations mixed with a repeated shuffle sequence between dislocations, as Σ3 boundary showed. The migration velocity of these boundaries was lower than that of the Σ3 but still much higher than others in the family. This indicates the strong influence over close boundaries of the singular boundaries of this symmetric tilt family.
The boundary simulated shown in Fig. 6a shows the same pattern as 115.5° < 449> Σ113 boundary and 102.1° < 447> Σ81 boundaries in Ref. 14, close to the singular Σ3. The large region of unstressed atoms in Fig. 6a corresponds to atoms displaying low energy, suggesting proximity to the singular coherent Σ3. The sequence of negative and positive pressures corresponds to secondary dislocations. It could then be expected a much higher migration velocity than other boundaries characterised in the material.
A similar behaviour is found between < 110>#1 and < 112>#4 orientations in Fig. 6b. The secondary dislocations are closer to each other, but the pattern is similar. Thus, a common set of boundaries, close to singular symmetric tilt boundaries, is found between < 110> and < 112> orientations. Not all boundaries generated by textures < 110> and < 112> are close to singular boundaries. Figure 6c shows < 110>#1 versus < 112>#1, where a more randomised pattern is observed. The tilt vector is not < 110> in both cubic reference system; thus, this boundary is not close to the < 110> symmetric tilt boundary. Half of the < 110> versus < 112> boundaries analysed ( < 110>#1 versus < 112>#3, < 110>#1 versus < 112>#4, < 110>2# versus < 112>#1, < 110>#4 versus < 112>#4) display the described close to singular pattern. The other half shows the structures proper of common boundaries.
The boundaries separating two < 110>orientations do not show any special or remarkable behaviour. Neither the tilt axes were close to < 110> in any of the < 110> versus < 110> cases. A sample of this behaviour can be observed in Fig. 6d, whose pattern is similar to the pattern in Fig. 6c, the < 110> versus < 112> orientation showing no special pattern.
Discussion
As it can be observed from the experimental results, the microstructure evolution at 1350°C in the PM2000 could be differentiated by two subsequent stages: extended recovery and abnormal grain growth. The first one is featured by a geometrical change in grain morphology, no nucleation stage and no significant change in material texture. The presence of a preferential and strong texture in the as received microstructure ( < 110‖RD>), which strengthened during the process, and the consequent increase the percentage of LAGBs due to subgrain rotation are responsible for the orientation pinning mechanism that takes place during the extended recovery stage (Fig. 2). It implies the local pinning of the HAGBs of the grains with the strong texture and higher HAGBs rates of the grains with the weak texture ( < 112>‖RD). However, the orientation pinning mechanism could not explain totally the abnormal grain growth since only grains presenting the < 112> orientation and a specific tilt axis ( < 110>) with their < 110> oriented neighbours (Fig. 4)undergo abnormal growth.
This question is answered by the performed MD simulations, which have been able to identify the special features in the grain boundaries showing abnormal growth. This simulations have shown the presence of singular boundaries between < 110> and < 112> oriented grains. The distribution of stresses in these boundaries follows a well defined pattern. A sequence of negative pressures is located next and in parallel to a sequence of positive pressures. Similar boundaries have shown a surprisingly migration behaviour in previous works. 14 Their migration velocity can be orders of magnitude higher than that of the other boundaries due to its specific < 110>tilt axis.
The abnormal grain growth can be now explained. A < 112> oriented grain (displaying the explained remarkable characteristic) will grow at the expense of a variety of < 110> grains, as long as the combination of tilt axes of the < 110> grains along < 112> way keeps close to symmetric < 110> family. On the other hand, a < 110> grain could grow at the expense of a < 112>, but it will be immediately stopped, since it will encounter rapidly other < 110>, as the < 112> grains are very occasional. Thus, the < 110> grains have no opportunity to display abnormal grain growth.
Conclusions
The combination of experimental results and MD simulations of the abnormal grain growth in the PM2000 alloy allow us to conclude the following.
Two subsequent stages characterised the microstructure evolution from the as received condition: extended recovery and abnormal grain growth. During the extended recovery, in a matrix characterised by a strong texture ( < 110>||RD), HAGBs of the < 110> grains become LAGBs (less velocity) owing to the subgrain rotation causing the pinning of the boundaries (orientation pinning mechanism). Grains, present in the as received state, with weak texture ( < 112>||RD) will not suffer the orientation pinning and will be the seeds for the abnormal grain growth. Only grains with orientation < 112>||RD (which are not pinned by their orientation)and a close symmetric tilt boundary family < 110> present abnormal grain growth due to their extremely higher velocity.
Acknowledgement
PM 2000 is a trademark of Plansee GmbH Inc. CC and GP acknowledge the Ministry of Economy and Competitiveness (MINECO) for the financial support through the National project no. ENE2009-13766-C04-01. GP acknowledges the MINECO for supporting her research under a FPI Grant (grant no. BES-2010-032747). The use of the computational facilities provided by CTI (Trueno cluster) is also gratefully acknowledged.