
Abstract
In the present paper, micro-grooved Ti3SiC2 surfaces with different roughness were fabricated by pulsed laser processing. The surface topography and chemical composition of smooth and micro-grooved surfaces were characterised. The wetting behaviours of smooth and micro-grooved Ti3SiC2 surfaces such as static contact angle, anisotropic wettability and contact angle evolution versus time were investigated. The experimental results show that micro-grooved structures can be efficiently fabricated on Ti3SiC2 surface by laser processing. The contact angle of micro-grooved surface was increased by 64.2° compared with that of smooth surface. The difference values of contact angles between perpendicular and parallel direction were < 10°. The wetting state of droplet on textured surface was close to Cassie–Baxter model.
Introduction
Ti3SiC2 is one typical member of MAX phases, which exhibits both ceramic and metal merits such as light weight, good electrical and thermal conductivities, low hardness, easy machinability, thermal shock resistance, and high modulus.1,2 It has also been considered as a good substitute for solid lubricant graphite due to its comparable self-lubrication, low friction coefficient and thermostability. 3 The tribological behaviour of Ti3SiC2 under dry and water lubricated environment had been investigated by Hibi et al. 4 It had been proved that the friction and wear under water condition were less than the ones under dry condition. This means that water lubrication may reduce the friction and wear of Ti3SiC2. It was reported that a hydrophobic surface had a positive effect on the friction reduction in aqueous lubrication due to the relatively low surface energy effect. 5 Therefore, it can be deduced that the tribological performance of Ti3SiC2 can be enhanced by improving the hydrophobicity of material surface. However, the water wetting behaviour of Ti3SiC2 has not yet been investigated systematically.
The chemical surface modification and surface texturing were employed to achieve hydrophobic surface.6,7 For instance, Sui et al. 7 prepared Ti3SiC2 bulk with highly graphitised carbon coating by chemical surface modification. They announced that the carbon coating with a highly porous microstructure exhibited superhydrophobic property and greatly reduced friction coefficient of Ti3SiC2. Surface texturing can improve the hydrophobicity of surface by texturing different microstructure/nanostructure on the material surface. 8
Many advanced processing techniques had been applied to surface texturing, including laser processing, etching and microgrinding.9–11 In recent years, laser surface texturing has attracted extensive interests due to its high processing efficiency and low cost. For example, the laser texturing method was used to process the microsquared convex on the surface of silicon carbide, 11 resulting in an increase in contact angle from 89.8° to 119°. Cardoso et al. 12 fabricated a superhydrophobic polymeric surfaces with square shaped pillars topographies using picosecond Nd:YAG laser, which made the contact angles higher than 150°. The research results revealed that the effect of laser textured surface on contact angle conformed to the Cassie–Baxter model. The laser gas treatment was employed to process zirconia surface with a carbon film covering, 13 which evidently improved the hydrophobicity of surface and increased the average contact angle from 62° to 130°.
The Wenzel and Cassie–Baxter wetting models with regard to the relationship between contact angle and surface topography were proposed.14,15 The Wenzel model was based on the assumption of non-composite wetting state, namely, the droplet could completely wet the liquid/solid interface. The Cassie–Baxter model was based on the assumption of composite wetting state, namely, the droplet cannot penetrate into the groove on the rough surface, resulting in the combination of liquid–solid contact and liquid–gas contact.
In the present paper, water wetting behaviours of smooth and laser textured Ti3SiC2 surfaces were investigated systematically. The objective was to improve the hydrophobicity of material surface. First, the pulsed laser processing was employed to fabricate micro-grooved structures on smooth Ti3SiC2 surface. Then, the wetting behaviours including static contact angle, anisotropic wettability and contact angle evolution versus time were investigated. Finally, the wetting state of droplet on textured surface was analysed. The topographies of textured surfaces were characterised by scanning electron microscope (SEM) and white light interferometer (WLI). Chemical compositions of material surfaces before and after laser processing were measured by energy dispersive X-ray spectroscopy (EDX) and X-ray diffraction (XRD). The sessile droplet method was employed to detect the water contact angles of smooth and micro-grooved surfaces.
Experiments
Preparation of Ti3SiC2 bulk
The commercially available powders of Ti (99.9 wt-% pure, − 325 mesh), Si (99.8 wt-% pure, − 200 mesh) and graphite (99.9 wt-% pure, − 500 mesh) were weighted according to molar ratio of Ti/Si/C = 3:1.1:2, 16 and then mixed in V type mixer for 24 h. The mixed powders were pressed in a steel mould with a pressure of 100 MPa to form compacts with 20 mm in diameter. These green compacts were heated to 800°C with a heating rate of 10°C min− 1 in a vacuum furnace and subsequently heated to 1500°C with a heating rate of 5°C min− 1. Finally, the prepared bulks were crushed into 300 mesh powders.
The Ti3SiC2 powders were compacted into a graphite mould (20 mm in diameter) and sintered at 1400°C in vacuum (1 × 10− 4 Pa) by spark plasma sintering. The heating rate was 100°C min− 1, the pressure was 50 MPa and the soaking time was 15 min during sintering. Then, the bulks were cut into specimens of 6 × 6 × 10 mm and polished by 3000 mesh sandpaper.
Laser processing
First, the as prepared Ti3SiC2 surfaces were ground and polished to produce smooth surfaces with a surface roughness of 0.3 μm. Then, the microstructures were machined on the smooth surfaces using CLS8100 high precision CNC YAG laser marking set-up. Figure 1 shows the experimental set-up of laser processing. As shown in Fig. 1a, the workpiece was fixed on the horizontal worktable. The laser was sent out from the diode pumped pulsed Nd:YAG laser. The laser beam driven by the galvanometer scanning system perpendicularly strikes the workpiece surface. The continuous laser beam radiated the material surface along the setting processing path controlled by the CNC system. During the laser machining, the Ti3SiC2 material was thermally melted and removed at instantaneous high temperature generated by the pulsed Nd:YAG laser spot. All the experiments were implemented at the same laser parameters. The laser pulse frequency was 20 kHz, and pulse width was 10 μs. The marking velocity was 500 mm s− 1, and laser processing time was 30 s. The micro-groove width b and groove spacing a were defined as shown in Fig. 1b. Three laser textured surfaces with different groove sizes were fabricated, which were labelled as groove 1, groove 2 and groove 3, respectively. The perpendicular and parallel micro-grooved directions were defined as the perpendicular and parallel directions, respectively. After the laser processing, all samples were rinsed by alcohol for three times.
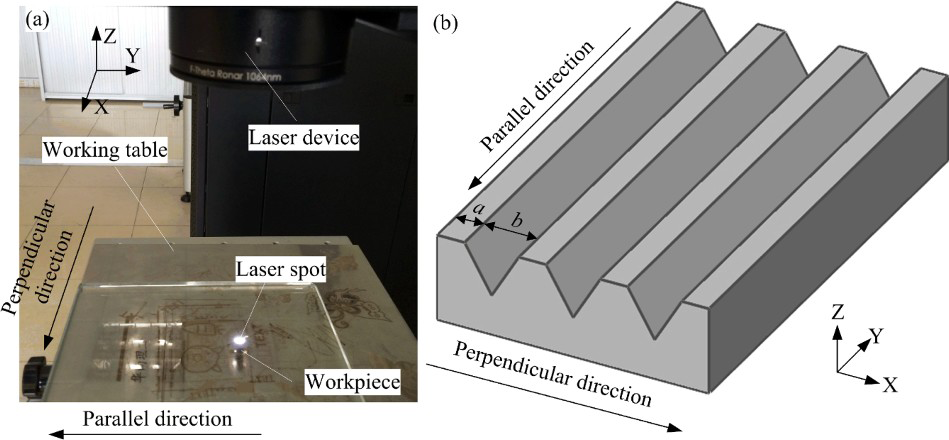
Experimental set-up of laser processing: a laser processing scene; b processing scheme
Surface characterisation and measurement
The surface topographies before and after laser processing were characterised by SEM (FEI Quanta 200, Netherlands) and WLI (BMT SMS Expert 3D, Germany). The surface profiles of smooth and laser textured surfaces were measured by WLI along perpendicular groove direction. The minimum step size of WLI was 0.5 μm. The measurement speed was 0.2 mm s− 1, and the scanning interval was 2 μm. According to the measured profile, the groove width b, groove spacing a and maximum groove depth h can be obtained. The surface roughness Ra can also be calculated by the following equation:
The EDX (INCAP FET-X3, USA) and XRD (Bruker D8 Advance, Germany) were employed to analyse the chemical compositions and phase constitution of Ti3SiC2 surface before and after laser processing.
The static contact angle was measured by sessile droplet method using contact angle meter (Dataphysics OCA40 Micro, Filderstadt, Germany). The water droplet with a size of 2 μl was deposited on the sample at the constant temperature of 26°C and relative humility of 68%. The measurement precision of contact angle was ± 0.1°. Three droplets were made on the material surface to obtain the average value of contact angles.
Results and discussion
Surface topography
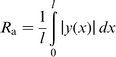
Figure 2 shows SEM photos of micro-grooved Ti3SiC2 surface after laser processing. It is shown that regular and controllable micro-grooved array structures can be efficiently fabricated on Ti3SiC2 surfaces by pulsed laser processing. The micro-grooved structures with different width and spacing sizes were obtained. It is also seen that the laser textured surfaces were rougher than smooth one. This is because the molten Ti3SiC2 was splashed and solidified on both sides of grooves. Moreover, groove 1 was rougher against groove 2 and groove 3. The inset in Fig. 2a was the enlarged picture of micro-grooves. It can be seen that the similar V-shaped grooves were formed, which were composed of many ripples that spanned the width of the groove and were formed along parallel direction of groove.
SEM photos of micro-grooved Ti3SiC2 surfaces after laser processing: a groove 1; b groove 2; c groove 3
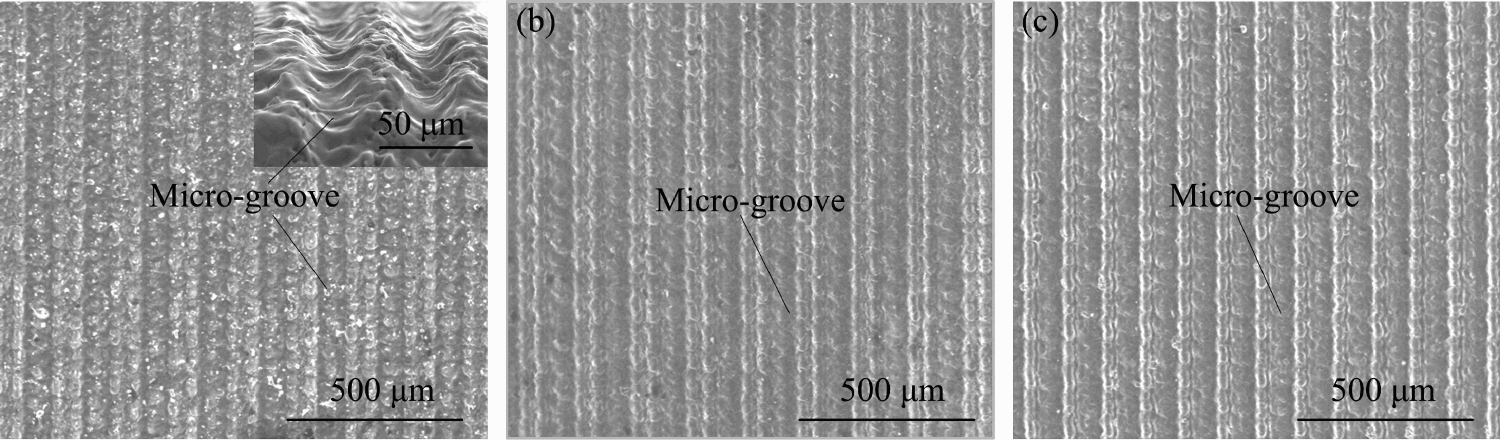
Figure 3 shows the three-dimensional (3D) topographies of smooth and laser textured surfaces. It is shown that 3D textured topographies of V-shaped micro-grooves can be presented clearly. The groove topographies of different surfaces were roughly identical to the SEM pictures in Fig. 2.
3D topographies of smooth and laser textured surfaces: a smooth surface; b groove 1; c groove 2; d groove 3
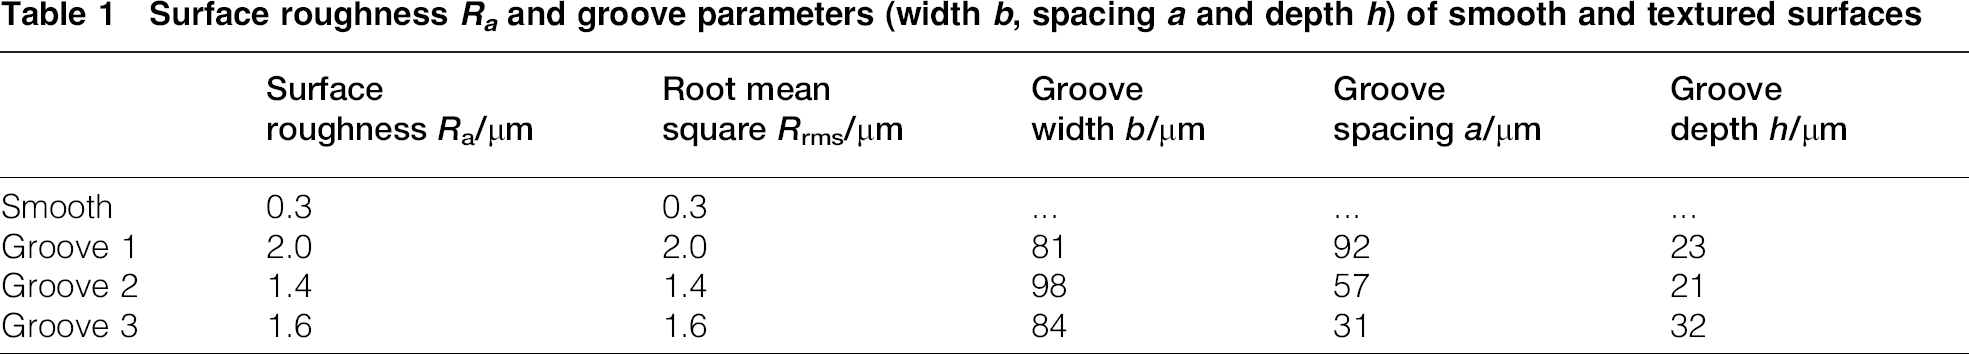
According to the measured profile and equation (1), the roughness curves of smooth and laser textured surfaces can be obtained as shown in Fig. 4. The surface roughness of laser textured surface obviously increased against smooth surface. The surface roughness Ra values of smooth surface, groove 1, groove 2 and groove 3 were 0.3, 2.0, 1.4 and 1.6 μm, respectively. The detailed groove parameters including groove width b, groove spacing a and maximum groove depth h of smooth and laser textured surfaces were shown in Table 1.
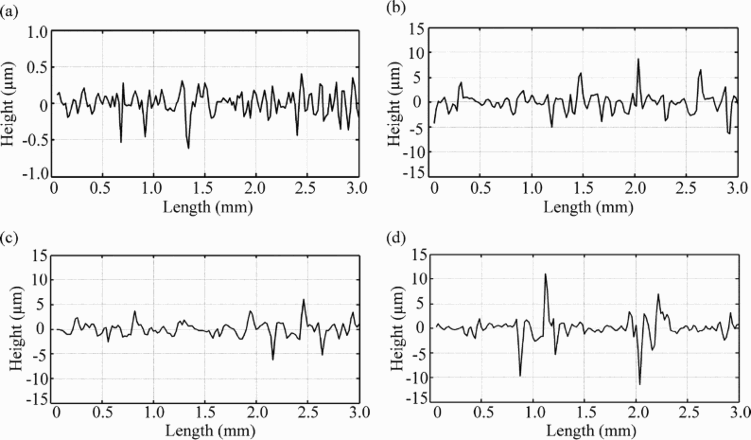
Roughness curves of smooth and laser textured surfaces: a smooth surface; b groove 1; c groove 2; d groove 3
Surface roughness R a and groove parameters (width b, spacing a and depth h) of smooth and textured surfaces
Chemical composition
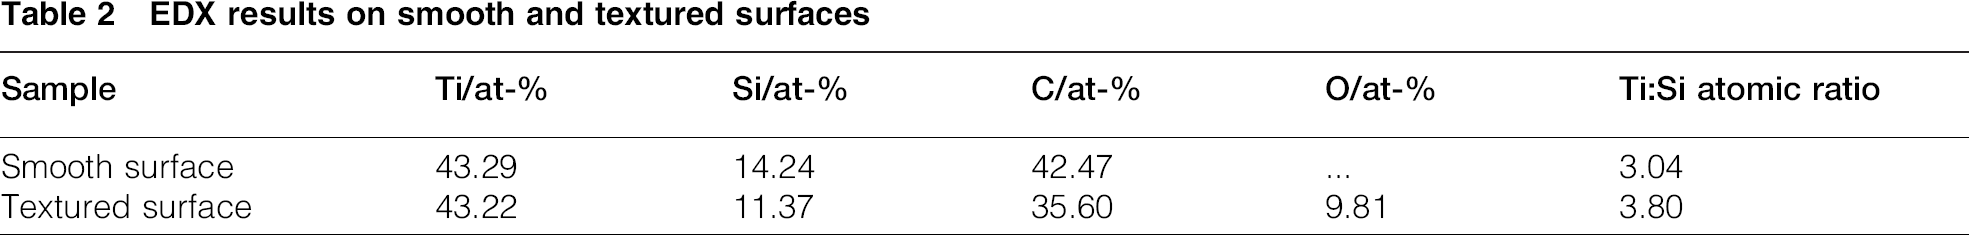
Figure 5 and Table 2 show the EDX results of smooth and laser textured Ti3SiC2 surfaces. Figure 5a shows that the element composition of smooth surface was Ti, Si and C. Figure 5b indicates that the laser textured surface had the presence of impurity oxygen element. This is because the laser processing was conducted in the air. Though the quantitative analysis of C element can be hardly measured by EDX, 17 Ti:Si atomic ratio revealed the change of chemical composition in the samples to some extent. As shown in Table 2, the Ti:Si atomic ratio of smooth surface was 3.04, which was very close to the theoretical Ti:Si atomic ratio of Ti3SiC2. The Ti:Si atomic ratio of textured surface was 3.80, which indicated that a small amount of Si loss occurred during laser processing. As reported by Emmerlich et al., 18 the initial decomposition of Ti3SiC2 film with concomitant formation of TiCx (x ≈ 0.67) in the vacuum can be caused by Si evaporation at the temperature >1100°C. Therefore, it is reasonable that the occurrence of Si loss can be detected by EDX.
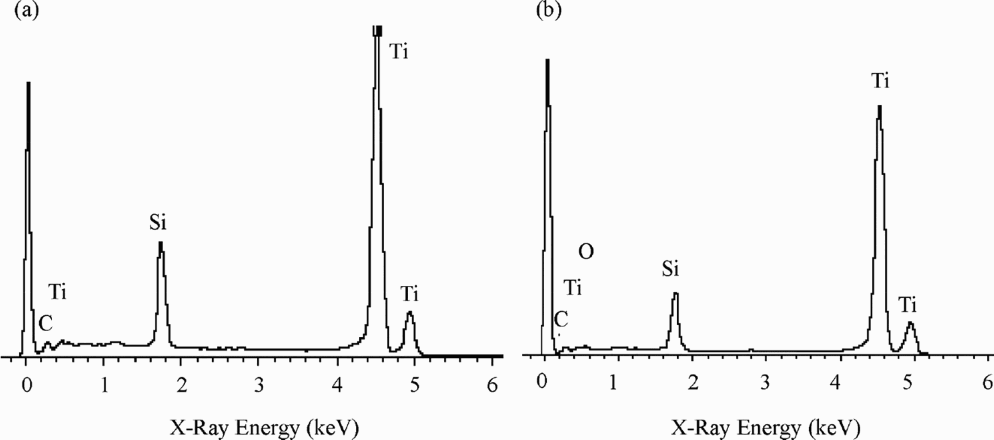
EDX spectrums of Ti3SiC2: a smooth surface; b laser textured surface
EDX results on smooth and textured surfaces
In order to further confirm the phase constitutions of Ti3SiC2 surface before and after laser processing, XRD was conducted. Figure 6 shows that both two surfaces have a high content of Ti3SiC2 phase with hexagonal crystal structure. None of the impurity can be detected in the XRD pattern of smooth Ti3SiC2 surface. However, two weak TiC x peaks were present in the XRD pattern of laser textured Ti3SiC2 surface, which indicated that a small amount of Ti3SiC2 was decomposed into TiC x .
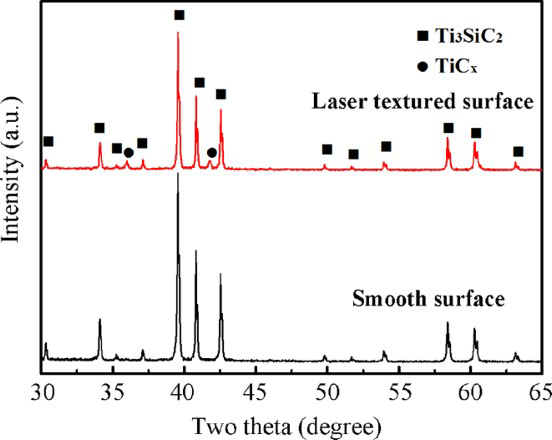
XRD patterns of smooth and laser textured Ti3SiC2 surfaces
According to Low et al.,
19
the phase stability and transition of Ti3SiC2 at high temperature were highly dependent on the oxygen partial pressure. The presence of low oxygen partial pressure can accelerate this thermal decomposition of Ti3SiC2 into TiC
x
, Ti5Si3C and other gaseous oxide. As mentioned by Sun et al.,
20
Ti3SiC2 can decompose into TiO2, SiO2 and CO in a short time under the sufficient O ambient at the temperature >1100°C. The oxidation reaction can be expressed as the following equations19,20:

According to the equation given by Zhang et al.,
21
the purity can be calculated as 
 , and the amount of impurity was about 4.9%. Therefore, the influence of chemical composition on surface wettability was negligible. The main influence factor was the laser textured micro-grooved structures.
Wettability
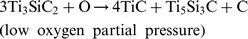
The contact angles along perpendicular and parallel micro-groove directions were defined as perpendicular contact angle θ⊥ and parallel contact angle θ∥, respectively. Figure 7 shows the photos of static water droplets and parallel contact angles θ∥ on smooth and laser textured surfaces. The static contact angles were measured at the steady state. As shown in Fig. 7a, the contact angle θe of smooth surface was 19.4°, which was approximately regarded as the intrinsic contact angle. It is confirmed that the smooth surface was a hydrophilic surface. The parallel contact angle θ∥ values of groove 1, groove 2 and groove 3 were 50.3°, 54.7° and 83.6°, respectively. The contact angles on textured surface were all larger than the smooth one (see Fig. 7). This is because the micro-grooves on textured surfaces reduced the droplet sliding against smooth surface. 22 An increase in surface roughness can contribute to increase in contact angle. 23 This means that laser textured micro-grooves had a positive effect on increase of contact angle. Especially, the wettability of groove 3 approached hydrophobicity.
Photos of static water droplets and parallel contact angles θ∥ on smooth and laser textured surfaces: a smooth surface; b groove1; c groove 2; d groove 3
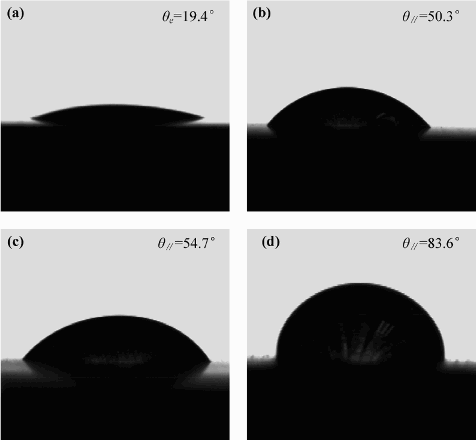
Figure 8 shows the evolutions of perpendicular and parallel contact angles versus time for smooth and laser textured surfaces. The initial contact angle (initial time t0 = 0 s) was measured when the droplet touched the surface for the first time. In order to observe the evolution of contact angle with time, the contact angles were also measured at the time t = 10 s and t = 20 s. It is shown that the contact angles of textured surfaces with large roughness decreased less than the smooth one. This is because the rough surface restricted the spread of droplet. The results were similar to the spread of solder alloys for smooth and rough substrate surfaces. 24 It can be seen that the perpendicular contact angle θ⊥ decreased rapider than the parallel contact angle θ∥ within the first 10 s. For instance, perpendicular contact angle θ⊥ values on groove 1, groove 2 and groove 3 were decreased by 6.1°, 9.8° and 5.3°, respectively, while the parallel contact angle θ∥ values on groove 1, groove 2 and groove 3 were decreased by 2.9°, 4.0° and 3.6°, respectively. Moreover, the smooth surface had a fierce decrease in contact angle at the initial spread stage, which changed from 42.6° to 21.3°. It can be also seen that the change of all contact angles tended to be stable after the deposition time of 10 s. This is because the water drop rapidly deposited on the surface and the contact angle decreased with time going on, which may be caused by the effect of the gravity, roughness, chemical heterogeneity or molecular mobility. 11 After the contact angles reached the equilibrium state, the parallel contact angle θ∥ values were larger than the perpendicular contact angle θ⊥ values. These may be attributed to the capillarity forces created by micro-grooves that can facilitate the spread of droplet, resulting in a sharp decrease in perpendicular contact angles. 25 As for parallel contact angle, energy barrier created by wavy grooves hindered the spread of droplet along perpendicular groove directions. 26
Evolutions of perpendicular and parallel contact angles versus time
Figure 9 shows the perpendicular, parallel and Cassie–Baxter contact angles versus different textured surfaces. At the time t = 20 s, the perpendicular contact angle θ⊥ values and parallel contact angle θ∥ values of groove1, groove 2 and groove 3 were 49°, 44.9° and 79.1°, and 50.3°, 54.7° and 83.6°, respectively. It can be seen that the contact angle θ∥ values were larger than the contact angle θ⊥ values. This is because the water droplet spread along the direction parallel to micro-grooves. 27 The difference values between perpendicular and parallel contact angle were only 1.3°, 9.8° and 4.5°, respectively. The anisotropic wettability of textured surfaces was insignificant.
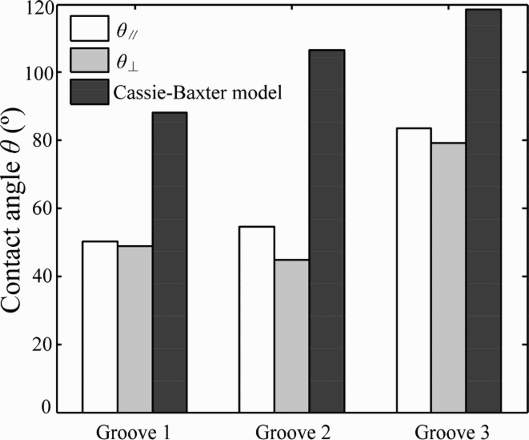
Perpendicular, parallel and Cassie–Baxter contact angles versus textured surfaces
The Wenzel contact angle θw can be obtained by the following formula: cosθw = γcosθe, where θe was the intrinsic contact angle and surface roughness factor γ was defined as the ratio of the real solid–liquid contact area to projected solid–liquid contact area. According to Wenzel model, the contact angle on hydrophilic surface decreased with increasing surface roughness. However, according to the experimental results, the textured surface tended to be more hydrophobic. Hence, the Wenzel model was not suitable for the explanation of these results. The Cassie–Baxter contact angle θc can be obtained by the following formula: cosθc = f (cosθe+1) − 1, where surface roughness factor f was defined as the ratio of the real solid–liquid contact area to projected solid–liquid contact area.
In order to qualitatively analyse the wetting state of droplet, factor f can be approximately caculated by the following formula: f = a/(a+b). In Fig. 9, the Cassie–Baxter contact angle values of groove 1, groove 2 and groove 3 were 88°, 106° and 118°, respectively. It is worth noting that the parallel and Cassie–Baxter contact angles had the same increasing trends. This means that the Cassie–Baxter model may be used to qualitatively analyse the change rule of contact angles. 27 It indicates that the laser textured micro-grooves may be inclined to trap the air and prevent water from penetration during the wetting behaviour. However, the experimental contact angles were smaller than Cassie–Baxter contact angles. The reason is that partial water still immersed in the micro-grooves. Therefore, the wetting state of droplet on laser textured Ti3SiC2 surface was close to the Cassie–Baxter model.
Conclusions
Micro-grooved Ti3SiC2 surfaces with different topographic parameters and roughness can be fabricated by pulsed laser processing. The laser textured Ti3SiC2 surfaces evidently improve the hydrophobicity against the smooth one. A small amount of Ti3SiC2 is decomposed into TiC x during the laser processing. The contact angles of textured surfaces with large roughness decreased less than the smooth one. This is because the micro-grooves on rough surface restricted the spread of droplet. The spread of droplet along micro-grooved parallel direction is facilitated by the capillarity force, while the spread along perpendicular direction is hindered by the energy barrier. The wetting state of droplet on textured surface is close to the Cassie–Baxter model.
Footnotes
Acknowledgements
This project was supported by the National Natural Science Foundation of China [grant no. 51074077].