
Abstract
Microscale deformation behaviour, plastic strain localisation and plastic instability of grain refined rheocast Al–7Si–0.3Mg alloy have been studied here, following micromechanical approach. Micromechanics based simulations have been performed by means of the two-dimensional representative volume element of the actual microstructure, using the popular finite element (FE) package ABAQUS. The molten alloy has been rheocast after grain refiner addition, using cooling slope, and comparison has been made with its conventional cast counterpart. Effect of grain size, shape and its orientation on microlevel stress/strain state of the material, before the final failure, has been predicted in the present study. Increasing uniformity in stress and strain distribution at the microscale has been evidenced with the increasing sphericity and volume fraction of the primary Al phase.
Introduction
Micromechanical modelling in computational study brings new arena in the area of material science. Different modelling approaches have been considered by numerous researchers to simplify the computation processes and to obtain accurate results. Micromechanical approach is well developed now to make successful predictions of deformation behaviour of multiphase materials.1–5
Eshelby 6 established a new way to study micromechanics, considering single inclusion within the matrix. Incorporation of the complexity of actual microstructure within a micromechanical model is always a challenging target. Actual microstructural features are introduced for the first time in computational modelling technique by Brokenbrough and Hunt, 7 using the digital image of the microstructure in the year of 1992. Gokhale and Yang 8 have considered a novel approach known as M-SLIP to link the macro- and microlevel features of the material. Simulations using actual microstructural features are adopted by several researchers to predict the material behaviour under different loading conditions.1,8–10
Al–7Si–0.3Mg alloy (A356) consists of two phases such as primary Al (consists ∼1%Si) and eutectic (consists ∼12%Si).11,12 The alloy is pretty attractive for semisolid processing owing to its wide solidification interval, 12 dual phase nature and high strength to weight ratio. Semisolid processing deals with the specially prepared semisolid slurry having spheroidal primary phase, uniformly distributed in the liquid matrix. There are several papers published on semisolid processing of A356 Al alloy.11–22 Significant percentage of those papers deals with rheocasting using several techniques for non-dendritic cast billet development such as stir casting, electromagnetic stirring, stress induced and melt activated process, magnetohydrodynamic stirring, vibration, gas bubbling, etc.12,13 Recently, the stress induced and melt activated and magnetohydrodynamic stirring technique has been applied commercially. However, costs of those billets are significantly higher compared to conventional cast billets of the same alloy. In the present work, the cooling slope rheocasting technique has been adopted, which is relatively new and yet to be applied in industry, to develop non-dendritic rheocast billets due to the flexibility, cost effective nature of the present technique. Moreover, the technique can be adopted in regular foundries with ease. 12 Under the purview of the present research group, efforts are directed at present to shape the developed rheocast billets, at semisolid condition, into automobile components using a high pressure die casting machine.
Rheocasting of the alloy under investigation has been performed in the present study after melt treatment using grain refiner. It has been found that the small additions of grain refiner, i.e. Al–5Ti–1B master alloy (0.15 wt-%) shifts the liquidus temperature at a higher level, and nucleation process starts early, which facilitates nucleation of more number of primary Al particles, which in turn reduces their grain size and enhances the degree of sphericity. Smaller grain size and higher sphericity of the primary Al phase, attained by grain refiner addition, improves the mechanical properties of the rheocast billets further, as evident from the literature.13,23
In this context, efforts have been made in the present work to investigate the effect of microstructural features of the rheocast alloy on deformation behaviour and failure mode at microscale in comparison of conventionally cast alloy, following the micromechanics approach. In the present work, three differently cast (60° slope, 45° slope and directly poured, defined as R60GR, R45GR and DP respectively) samples of Al–Si–Mg alloy have been investigated based on their actual microstructure based representative volume elements (RVEs).
The present study is focused on understanding the effect of changes in the microlevel deformation behaviour of the present alloy with the change in microstructural morphology due to the adopted casting method/process. It is already proven that the cooling slope rheocasting technique is capable of imparting significant improvement in the mechanical properties of the said alloy. 23 In the present paper, efforts are directed towards understanding the effect of spherodisation of primary Al grains, attained by cooling slope rheocasting, on the deformation/failure behaviour of the alloy at the microlevel, which determines the overall mechanical properties at the macroscale. Grain size, shape, distribution and volume fraction of the primary Al phase are found to be responsible for the overall macroscopic mechanical behaviour of the present alloy, as evident from the micromechanics based simulations. Moreover, micromechanics study reveals the effect of heterogeneous microstructural features, attained due to different processing conditions, on local stress/strain state of the material and predicts its failure mode. The Ramberg–Osgood model has been chosen to define the constitutive behaviour of the present Al–7Si–0.3Mg alloy, as it fits the tensile flow curve of the alloy with minimal deviation.
Experimental
The Al–Si–Mg alloy (composition is 6.8Si–0.34Mg–0.18Mn–0.14Cu–0.11Fe–0.04Ti–92.39Al) has been used in the present study. A cooling slope with stainless steel body is employed to produce a semisolid slurry in the present work. A schematic diagram of the experimental facility is shown in Fig. 1. The alloy ingot is melted in a resistance heating furnace having 5 kg capacity, set at 1023 K. To perform the experiments, 2 kg of the said alloy is melted in a silicon carbide crucible located within the resistance furnace. The degassed and grain refined 24 (0.15 wt-%Al–5Ti–1B master alloy) melt is then allowed to cool up to the desired pouring temperature and poured along the slope using a silicon carbide crucible having a 10 mm hole at the bottom. Bottom pouring with a stopper arrangement has been used to enable melt pouring into the slope at a controlled rate. The cooling slope is adjusted at two different slope angles of 60 and 45° with respect to the horizontal plane and preheated at 60°C temperature by oil circulation underneath. The melt becomes a semisolid slurry up to the cooling slope exit and fills a mild steel mould, preheated to 100°C, and then allowed to cool in air. Details on the experimental procedure may be seen from our earlier published work.12,23
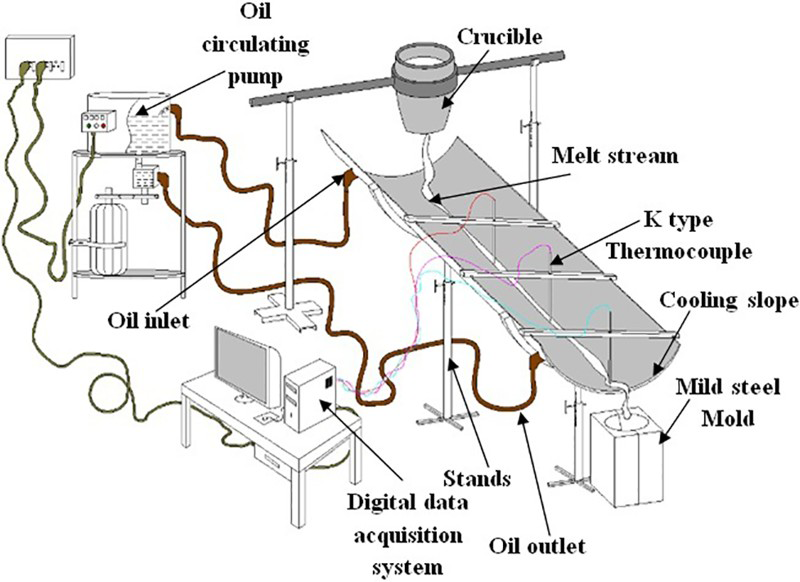
Schematic diagram of experimental facility
To compare the cooling slope casting (rheocasting) results with the conventional castings, some samples have been cast by directly pouring the melt having low superheat (∼10°C above liquidus) into the preheated metallic moulds. After the experiments, test samples are machined from the middle section of the cast billets and prepared for metallographic investigation. The samples are then etched by Keller solution and examined using an optical microscope (Olympus). Vickers macrohardness test (using an Instron make macrohardness tester) has been performed on the samples obtained from cast billets by applying a 5 kg load for 15 s. Vickers microhardness test (using a Matsuzawa semiautomatic microhardness tester) has been performed on the primary Al phase of the cast samples by applying a 50 g load for 15 s. Moreover, tensile tests have been performed using cylindrical tensile samples (as per ASTM E8 standard) by applying a strain rate of 0.001 s− 1 (using an Instron make 100 KN universal testing machine). Factographic investigations have been performed, after tensile testing, using a scanning electron microscope (Hitachi-SEM).
Modelling technique of actual RVE
The digital image of the microstructure of the individual material (castings) has been captured under an optical microscope. A commercial image analysis software Vextractor is used to convert the raster image into a vector image. Vectorised microstructures having 0.5 × 0.5 mm domain is considered as two-dimensional (2D) RVE and exported to ABAQUS to perform for finite element simulations.
Necessities of RVEs are unavoidable due to the practical limitations in the case of both numerical and real life representations of material structure. In general, RVE is a region, which serves as the ‘statistical representative’ of the whole material. The region may be taken from anywhere in an infinite sample. The definition of ‘representative’ may alter depending upon the interest in the attribute of the material. The commonly used assumptions in RVE generation are as follows:
periodicity, quasi-periodicity statistical homogeneity.
Details on the RVE generation may be seen from prior art.
3
In the present study, A356 alloy is considered as a statistically homogeneous material, in terms of volume fraction of the constituent phases. It means that the RVE chosen from anywhere of a sample of the said alloy will have the same volume fraction of the respective phases, with some tolerance. Therefore, effective properties of the material are constant throughout its body. Three different RVEs of the R60GR sample, chosen from the three different locations, are compared in the section on ‘Generalisation of phase configuration’ of the revised manuscript.
The popular finite element code (ABAQUS) is used to analyse actual RVEs, using 2D planar modelling space. Planar and axisymmetric problems are basically special cases of general three-dimensional problems. The current study deals with the effects of the microstructural features of rheocast and the conventional cast Al–Si–Mg alloy on local stress state, at the microlevel. The effects of the irregularity of the microstructure can be well captured by the plane strain model, rather than axisymmetric, as mentioned in the literature.25,26
Primary Al and eutectic phases have been considered as deformable shell parts, when imported to ABAQUS. Then, these two instances are assembled considering the mesh independent part, so that the assembled phases can be meshed together. Perfect bonding has been considered between the contact surfaces (edges in case of 2D) between two phases. Constitutive response of both the primary and eutectic phases has been described by the Ramberg–Osgood27–31 law. A detailed description of the Ramberg–Osgood law is given afterwards within the manuscript. Quad dominated free meshing technique has been adopted 32 with a seed size of ∼3 μm to discretise the simulation domain. Linear plane strain elements have been considered for mesh generation. The average number of elements and nodes are about 110 000 and 130 000 respectively for the RVEs. A detailed discussion on the model generalisation tests, i.e. the selection of mesh elements, mesh sensitivity and effect of phase configuration may be seen from the sections on ‘Selection of mesh elements’, ‘Mesh independence’ and ‘Selection of mesh elements’ of the manuscript. Two different boundary conditions are assumed at different locations on the cylindrical tensile sample, to perform the present simulations. Boundary conditions are shown using the schematic diagram in Fig. 2.
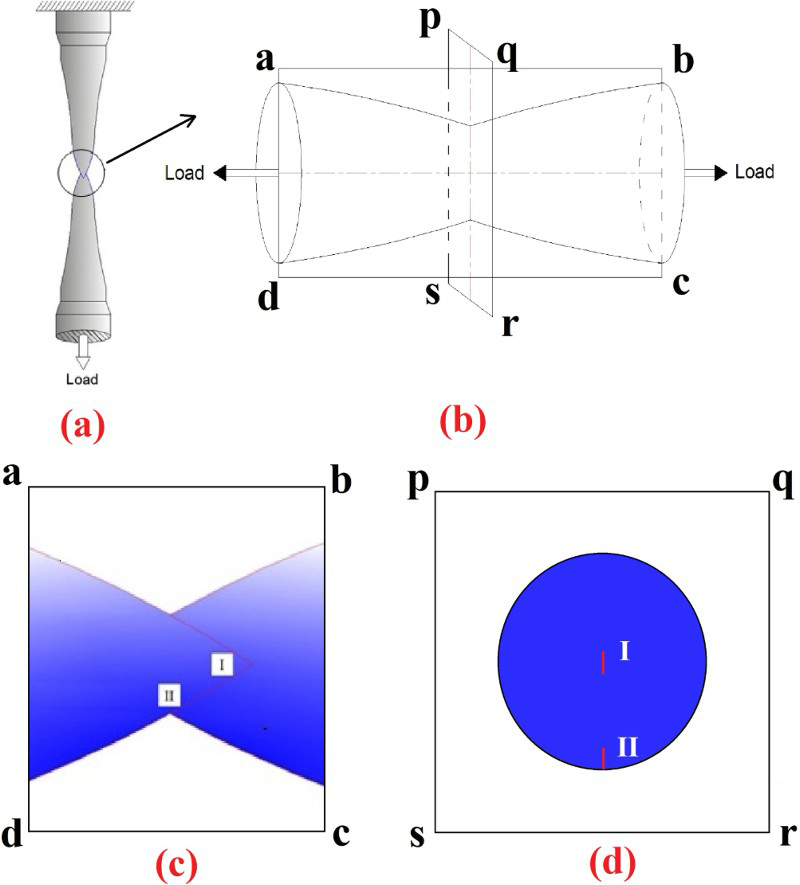
a cylindrical tensile sample under axial loading, b magnified neck zone and plane (abcd) on longitudinal section and plane (pqrs) on radial section, c assumed location of RVEs on longitudinal section and d assumed location of RVEs on radial section
Boundary conditions
Gauge length portion of the cylindrical tensile sample is shown in Fig. 2a. Often, ‘cup and cone’ features are found in the case of moderately ductile materials before final failure, under uni-axial tensile loading. Shearing is responsible for neck generation, which leads to the generation of the ‘cup and cone’ feature. 33 As stated earlier, the main objective behind the present work is to visualise the state of stress/strain that prevails at the microscale at the onset of necking. For understanding, a magnified image of the neck zone is shown in Fig. 2b. Two planes along the longitudinal direction (‘abcd’) and the radial direction (‘pqrs’) are shown in Fig. 2b. Representative volume elements (I and II) are assumed at the neck zone of the cylindrical tensile sample, which is assumed to be at the central location of the bar. The location of the said RVEs on the longitudinal and radial plane is shown in Fig. 2c and d. Macroscale necking behaviour is captured by Kim et al. 34 by performing FE simulations on a cylindrical tensile sample. In the present work, the deformation behaviour of the rheocast alloys has been studied at the microscale. Motivation for boundary conditions of case I has been obtained from the work of Kim et al. 34 , whereas case II is proposed in the present work considering the practical aspect of deformation near the outer edge (peripheral location) in a cylindrical tensile bar, as reported earlier in the case of macroscopic tensile test.34–36
Case I (centre): boundary conditions for case I is applied to the left and right edges of the RVE. The left edge is constrained, whereas displacement is assigned on the right edge. Displacement is specified in the direction of loading or the X direction, whereas it can move freely in the Y direction. Rotational motions are blocked for both the left and right edges and the rest of the two edges are left without assigning any boundary condition. Boundary conditions of case I are shown in Fig. 3a.
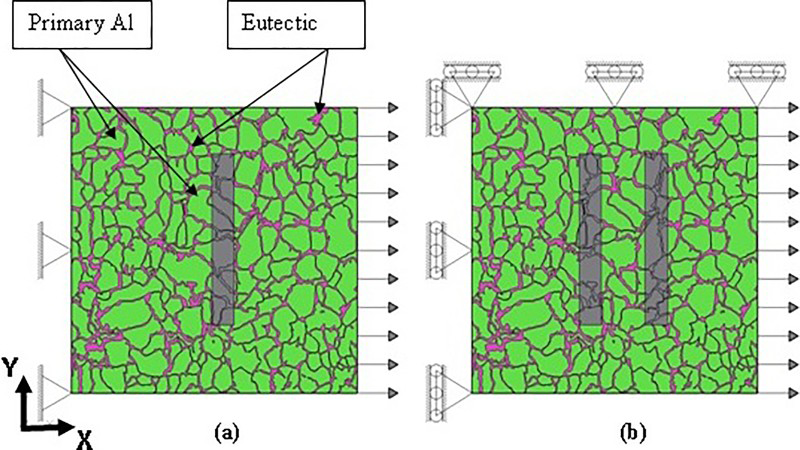
Boundary conditions for RVEs for cases I and II
Case II (bottom): in this case, the left edge is allowed to move in the Y direction or transverse to the loading direction only, whereas the right edge can move in both the directions X and Y (shown in Fig. 3b). The top edge is assigned to freely move in the X direction but not in the Y direction. Rotational motions corresponding to these three edges are constrained. No condition is imposed to the bottom edge. Boundary conditions of case II are shown in Fig. 3b.
Displacement values of the individual material are estimated from the percentage elongations found in the experimental tensile results.
28
The calculation procedure of the displacement values is as follows
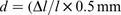
Strain = displacement/gauge length = Δl/l Length of the simulation domain = 0.5 mm
Thus, the displacement d required to get the experimental strain value for the respective samples is
Displacement values used for different materials

Description of material model
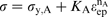
The Ramberg–Osgood law is used as a material model in the present work. It defines both the elastic and plastic regions of the flow curve using a single function. One-dimensional representation of the relationship is as follows
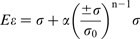

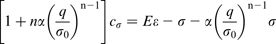

 , if Eε>σ0. The material stiffness matrix for this model is
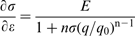
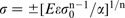
Plastic flow stresses of the material has been defined using equations (7) and (8) shown below
Selection of mesh elements
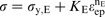
Figure 4 shows the histogram plot of von Mises stress distribution of R60GR, simulated as per boundary condition I, using quadratic and linear elements for mesh generation. The material properties, boundary condition and seed size (3 μm) are kept constant, to compare the effect of quadratic and linear elements on the simulation results. It can be concluded from the histogram plot that there is no such difference due to the changes of mesh elements. The curves for quadratic and linear elements are parallel to each other, although the peak height is different, which is attributed to the difference in the total number of nodes. Further investigations have been performed using linear elements, owing to save computational cost. The results are discussed in detail in the following paragraphs.
Histogram plot of von Mises stress distribution of R60GR, simulated as per boundary condition I with quadratic and linear mesh element
Mesh independence
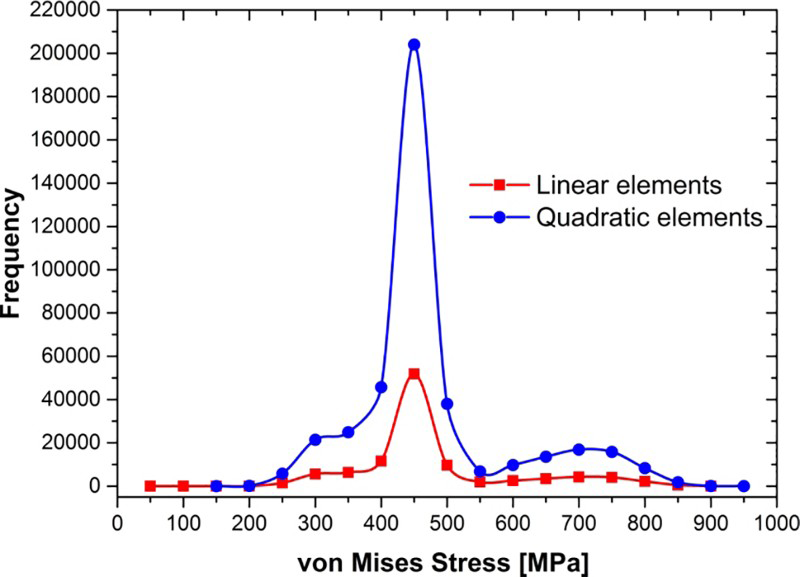
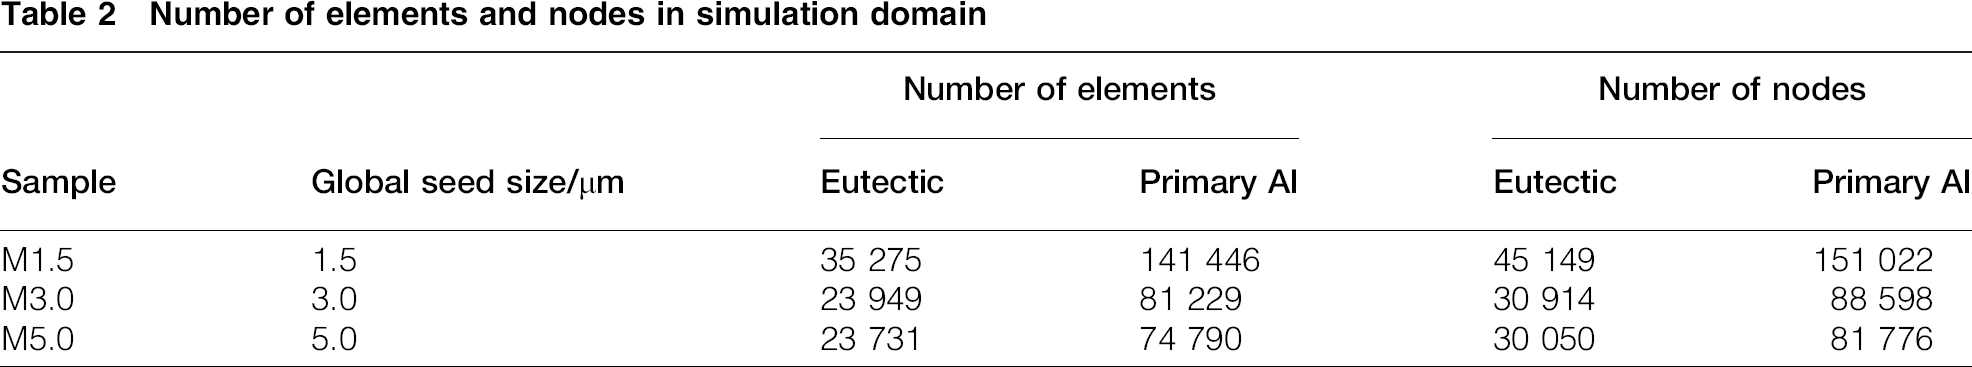
A mesh independence test has been performed in the present study. Same microstructure has been simulated keeping the material property, boundary and loading conditions (case I) constant, where mesh density is different. Three different seed sizes of 1.5, 3.0 and 5.0 μm are chosen to discretise the simulation domain, and they are denoted as M1.5, M3.0 and M5.0 respectively. In Fig. 5, a comparative contour and histogram plot of von Mises stress distribution is shown for all three mesh sizes. Stress distributions are found to be similar (contour plot); however, the difference lies in the peak height, as observed in the histogram plot. It is also found that the histogram plots of the three cases (M1.5, M3.0 and M5.0) are parallel to each other. It means; irrespective of the mesh density, flow behaviour of the material (R60GR) is found to be quite similar. Details on the number of elements and nodes used for mesh generation are given in Table 2, where the smaller the seed size, the higher the mesh density. Among the above mentioned three mesh sizes, M1.5 shows the highest frequency of stress distribution for the peak region, whereas M3.0 is second, and M5.0 lies in the third position, which is attributed to the difference that lies in the total number of nodes present. Close intervention on Table 2 reveals that the difference that lies between the total numbers of nodes is 62 424 between M1.5 and M3.0; however, it is only 6822 between M3.0 and M5.0. This means the geometry is so complicated that it cannot be meshed with larger element sizes like 5 μm. Free meshing scheme allows meshing with the smaller element size, if necessary, but not larger than the specified seed size. Thus, uniform element size distribution throughout the simulation domain can be obtained in the case of M3.0, rather than that of M5.0, and on the other hand, it is computationally less expensive compared to that of M1.5. With these advantages, global seed size of 3 μm is selected to discretise the 2D simulation domain of the respective microstructure based RVEs.
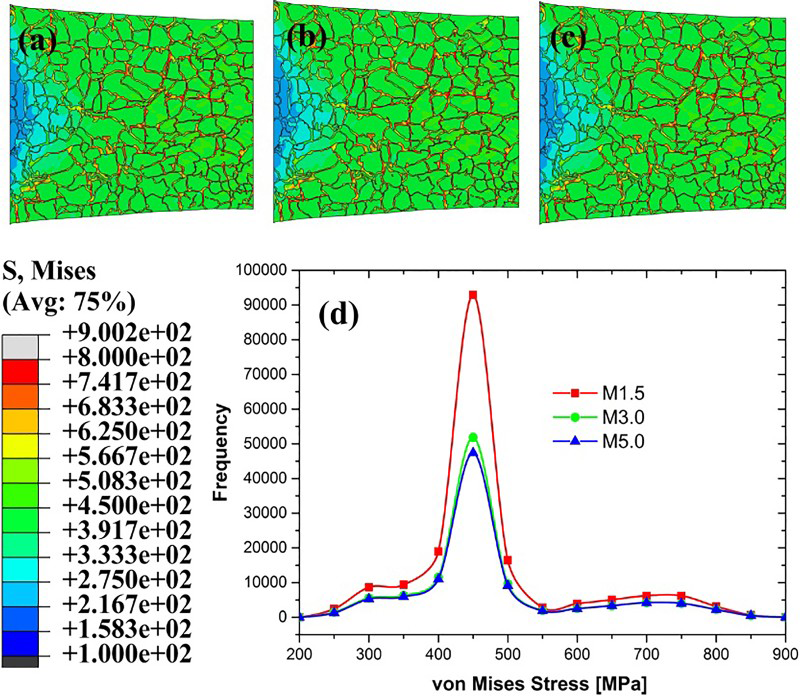
Contour of von Mises stress distribution of R60GR with different mesh densities of a M1.5, b M3.0 and c M5.0 and d histogram plot of von Mises stress of M1.5, M3.0 and M4.5.0
Number of elements and nodes in simulation domain
Generalization of phase configuration
To generalise the RVE determination, based on optical micrographs, three RVEs have been simulated with the same boundary (case I), material property and same mesh size of 3 μm, considering the microstructures of different locations of the same rheocast alloy (R60GR). These RVEs are defined as R60GR_1, R60GR_2 and R60GR_3. A comparison has been drawn between the RVEs under consideration (R60GR_1, R60GR_2 and R60GR_3), with the help of von Mises contour plot and histogram plot, shown in Fig. 6. Reasonable similarity is observed in the stress distribution (contour plot) and frequency distribution of the stressed nodes (histogram plot) between the above mentioned RVEs. Quantitative idea can be developed about the stress distribution from the histogram plot, shown in Fig. 6d. The frequency distribution curves for all three RVEs are parallel to each other, which signifies their similar flow behaviour. Two peaks are found between the stress regime of 390 and 520 MPa and between 650 and 800 MPa, for all three cases. Thus, it can be concluded that choice of RVEs made in the present study for the respective alloys are independent of their phase configuration and serves as the true representative of their microscale deformation behaviour.
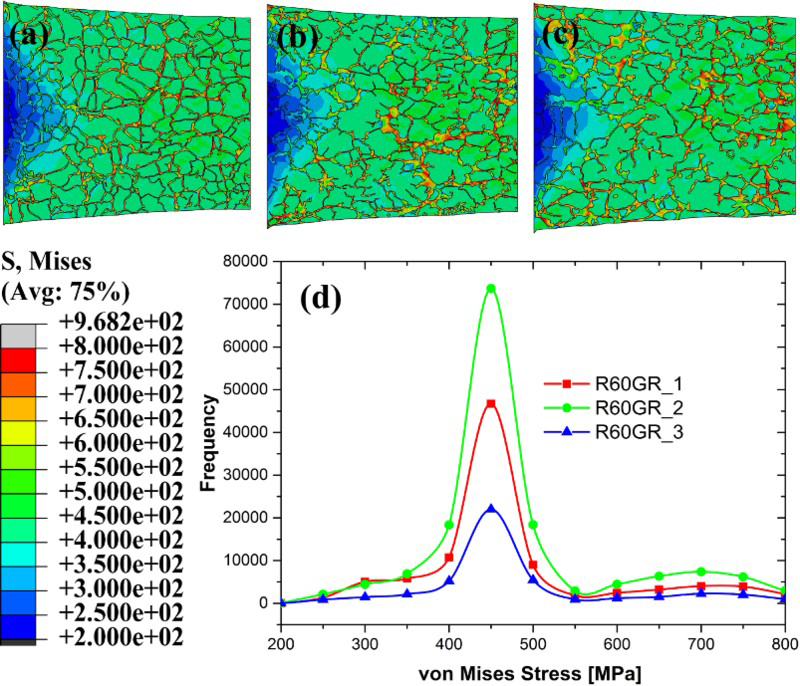
Contour of von Mises stress distribution of R60GR with different phase configurations a R60GR_1, b R60GR_2 and c R60GR_3 and d histogram plot of von Mises stress of R60GR_1, R60GR_2 and R60GR_3
Results and discussion
Experimental results
Spherodisation of the microstructural features of the said alloy, attained by rheocasting using the cooling slope, is possible due to copious nucleation (heterogeneous nucleation) and dendrite fragmentation, attained by shear driven melt flow along the slope. Grain refiner addition aids to enhance the heterogeneous nucleation further, along with the generation of a higher solid fraction. 23 Figure 7b–d shows the optical micrographs of rheocast alloys, processed using the cooling slope after melt treatment using a grain refiner (0.15 wt-%Al–5Ti–1B), which are remarkably different compared to that of the starting ingot (Fig. 7a). Two different slope angles of the cooling slope have been considered for rheocasting such as, 45° (Fig. 7b) and 60°. Maximum sphericity (0.83) and minimum grain size (28 μm) has been obtained in the case of sample casts using a 60° slope angle (Fig. 7c), whereas another rheocast sample, cast using a 45° slope, shows the presence of some degenerated dendrites due to agglomeration and welding of primary Al particles. Reduced shear during melt flow in the case of a 45° slope, due to lesser gravity component, is responsible for lower sphericity (0.72) and higher grain size (40 μm) of primary Al grains, compared to that of the 60° slope. To judge the effectiveness of the rheocasting process followed in the present study, comparison has been made with the billet cast by directly pouring the melt having low superheat (10 K superheat) into a metallic mould. Dendritic structure is observed in the latter case, as expected. However, dendrites are generally of small size (Fig. 7d), which may be due to the turbulence created during melt pouring at low superheat.
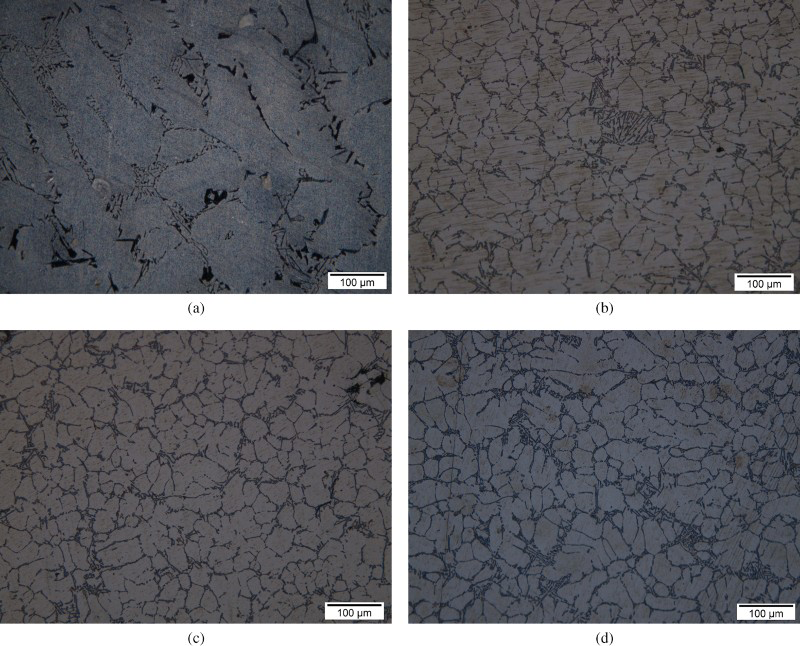
a as received ingot of A356 alloy; b 45° slope grain refined; c 60° slope grain refined; d direct pouring into mouldOptical micrograph at different processing conditions
Significant improvement in the mechanical properties has been obtained due to spherodisation of the primary Al phase, attained by rheocasting, which has been confirmed by tensile, 28 macrohardness and microhardness results. Comparison of tensile results of the samples studied in the present work is shown in Fig. 8, using a bar graph. Schematic diagram of the cylindrical tensile sample, used in the present study, along with the digital image of the deformed and non-deformed tensile sample is shown in Fig. 9 of the revised manuscript. In this context, it should be mentioned that the present class of Al alloys does not show substantial necking, as in the case of most of the low carbon steels. However, enhancement of the longitudinal dimension and decrease in the lateral dimension may be seen from Fig. 9b and c respectively for the sample tested for the ideal process condition (R60GR). Drastic improvement is observed in yield strength, ultimate strength and percentage elongation of the rheocast materials, and R60GR shows the best results among them. The macrohardness and microhardness results are reported in Table 3. Representative optical micrographs of the microhardness tested samples of rheocast alloy, cast using a 60° slope are shown in Fig. 10. Micromechanics based simulations have been performed to understand the effect of spheroidal primary phase morphology on the microscale deformation behaviour of the rheocast alloy, and the results are discussed in the following sections.
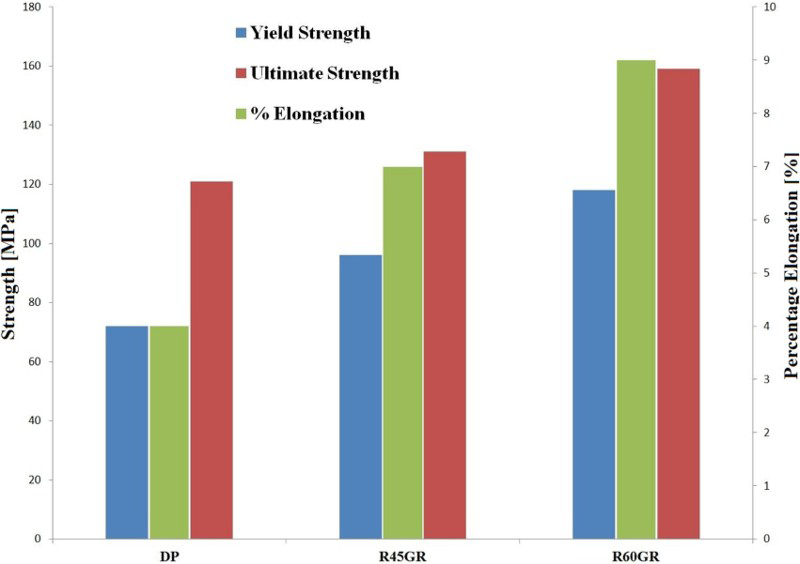
Comparative plot of tensile properties for materials under investigation
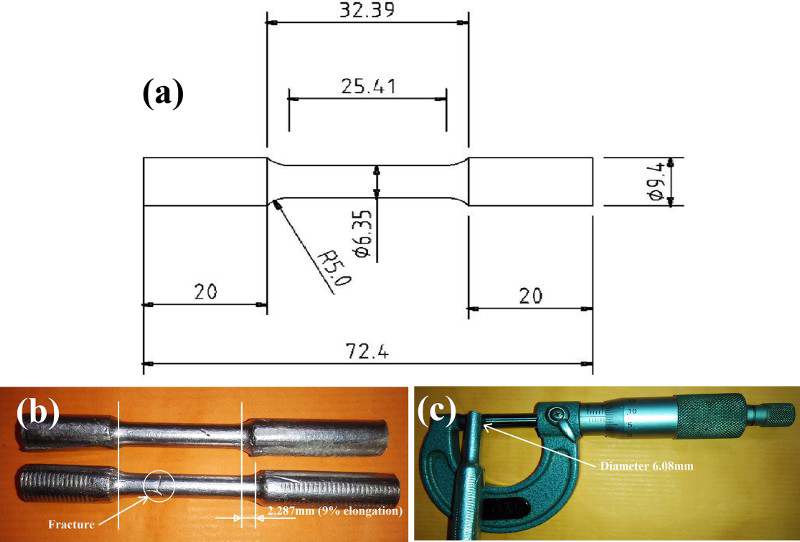
a schematic diagram; b digital image of deformed and non-deformed sample; c reduction in diameter measured by screw gaugeTensile specimen
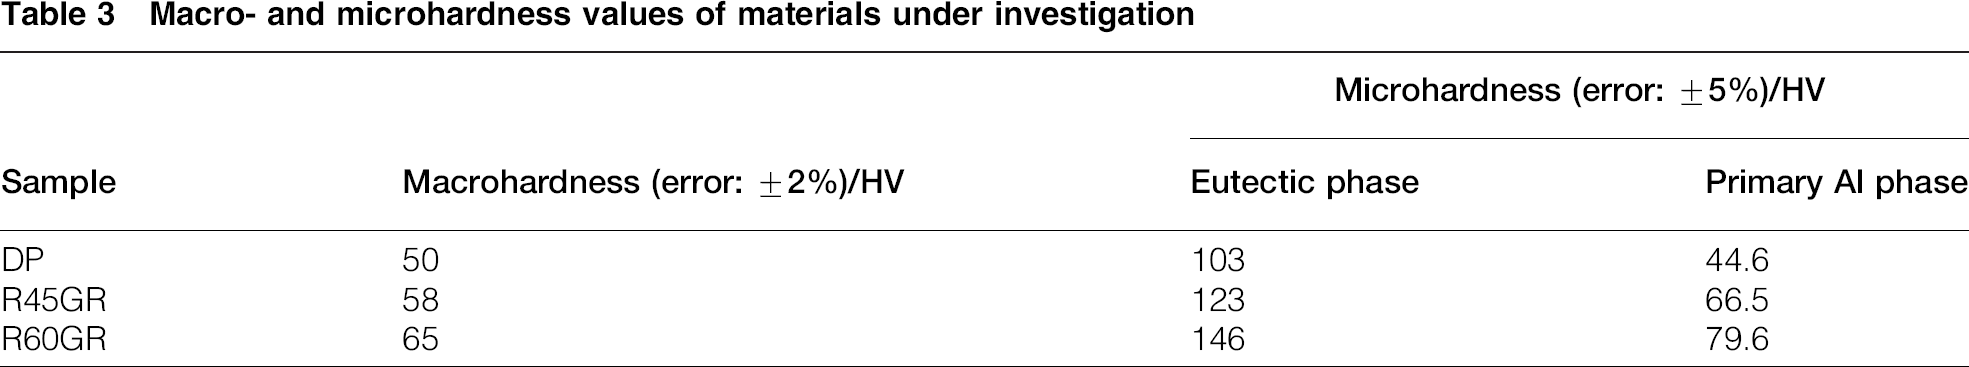
Macro- and microhardness values of materials under investigation
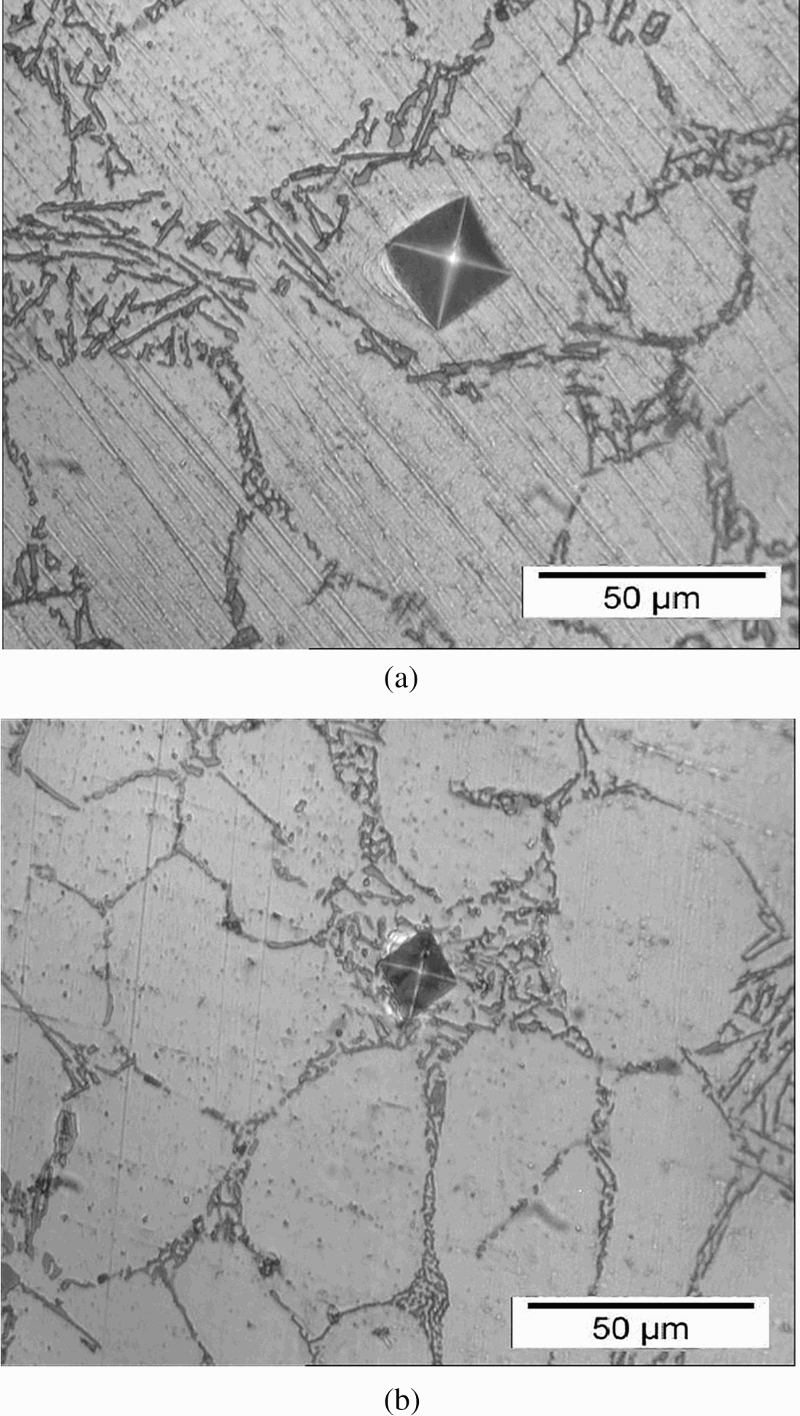
a α-Al; b eutectic regionIndentation marks after microhardness testing
Calibration of Ramberg–Osgood model
In the present work, efforts have been made to generalise the constitutive behaviour of rheocast alloys at room temperature and subsequently, Ramberg–Osgood law has been used for the simulation purpose, which models the material behaviour as elastic plastic using a single function. To calibrate the Ramberg–Osgood law for the present materials, experimental value of yield strength (118 MPa) of the ideal process condition (R60GR) and literature values of constant parameters for bulk/cast Al alloys such as Young's modulus (70 GPa), Poisson's ratio (0.33), hardening exponent (10)30,31,37,38 and yield offset (0.2%) have been considered to perform the three-dimensional tensile simulation, in line with the tensile sample dimensions shown in Fig. 9a. Afterwards, the simulated true stress–strain curve has been compared with the experimentally derived true stress–strain curve of the conventional cast and T6 treated A356 Al alloy, given by Horstemeyer. 39 The flow behaviour of the simulated and experimental true stress–strain curve is found to be in good agreement with each other. Four error bars have been added at four different locations of the simulated flow curve (Fig. 11), to quantify its deviation from the experimental curve. Figure 11 shows that the Ramberg–Osgood law describes the flow behaviour of the material with an error regime of < 10%, which falls within the general acceptance guidelines of the simulation problems. In this context, it should be mentioned that the inflection point comes into the simulated flow curve due to the elastic to plastic transition of the material's flow behaviour. 40 Henceforth, all the RVEs are simulated considering the Ramberg–Osgood relation as the constitutive model.
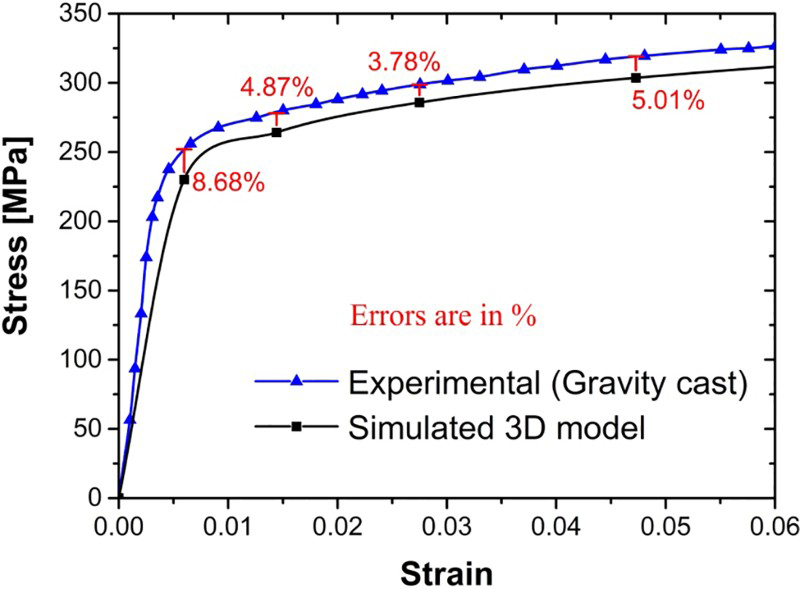
Comparison of experimental and simulated true stress–strain curve
Obtaining phase level yield strength values
Tabor found a simple linear relation between hardness and yield strength of a material.
41
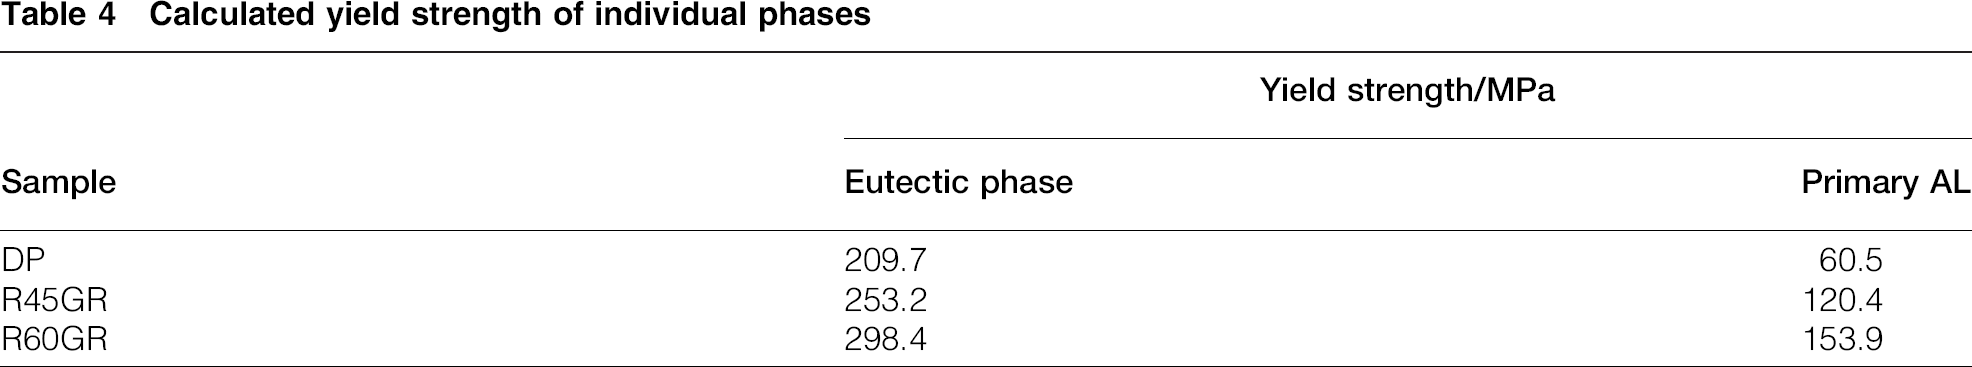
A number of researchers have used that relation to predict the yield strength or ultimate tensile strength from the hardness results of the multiphase material.42–44 In the present study, yield strength of two different phases of the said alloy, processed at different process conditions, has been approximated using a simple relation. The equation is developed by the curve fitting macrohardness and yield strength plot, plotted for the different processing conditions studied in the present work, of the bulk alloy (Fig. 12). The equation is as follows:

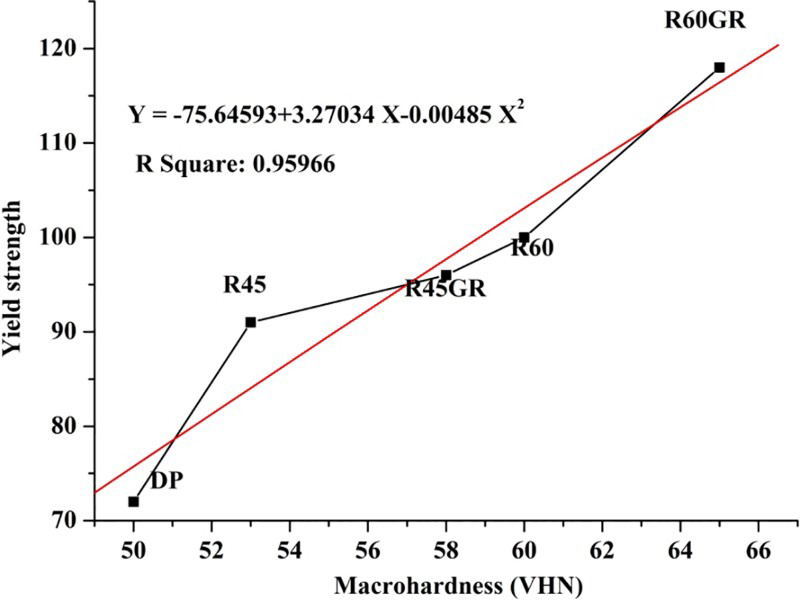
Curve fitting of macrohardness and yield strength plot
Calculated yield strength of individual phases
Simulation results
An actual microstructure based micromechanical FE model has been developed to predict the flow behaviour and failure mode of Al–Si–Mg alloy, cast according to different process conditions mentioned earlier. RVEs are defined as DP, R45GR and R60GR for direct poured casting, rheocast with 45 and 60° slope angles respectively.
Uniaxial tensile simulation results of DP, R45GR and R60GR, as per case I boundary condition is shown in Fig. 13 at the same strain level of 4%. Most of the elements of both the phases, i.e. primary Al and eutectic Si experience tensile stresses, whereas few elements experience compressive stress. The difference in yield strength between the two phases leads to the uneven deformation under the same loading condition, which is responsible for the compressive stress experienced by few elements. There is an effect of orientation on load distribution. Figure 13 shows that long strips of high stress regions are located along the loading direction in the case of the eutectic phase. At the same time stressed zone transverse to the loading direction on the eutectic phase shows very less amount of stress. The same effect of orientation is present on the primary phase, too, but that is not so much clear as high volume fraction reduces the effectiveness of orientation. At the same strain level, it is found that the lower stresses are localised on the rheocast material compared to the directly poured sample, and it is also found that the R60GR shows enhanced uniformity in stress distribution than R45GR. This is attributed to the enhanced ductility, experimentally observed in the case of the R60GR sample compared to DP and R45GR.
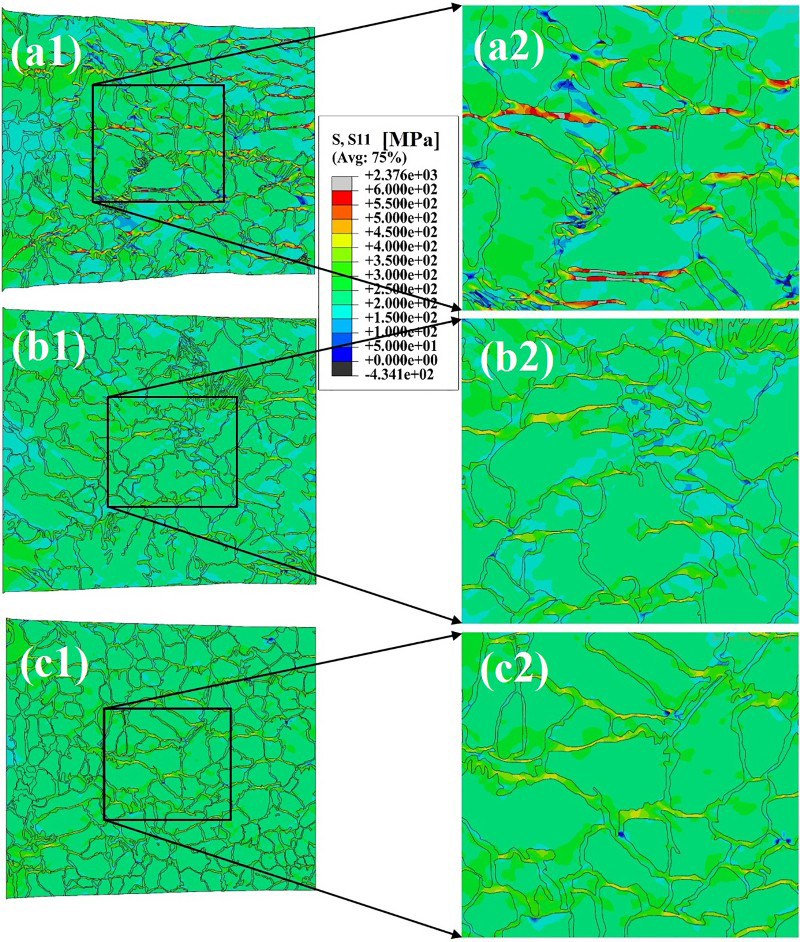
Nominal stresses along direction of loading (horizontal direction); a1, b1 and c1 are for DP, R45GR and R60GR respectively and a2, b2 and c2 are magnified view of DP, R45GR and R60GR respectively
A quantitative comparison has been carried out on the basis of the true stress–strain curve. Figure 14 shows the simulated flow (stress–strain) curves of the individual phases of the simulated RVEs. In this context, it should be mentioned that the true stress–strain curves are plotted considering a highly stressed element (observed in von Mises contour shown in Fig. 13) from both the primary Al and eutectic phases. The distance between the selected elements on each phase of the same sample is kept to a minimum to avoid the local effect of the variations in the applied boundary conditions. The findings interpreted from Fig. 14 are discussed below.
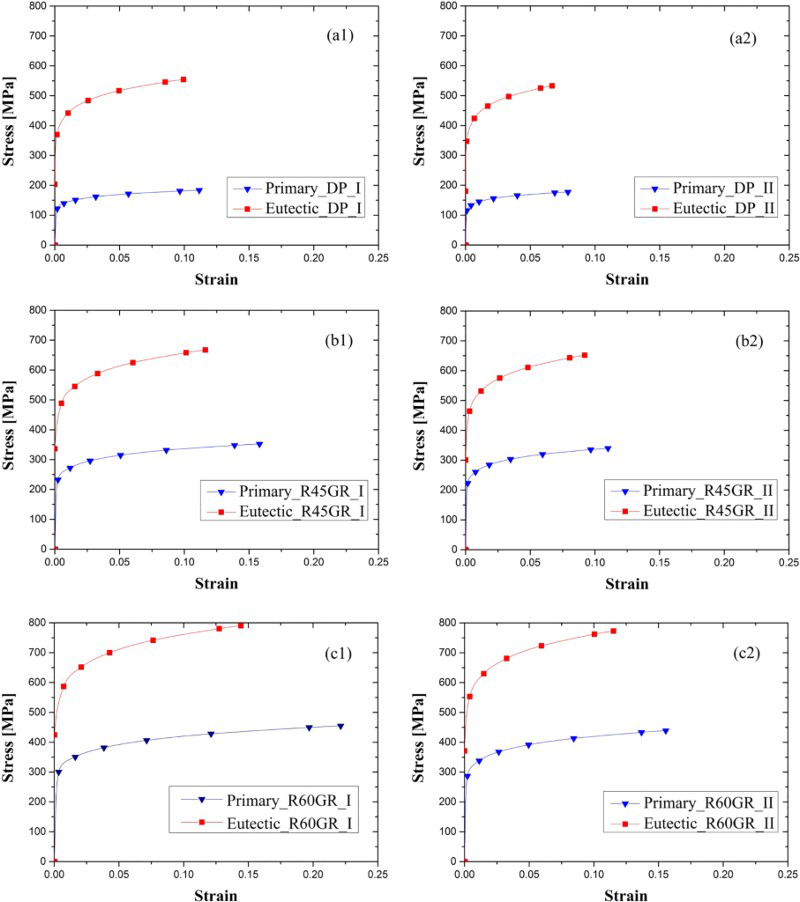
a1 DP I; a2 DP II; b1 R45 I; b2 R45 II; c1 R60 I; c2 R60 IITrue stress–strain behaviour of two phases of A356 alloy at different boundary conditions
At a lower strain level, both the phases carry the load mutually. After reaching the yield point of primary Al, it starts to deform, whereas the eutectic phase continues to carry the load. For all the cases, a larger deformation zone has been observed in the case of the primary Al phase, compared to that of the eutectic phase. Strain partitioning between the two constituent phases is also confirmed from the true stress–strain curves, shown in Fig. 14. Unloading is observed after ultimate straining of the eutectic phase, when primary Al continues to get strained and shares some more load before final failure. A larger deformation zone of the primary Al phase facilitates the unloading phenomenon of the eutectic phase. A smaller globule size of the primary Al grains increases the volume fraction of the primary phase within the microstructure and leads to the uniform stress distribution in the case of R60GR, compared to others. This in turn yields a higher percentage elongation or toughness in the case of grain refined samples, rheocast using 60° slope.
Simulated contours of the actual microstructure based RVE of R60GR, as per case I boundary condition, is shown in Fig. 15 at different strain levels. At a lower strain level, both the phases carry the load mutually, whereas the eutectic phase carries a higher stress at a higher strain level due to the strain partitioning, shown in Fig. 15b. Strain bands start to initiate from all four corners and spreads with the increasing strain level towards the centre zone of the RVE. Equivalent plastic strain bands are visible at the strain level of 0.9% and start to localize at 3.6%, as shown in Fig. 15a and b respectively. Microstructure in-homogeneity is found to be responsible for damage initiation by the plastic strain localisation at an angle of 45° to the loading direction. Coalescence of high strain bands indicates the crack propagation path, which leads to the final failure of the material.
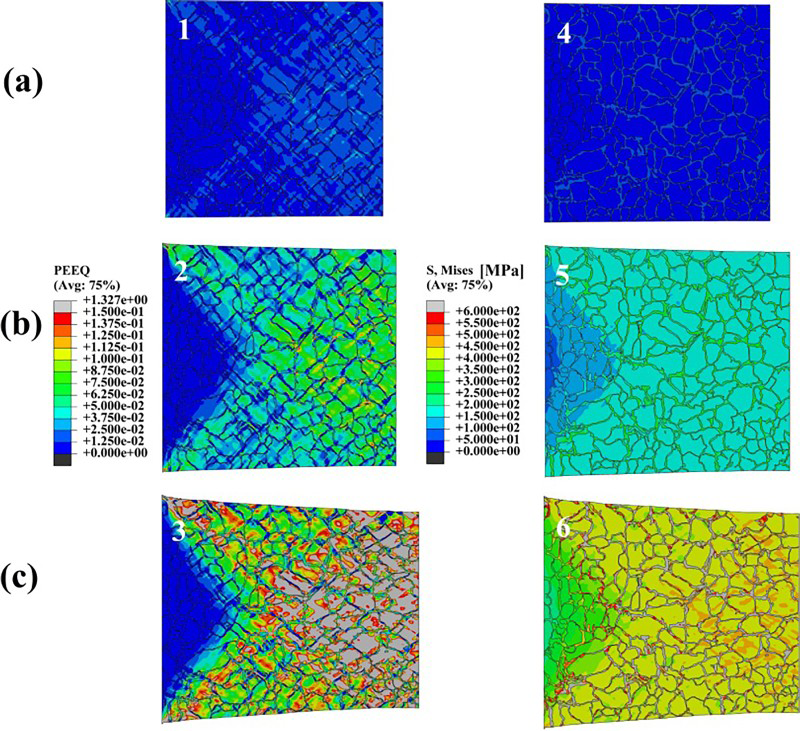
Equivalent plastic strain (1–3) and von Mises stress (4–6) distribution at different strain levels of R60GR, with case I boundary condition; strain levels are a 0.9%, b 3.6% and c 9%
von Mises stress and equivalent plastic strain distribution of the actual microstructure based RVE of R60GR, under case II boundary condition, are shown in Fig. 16, at different strain levels. The nature of strain initiation and localisation is different from that of case I. Here, strain bands initiate randomly from all over the model and spread likewise, mainly on the primary Al phase. Multiple strain bands are observed at an angle of 45° to the loading direction, at the highest strain level before final failure. Strain bands are not so connected, as observed in the case of the case I boundary condition. Initiation and localisation points of the equivalent plastic strain are at a strain level of 1.35 and 5.4% respectively shown in Fig. 16a and b. Owing to local in-homogeneity, strain bands are mostly localised at the primary Al phase, near the grain boundary, in the case of the actual RVEs. Microstructural in-homogeneity leads to the early strain localisation for the most complex regions. It is found that there is a sharp difference between the average strain level (green bands) and the localised shear bands, at the point of initiation of strain localisation, for case I but not that much for case II. Thus, it can be predicted that the final failure will be triggered by void nucleation and growth at a comparatively lower strain level for case I than that for case II.
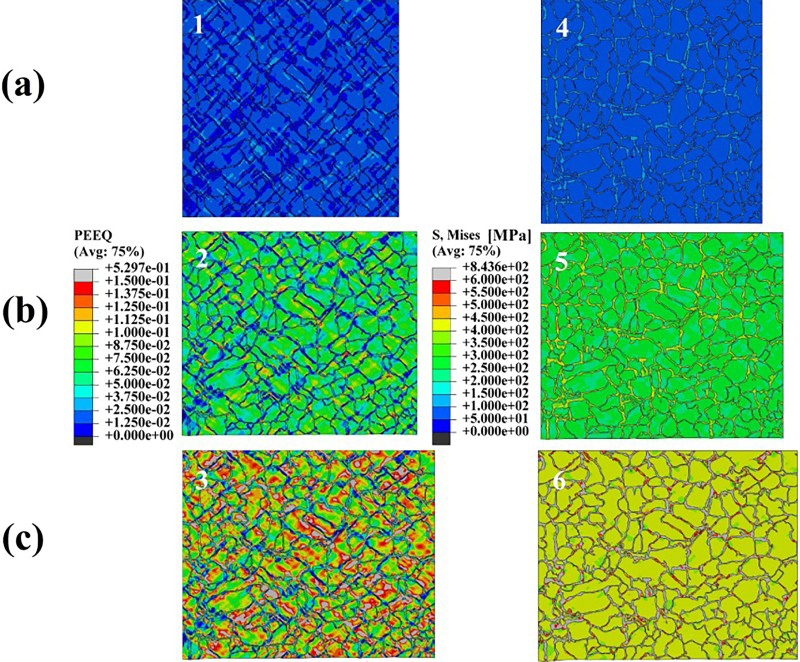
Equivalent plastic strain (1–3) and von Mises stress (4–6) distribution at different strain levels of R60GR, with case II boundary condition; strain levels are a 1.35%, b 5.4% and c 9%
The casting method has an influence on a different microstructure generation. Different grain size, shape and their distribution are controlled by the casting process. In this case, small and near spherical shape of grains has been achieved by rheocasting of grain refined alloy using the cooling slope, placed at 60° angle with the horizontal axis. The volume fraction of the primary Al phase is much higher than that of the eutectic, which increases the significance of the primary phase on the failure mode of the rheocast materials. That is why, the contours of the equivalent plastic strain and von Mises stress for the primary Al phases, simulated according to the case I boundary condition, are shown at the same strain level of 4%, in Fig. 17. Plastic strain bands with higher intensity are observed in the sites where von Mises stresses are localised, as shown using circles in Fig. 17. The primary Al phase experiences localised straining or shear localisation due to relative displacement between the constituent phases. Difference in yielding (plastic instability) triggers void nucleation and subsequent growth, which leads to the final failure of the material. Sharp edges of the hard eutectic phase create a stress concentrated zone, and strain is highly localised on the subsequent primary Al phase, as shown in Fig. 17a1 using the arrow head. It is also observed that severe strain bands are localised between the close spaced eutectic phases, as indicated by the arrow head in Fig. 17b1 and c1. These sites are expected to be the void nucleation points as they are incapable of load bearing, and they will rupture in the final stages of uni-axial tensile loading. The stress and strain distribution shown in Fig. 17, for the respective materials, unlocks the reason behind the ductility improvement observed in the case of rheocast alloys compared to the conventional directly poured one.
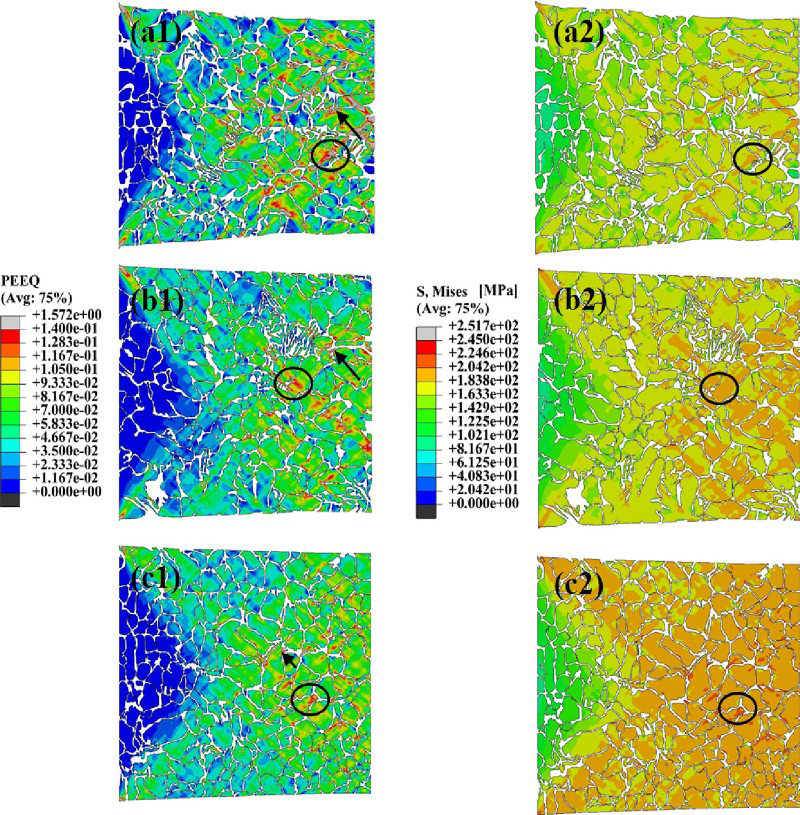
a1–c1 Equivalent plastic strain and a2, b2 and c2 von Mises stress distribution on primary Al phase of different samples at same strain level of 4% in line with case I boundary condition (a1 and a2 DP, b1 and b2 R45GR, c1 and c2 R60GR)
A quantitative representation of the relation between the degree of strain localisation and the primary phase morphology (shape, size) and volume fraction is shown in Fig. 18 (derived from Fig. 17). Fig. 18 shows the plot of node frequency versus the degree of equivalent plastic strain (PEEQ), at same strain level of 4%, for the respective materials. The nodes are selected from the strain localisation range (0.1–0.15 PEEQ) to obtain the frequency of the nodes present in the region. The strain localisation region is the critical zone, which is mainly responsible for the crack initiation and final failure at some higher strain level. From Fig. 18, it is clearly visible that at the same strain level, DP has more critical number of nodes rather than rheocast materials. Thus, it can be concluded from the above mentioned discussion that enhanced sphericity, volume fraction and reduced grain size of the primary Al phase (shown in tabular format in Fig. 18) are responsible for the improvement of the mechanical properties of the rheocast material compared to its conventional cast counterpart.
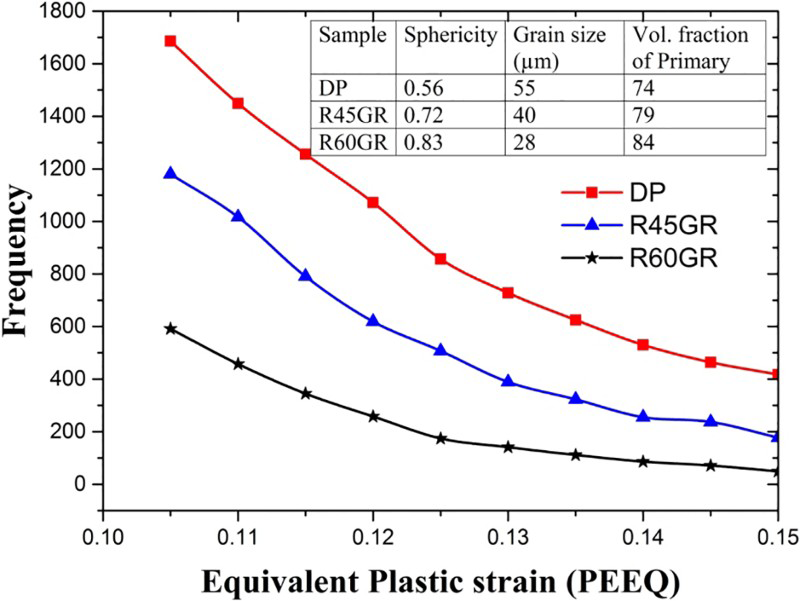
Quantitative representation of relation between degree of strain localisation and primary phase morphology (shape, size) and volume fraction
Comparison with experimental findings
Figure 19 shows the SEM images of the cast samples, studied in the present work, that failed under tensile loading. The fracture surface of the low superheat cast sample (DP) shows mostly facets, which signifies a quasi-cleavage fracture (Fig. 19a and b). In this case, shrinkage porosities play the role of fracture initiation sites, and then, the crack propagates by fracturing the eutectic Si particles, which results in the generation of facets, whereas grain refined samples cast using a 45° slope (R45GR) also shows facets due to its degenerated dendritic microstructural morphology (explained earlier) (Fig. 19c and d). Improved mechanical behaviour of the R60GR sample is evident from the presence of dimples in the fractograph, which originates due to the fracture of the ductile primary Al phase. The fracture surfaces of the R60GR sample (Fig. 19e and f) signify a mixed mode fracture behaviour as both dimples and facets can be observed, which points towards its significantly improved microdeformation behaviour compared to those of the other samples studied in the present work. Thus, experimental fractographs qualitatively confirm the accuracy of the micromechanics based simulations performed here, considering the RVEs of the actual microstructure.
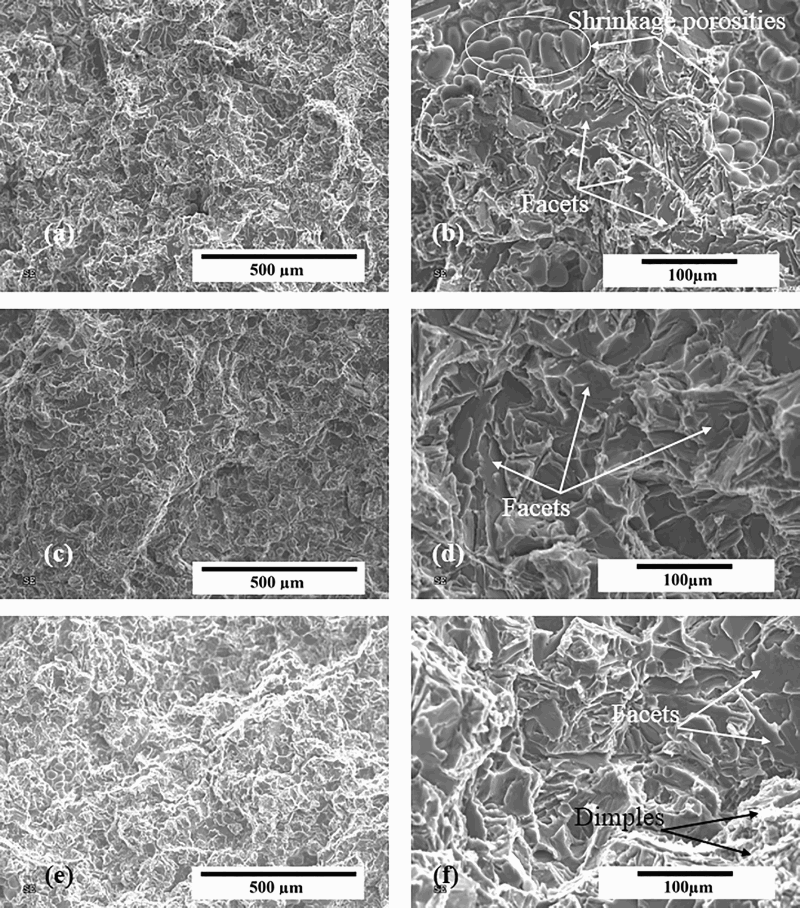
a direct pouring ( × 100); b direct pouring with × 2000; c 45° slope angle grain refined ( × 100); d 45° slope angle grain refined with × 2000; e 60° slope angle grain refined ( × 100); f 60° slope angle grain refined with × 2000Images (SEM)
Conclusions
The microscale deformation behaviour of the Al–7Si–0.3Mg alloy has been investigated following micromechanics approach to get insight into the effect of microstructural features on overall material behaviour at the macroscale. Prediction has been made on the deformation behaviour and failure mode of the grain refined rheocast alloy, in comparison to the conventional cast one. The plastic instability is triggered by the microstructure in-homogeneity, as it is the only imperfection between the phases of the alloy under investigation. Failure modes of the cast alloy are found to be dependent on size, shape and orientation of the primary Al grains. In-homogeneity of the microstructure or irregular shape of the grains leads to plastic strain localisation and generates stress concentration sites. Local shear failure occurs at the strain localised zone, and it can be predicted as the microvoid formation site, which is responsible for failure initiation. In the present endeavour, it should be mentioned that no damage criterion/model has been applied in the present simulations, since the present study is aimed to reveal the state of stress/strain prevails within the material at the microscale, before the final fracture. However, the simulation findings points towards the transition of the fracture behaviour of the A356 alloy from intergranular fracture in the case of the conventional cast state to the transgranular one in the case of the rheocast state. The fracture surfaces of the tensile tested samples also support this claim. Shear failure mode can be predicted for the materials studied here, as the plastic strain bands are found to be localised at an angle of 45° with the loading direction or along the maximum shear plane direction. Comparing all three materials, it can be concluded that a 60° inclination angle of the cooling slope gives a higher ductility and better plastic flow properties, as it generates smaller and near spherical primary Al grains with a higher volume fraction, compared to the other cases. Finally, the findings obtained in the present study can be useful to establish the effective process control and to optimise the process variables of the cooling slope rheocasting technique to enhance the sphericity of the primary Al grains and achieving their desired size, orientation and distribution in the cast billets to obtain further improvement in the mechanical properties of the rheocast billets.
Footnotes
Acknowledgements
The authors would like to acknowledge the funding from CSIR-CMERI under grant no. OLP121212 and thank Director, CSIR-CMERI, Durgapur, for his continuous encouragement. The authors also acknowledge the efforts of all the members of the NNMT group towards the successful completion of this research work. The authors also would like to thank the independent reviewers of the manuscript for their interest to the present work and their valuable comments towards improving the quality of the present manuscript.