
Abstract
The effects of solution treatment and large strain rolling (LSR) on the microstructure and mechanical properties of Mg–10.73Li–4.49Al–0.52Y alloy were investigated. Results showed that after solution treatment, α-phase and AlLi phase were dissolved into β matrix, which led to the increase of strength. With the increased temperature of LSR, new phase MgLi2Al (θ-phase) and AlLi phase precipitated from the matrix in turns. The Mg–Li alloy rolled at 623 K with 75 reduction showed the ultimate tensile strength of 328 MPa, which was more superior to many other Mg–Li alloys. The excellent strength could be explained by the mechanisms of solution strengthening and fine grain strengthening.
Introduction
Mg–Li alloy is one of the lightest structural metallic materials, which shows great potential in transportation systems and electric equipments due to the high specific strength and good formability at ambient temperature.1,2 Furthermore, The addition of Li to magnesium alloy can not only reduce its density but also markedly improve the formability by changing the crystal structure from hexagonal close packed to body centred cubic (BCC) when the amount of Li exceeds 11 wt-. 3 The β-phase Mg–Li alloy has lower density and better formability than other α-phase or (α+β)-phase alloys. However, with the increasing amount of Li, the Mg–Li alloy presents lower strength and poorer corrosion resistance, which limits its application. Ternary or quaternary β-phase Mg–Li alloy is designed to overcome these drawbacks. It has been demonstrated that with the addition of Al or Zn element, the tensile strength and hardness of Mg–Li–Al or Mg–Li–Zn ternary alloy increases significantly due to solution and precipitation strengthening.4,5 However, the stability of these alloys is relatively poor, because the θ-phase (MgLi2Al) or θ′-phase (MgLi2Zn) is a metastable strengthening phase, which is liable to decompose to AlLi phase (a softening phase) during ambient or high temperature aging process.6,7 Therefore, other elements, such as Ag, 1 Ca, 8 Ce or other Re,9–11 have been added to stabilise the mechanical properties of the alloys.
Besides microalloying of magnesium, various kinds of thermomechanical treatments, such as conventional rolling and extrusion12,13 and severe plastic deformation (SPD), have been used to improve the strength of metallic materials by refining their microstructure. It is accepted that SPD is one of the most effective ways to fabricate materials with fine or ultrafine grains; however, most of the SPD technologies have complex process and are difficult to be applied in the industry. It is noteworthy that as one of the SPDs, large strain rolling (LSR) could obtain fine or ultrafine microstructure with inexpensive and simple methods. Pérez-Prado et al. 14 reported AM60 alloy with the significant increasing ultimate strength of 378 MPa processed by LSR. Xu et al. 15 studied the Mg–8.2Gd–3.8Y–1.0Zn–0.4Zr alloy after LSR with total reduction of 96. The microstructure was significantly refined and became much more homogeneous. The alloy exhibited excellent mechanical properties with ultimate strength of 403 MPa and elongation to failure of 13.7 at room temperature along the rolling direction (RD). However, there are few studies on the preparation of Mg–Li alloy by the LSR process.
In the present investigation, Y element is added in Mg–Li–Al alloy to improve the stability of mechanical properties. Then, solution treatment and LSR process with single pass reduction of 50 and total reduction of 75 are imposed on the as cast alloy. Last, the effects of both solution treatment and LSR process on the microstructure and mechanical properties of the alloy are investigated.
Experimental
The Mg–10.73Li–4.49Al–0.52Y alloy used in this experiment was prepared in a vacuum induction furnace at an atmosphere of pure argon. Plates with 50 mm in the RD, 30 mm in the transverse direction (TD) and 10 mm in the normal direction (ND) were cut directly from the as cast ingot and were solution treated at 623 K for 3.5 h and then quenched in water. To prevent oxidation, the plates were clad with aluminium foil and then covered with powdered graphite during solution treatment.
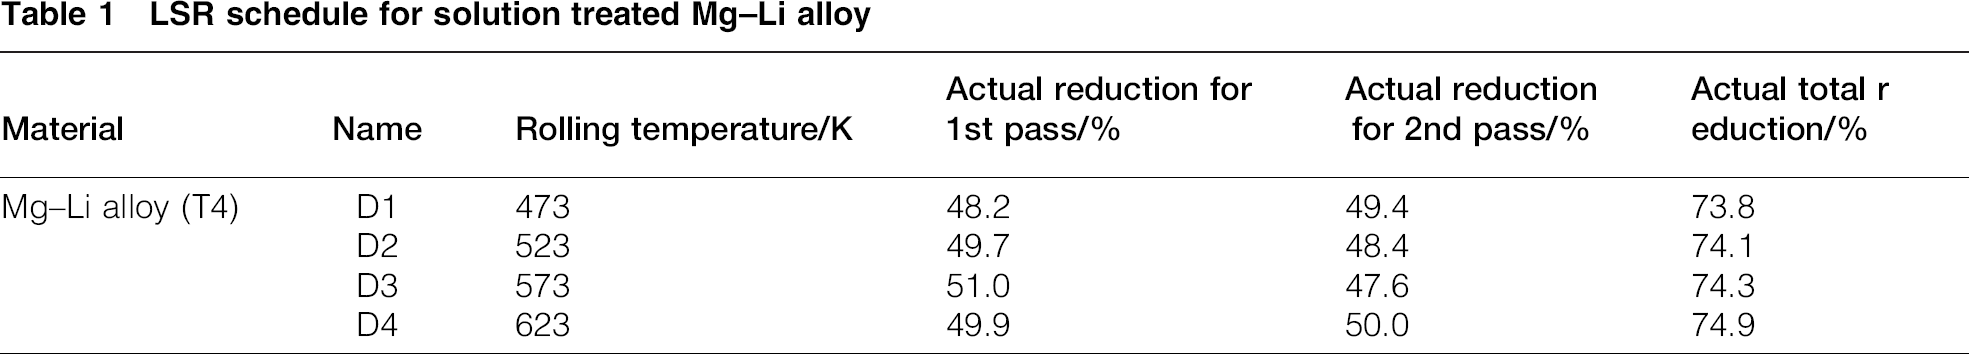
The LSR process of the solution treated plates was conducted for two passes with the temperature range from 473 to 623 K. The reduction in thickness of the plates was ∼50 for each pass, which resulted in a total reduction of 75. Before each passes, the plates were reheated for 10 min. The detailed LSR schedule was summarised in Table 1.
LSR schedule for solution treated Mg–Li alloy
Specimens for microstructural examination were cut in the ND-RD plane of the rolled plates and then etched with a solution of 4 vol.- nitric acid in alcohol. Microstructure observation was performed using a Leica DMI 5000 optical microscope. ASTM E112 standard was used to calculate the average grain size. A Phenom PROX scanning electron microscopy (SEM) equipped with energy dispersive spectrometer (EDS) was used to examine the distribution of element for the as cast and solution treated Mg–Li alloys. X-ray diffraction (XRD) measurement of the phases in the alloys conducted on TD-RD plane was detected by a Bruker D8 Advance diffractometer using Cu Kα X-ray tube operated at 40 kV voltages under a scanning speed of 0.2° s− 1.
Tensile specimens with gauge length of 5 mm and cross-section of 3 × 2 mm2 were cut from the samples of as cast and solution treated Mg–Li alloys and from the plates processed by LSR parallel to RD. Tensile test was performed on a SANSCMT 5105 universal testing machine with an initial strain rate of 2.0 × 10− 3 s− 1 at room temperature. The fracture morphology of specimens after tensile testing was observed by SEM (NOVA NANOSEM 430, FEI, USA).
Results
Microstructure of as cast and solution treated Mg–Li alloy
The microstructure of as cast and solution treated Mg–Li alloy is shown in Fig. 1. Previous study indicated that the experimental alloy is mainly made up of β-phase, while small fraction of α-phase disperses in the β-matrix and along the phase boundary. 16 In addition, there are many precipitate phases of Al2Y and AlLi dispersed in the grain. It can be seen from Fig. 1a that the β-phase presents equiaxed grains with the grain size between 300 and 1000 μm. As shown in Fig. 1b, no noticeable change in the grain size is observed in solution treated specimen, as compared with the as cast one. Figures 2 and 3 show the EDS elemental mapping (consisting of Mg, Al and Y distribution) and XRD spectrum respectively. It reveals that after solution treatment, both AlLi phase and α-phase (in the β-matrix and along the β-phase boundary) disappear and only Al2Y phase remains, which demonstrates that both AlLi and α-phase have dissolved in the β-matrix.
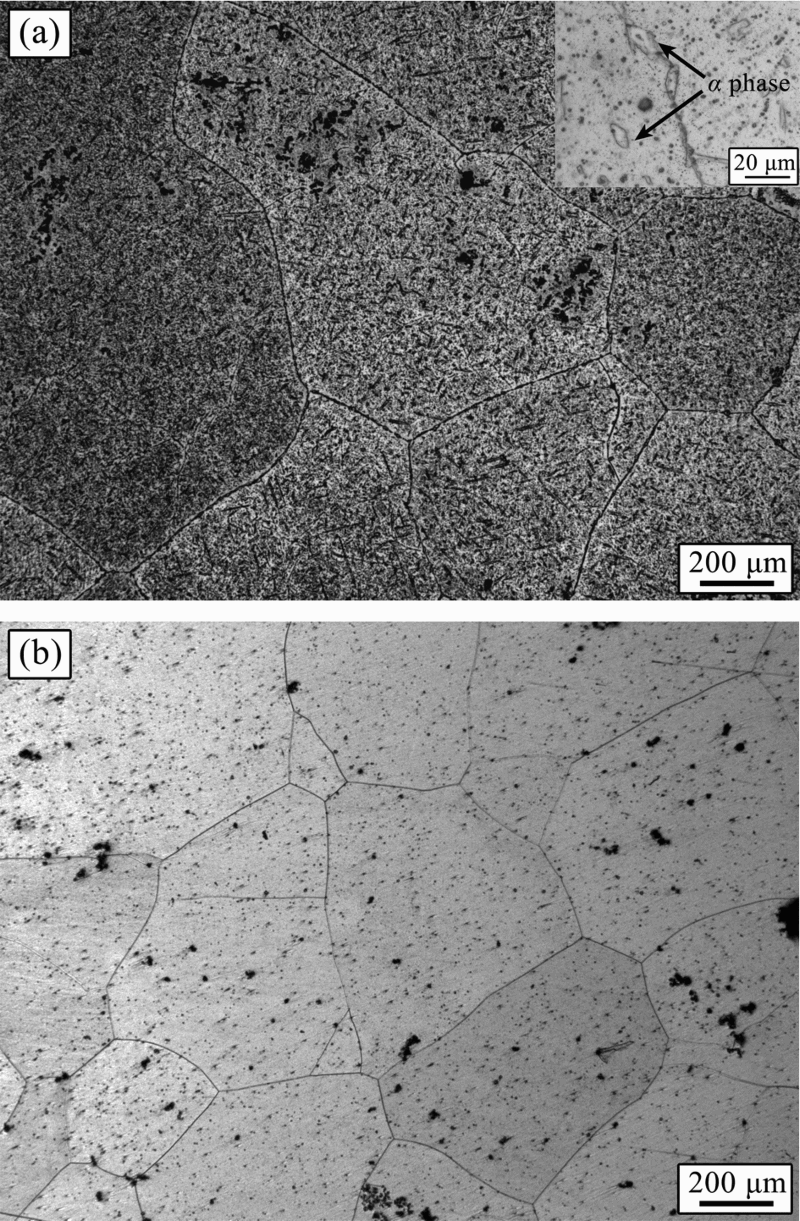
Microstructure of a as cast and b solution treated Mg–Li alloys
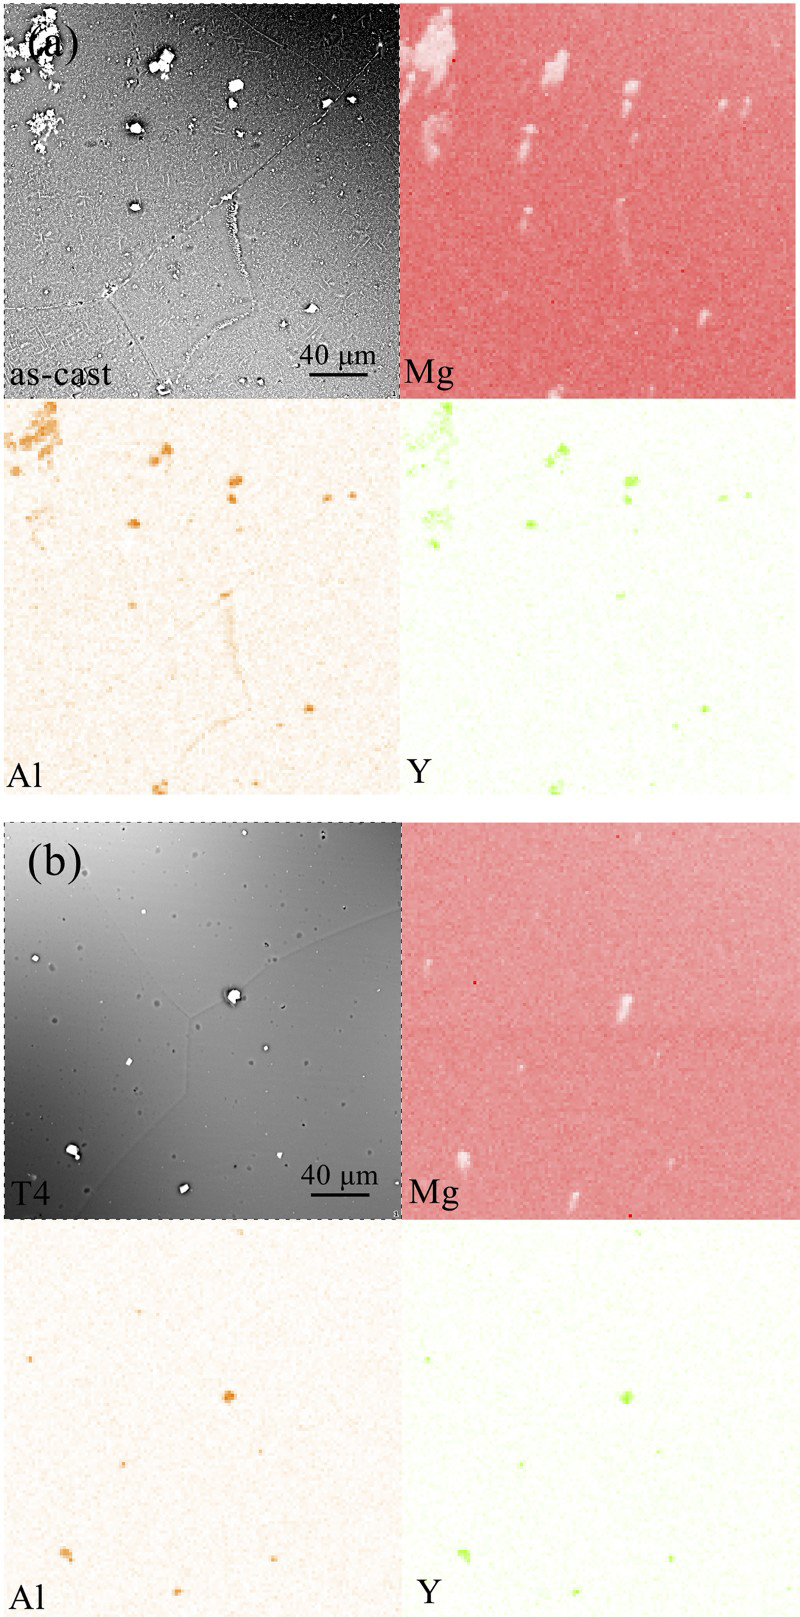
Typical SEM image of a as cast and b solution treated Mg–Li alloys and elemental mapping of Mg, Al and Y by EDS
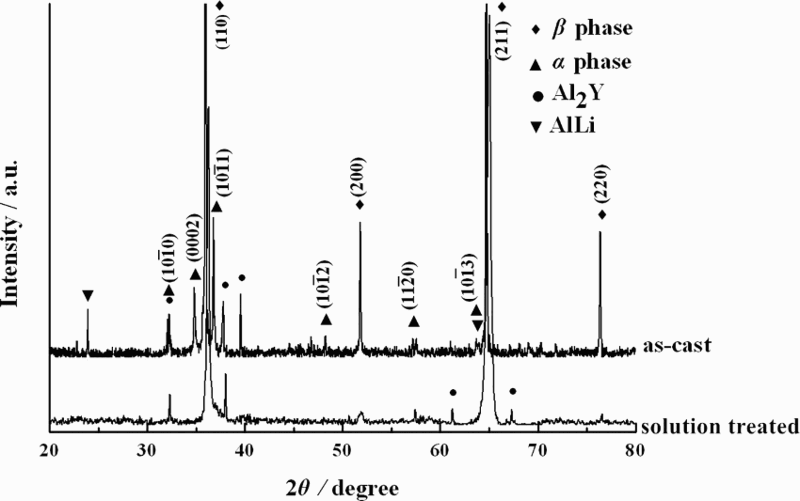
XRD patterns of as cast and solution treated Mg–Li alloys
Microstructure of LSRed Mg–Li alloy
Figure 4 shows the microstructure of Mg–Li alloys after second LSR at different temperatures. The Mg–Li alloy exhibits a typical fibrous rolling texture, in which β-phase and other precipitated phases are elongated approximately parallel to the RD (as shown with a black arrow in Fig. 4a). No obvious dynamic recrystallisation occurs during the LSR at 473–523 K, while some small recrystallised grains align in the RD at 573 K. As shown in Fig. 4e and f, a necklace-like structure containing fine dynamic recrystallisation grains ∼4.4 μm and coarse grains ∼126.4 μm in width is formed when the LSR temperature reaches 623 K. It is considered that the necklace-like structure is caused by the continuous dynamic recrystallisation (CDRX).17–19 Generally, twin dynamic recrystallisation or low temperature dynamic recrystallisation is likely to occur in the Mg alloy with certain strain at 473 K or below due to the low stacking fault energy (SFE). 20 In the present study, however, the nucleation of DRX by twin formation is not revealed in LSR Mg–Li alloy at 473 K (Fig. 4a). Furthermore, no evidence of DRX associated with other mechanism can be seen when temperature reaches 523 K. It can be explained by the faster diffusion rate of β-phase and the higher SFE of BCC Mg–Li alloy, which will promote the dynamic recovery and hinder the formation of DRX nuclei.21,22
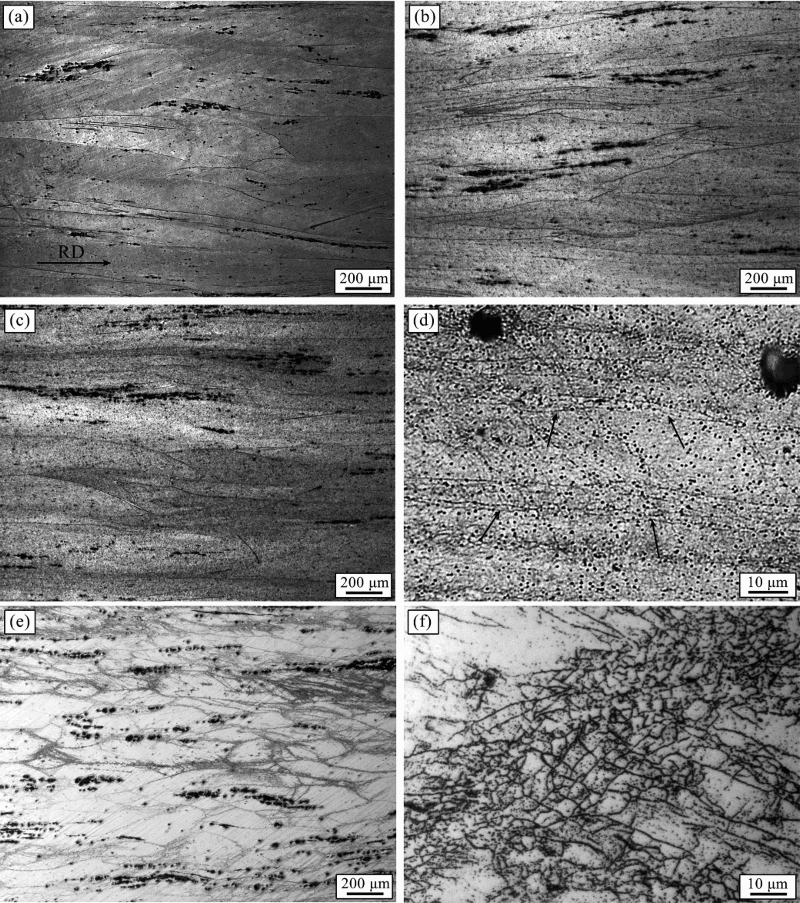
Microstructure of a D1 treated, b D2 treated, c, d D3 treated, and e, f D4 treated Mg–Li alloys
Figure 5 shows the XRD spectra of Mg–Li alloy after the second pass LSR at 473–623 K. As can be seen, newly formed θ-phase (MgLi2Al) precipitates from β-phase after LSR at 473–523 K, while AlLi phase precipitates at 573 K. However, there are no obvious changes when the temperature reaches 623 K. Figure 6 shows the XRD spectra of Mg–Li alloy after first and second pass LSR at 523 K. It can be seen that θ-phase precipitates from β-phase after the first pass, while θ-phase and AlLi phase coexist after the second pass. It is demonstrated that θ-phase is a metastable phase, 1 which is liable to be transferred to the AlLi phase during the preheating before the second pass LSR at 523 K.
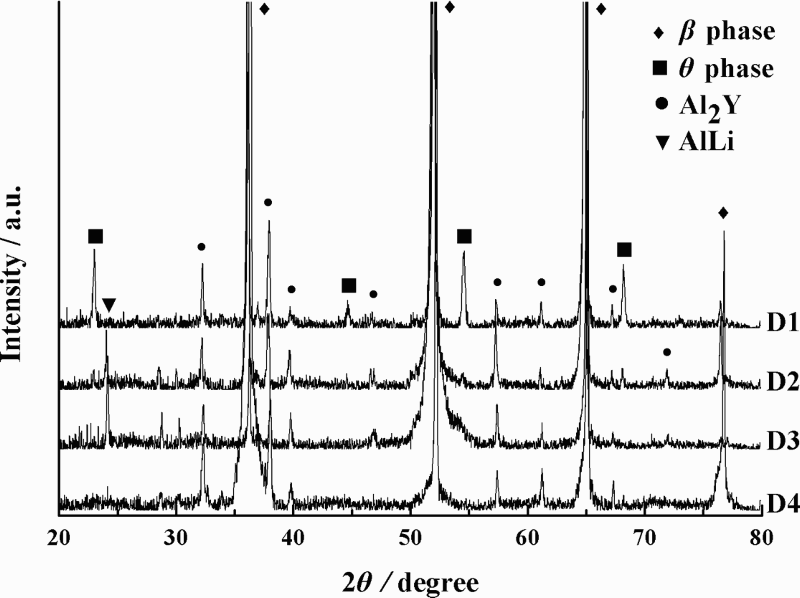
XRD patterns of Mg–Li alloy after second LSR at 473–623 K
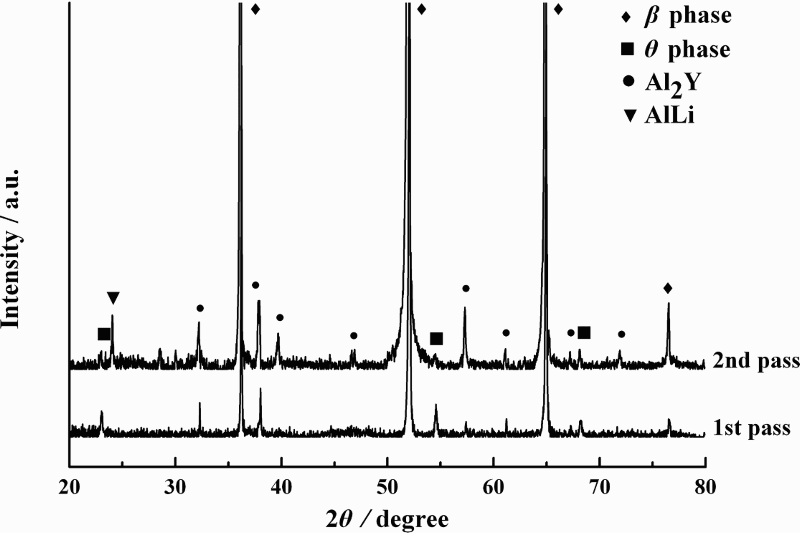
XRD patterns of Mg–Li alloy after LSR at 523 K
XRD patterns of β-phase in Mg–Li alloy after the second LSR at 473–623 K are shown in Fig. 7. Compared with Fig. 3, Fig. 7 shows that the Mg–Li alloy possesses strongest (200)β peak intensity after the second LSR at 473–573 K. It is reported that cold rolled BCC metals tend to have {100}β planes parallel to the rolling plane. 6 This feature is conductive to plasticity parallel to the RD of the Mg–Li alloy. As seen in Fig. 7, the β-phase is transferred to have the strongest (110)β peak intensity when the LSR temperature reaches 623 K. As mentioned above, significant CDRX takes place in the Mg–Li alloy during this process, which might be the reason for such change.
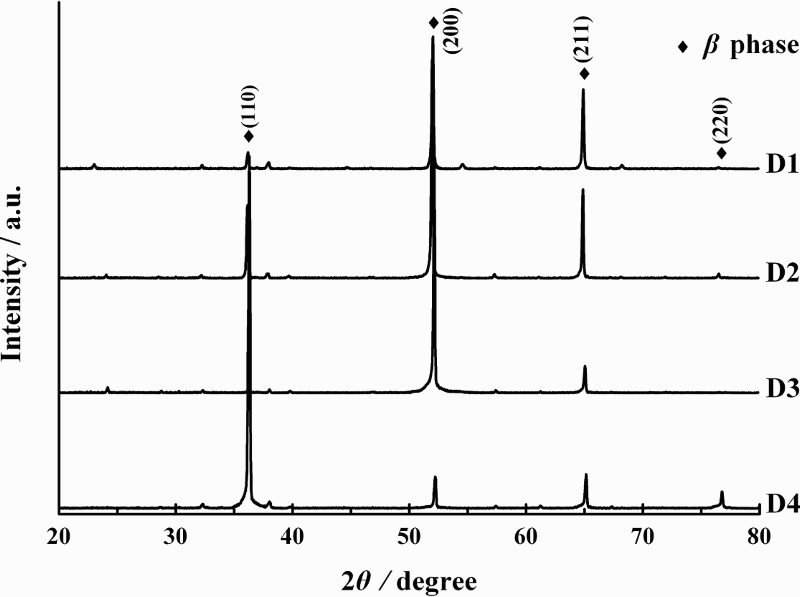
Indices of crystal faces of β-phase in Mg–Li alloy after second LSR at 473–623 K
Mechanical properties of Mg–Li alloy before and after LSR
Figure 8 shows the tensile stress–strain curves of Mg–Li alloy before and after the LSR process. The ultimate strength and elongation of as cast Mg–Li alloy are 131 MPa and 47.1 respectively. After solution treatment, the ultimate strength increased to 194 MPa and the elongation decreased to 1.2.
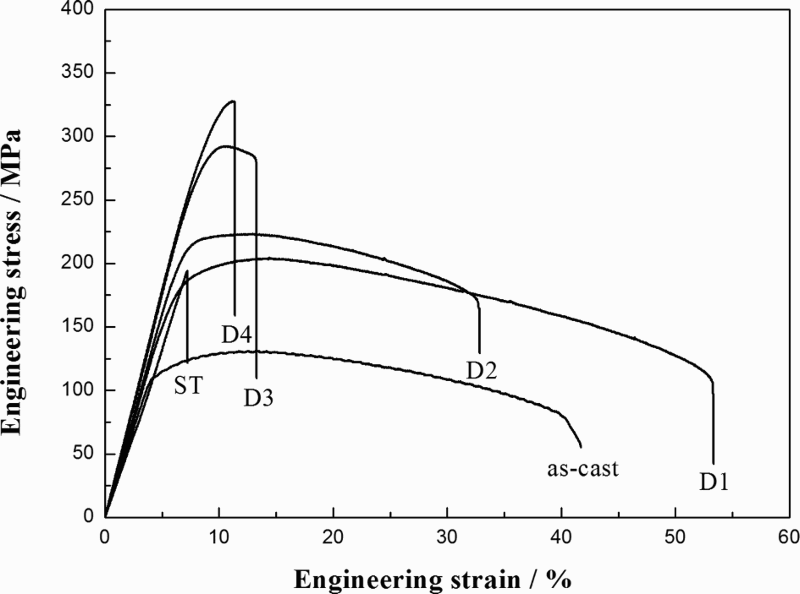
Engineering stress–strain curves of Mg–Li alloys with different processes tested along RD at ambient temperature
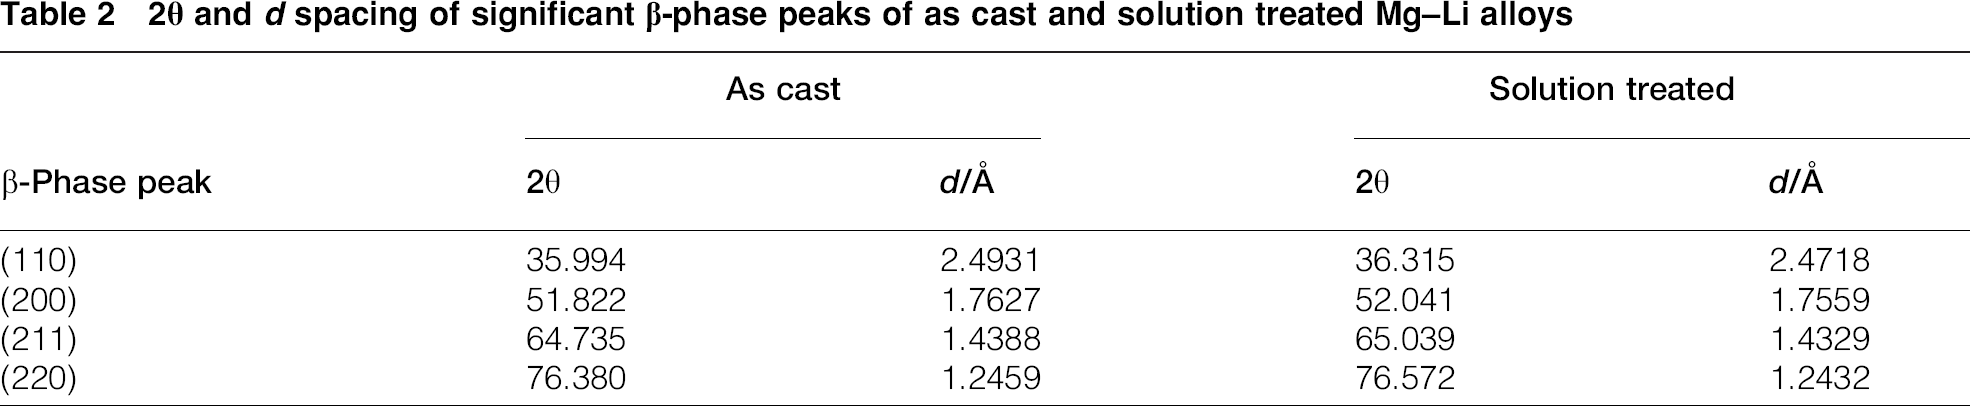
Carefully examining Fig. 3, it can be found that XRD peaks of β-phase have shifted slightly to higher 2θ after solution treatment. According to Fig. 3, the plane spacing dhkl of the significant (hkl)β X-ray peak is calculated for Mg–Li plates before and after solution treatment, and the result is shown in Table 2. As can be seen, the dhkl value for each (hkl)β peak decreases when the Mg–Li alloy is solution treated. The atomic radii of Mg and Al are 0.160 and 0.143 nm respectively. 6 Thus, large amount of Al element is dissolved into the β-matrix after solution treatment, which would lead to the decrease of dhkl value for (hkl)β peaks and would result in the increase of interatomic bonding force and hinder the movement of dislocation. Such significant effect of solution strengthening leads to the obvious increase of strength and decrease of plasticity of solution treated Mg–Li alloy.
2θ and d spacing of significant β-phase peaks of as cast and solution treated Mg–Li alloys
As can be seen from Fig. 8, with the LSR temperature rising, the strength of Mg–Li alloy increases, which is the result of various effects of strengthening mechanism. Compared with solution treated Mg–Li alloy, the grain size of D1 and D2 samples decreases to some extent, which is favourable for the strength. In addition, the θ strengthening phase that precipitates from the β-phase can further improve the strength. Small recrystallised grains appear when the LSR temperature reaches 573–623 K, which significantly impedes the slide of the dislocation and improves the strength of the Mg–Li alloy. Furthermore, the phase composition of D4 sample is the same with the solution treated Mg–Li alloy, which means that the solution strengthening is the other important reason for the increase of strength.
The elongation of the Mg–Li alloy after LSR at 473–523 K increases significantly compared with the solution treated alloy, which is due to the existence of (200)β texture paralleled to the RD plane. However, non-uniform microstructure caused by CDRX weakens the effect of rolling texture to the plasticity when the LSR temperature reaches 573 K. So, the elongation of D3 sample is only 7.8. The rolling texture is replaced by (110)β recrystallisation texture after the LSR process at 623 K, resulting in the poorer elongation compared to the Mg–Li alloy by the LSR process at 473–573 K.
The mechanical properties tested at ambient temperature of D2 and D4 samples and other Mg–Li alloys are listed in Table 3. It can be seen that the Mg–Li alloys processed by the LSR exhibit superior strength and keep a certain plasticity.
Summary of mechanical properties tested at room temperature of different Mg–Li alloys
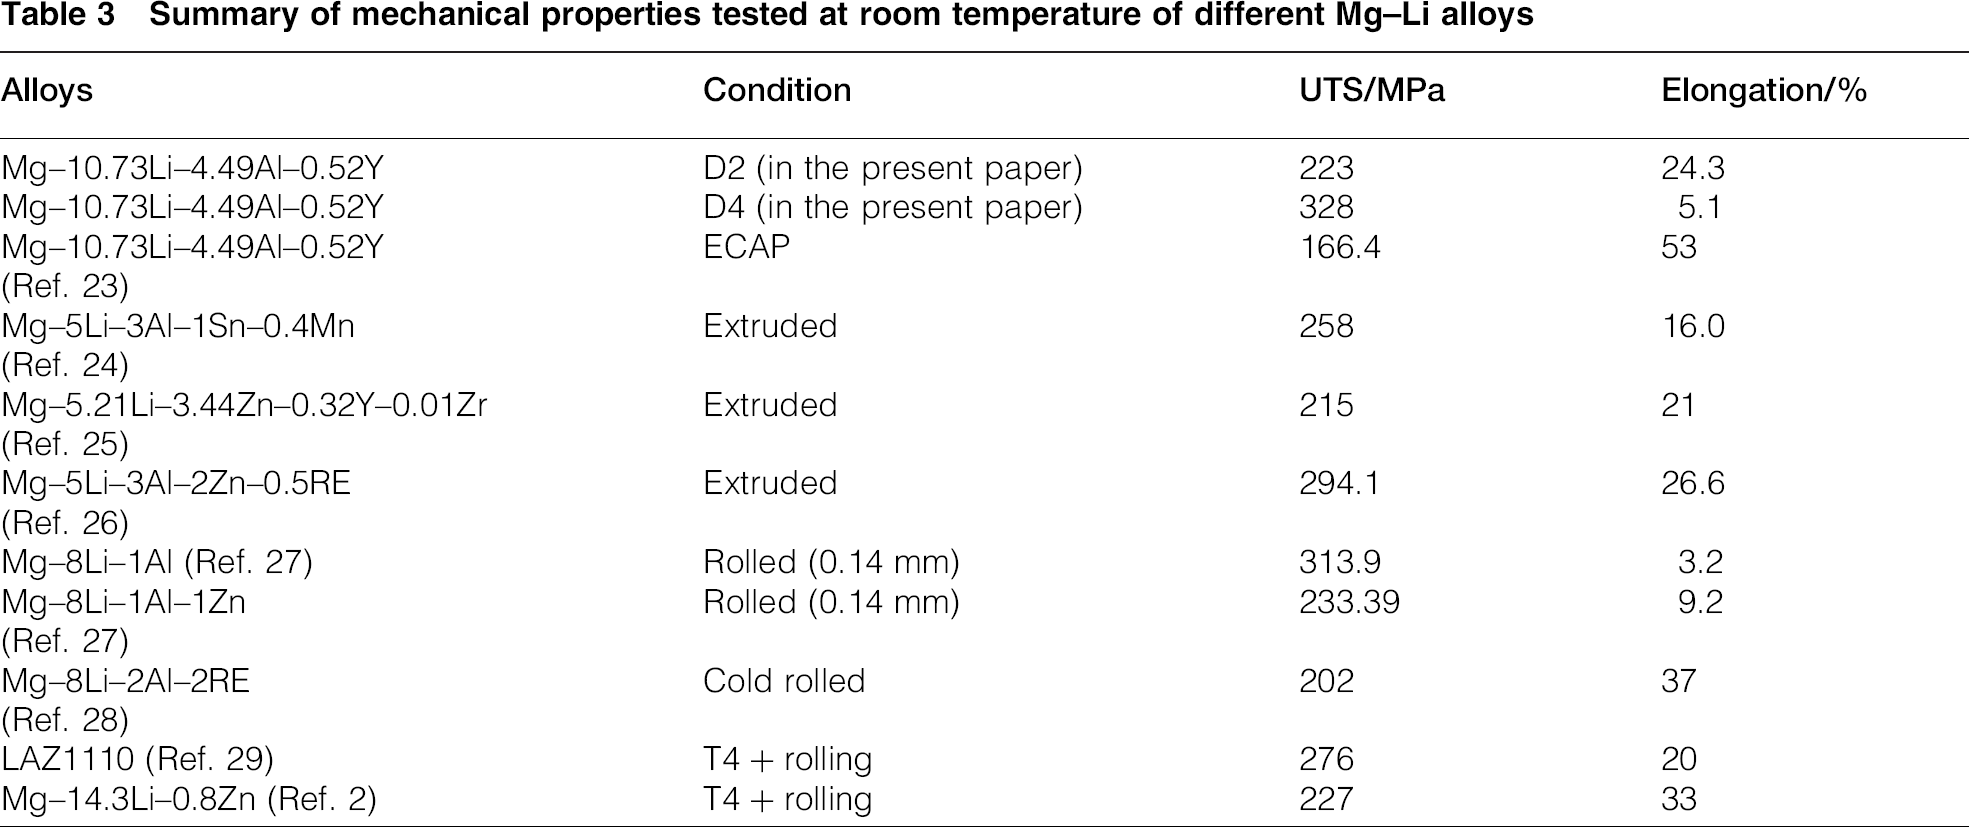
Figure 9 shows SEM images of the tensile fracture surfaces for the Mg–Li alloys before and after LSR. Figure 9a is the image of as cast specimen. The fracture surface is mainly composed of large dimples and a small quantity of cleavage planes. After solution treatment, typical characteristics of brittle fracture with large river pattern can be seen from the fracture surface of the specimen (Fig. 9b). The SEM images of D2 specimen in Fig. 9c and d show a ductile fracture surface, in which a large number of deep dimples can be observed. When the temperature of the LSR process reaches 623 K, as shown in Fig. 9e and f, the fracture surface of D4 specimen is composed of many large cleavage planes except small dimples, indicating that the brittle fracture is the primary characteristics of the alloy but ductile characteristics still exist.
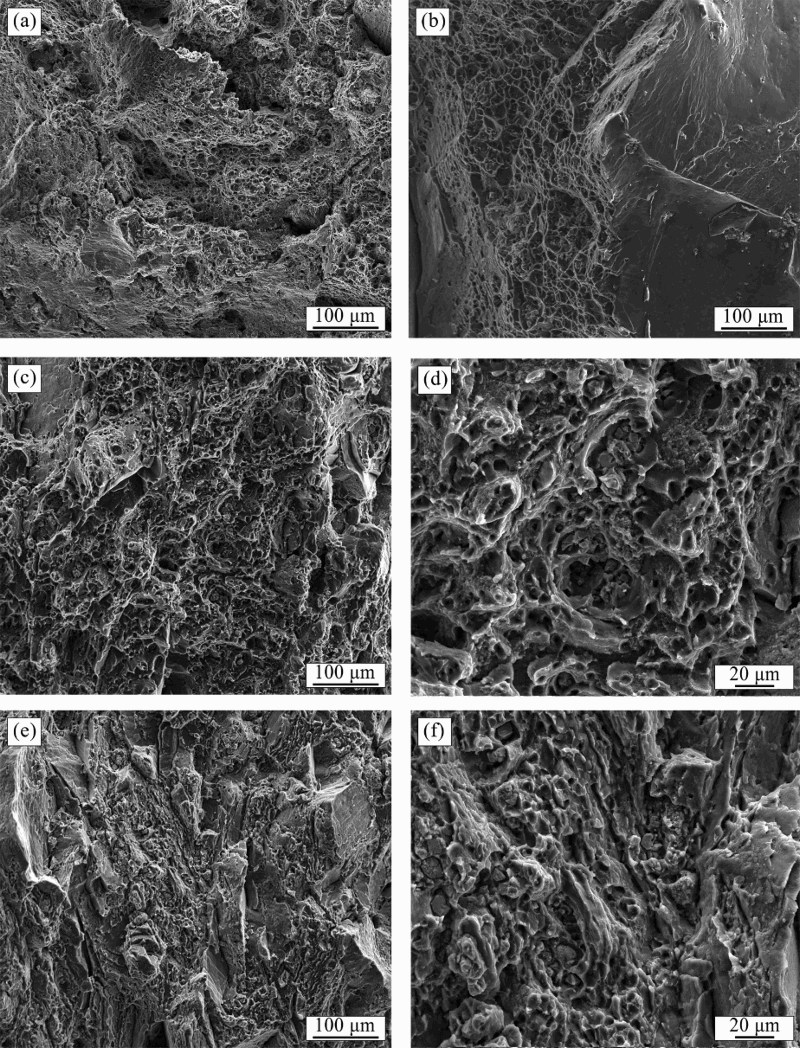
Fractured surfaces of a as cast, b solution treated, c, d D2 treated, and e, f D4 treated Mg–Li alloy
Conclusions
The microstructure and mechanical properties of Mg–10.73Li–4.49Al–0.52Y alloy processed by solution treatment and LSR have been investigated. The following conclusions could be drawn from this study:
The as cast Mg–Li alloy was composed of β-phase, α-phase, Al2Y phase and AlLi phase. After solution treatment, the Al2Y phase and AlLi phase were dissolved into the β-matrix, while no significant change could be seen from the grain size. With the increase of deformation temperature, the θ-phase and AlLi precipitated from the β-matrix. All the specimens exhibited a typical fibrous rolling texture with (200)β texture paralleled to the RD plane after LSR at 473–573 K. When the deformation temperature reached 623 K, typical necklace-like microstructure appeared due to the effect of CDRX, and the rolling texture was replaced by (110)β recrystallisation texture. Owing to the effects of solution strengthening and fine grain strengthening, the UTS of the Mg–Li alloy after rolling at 623 K with 75 reduction significantly increased to 328 MPa.
Footnotes
Acknowledgement
This work was supported by the Guangzhou Science and Technology Development Program [grant no. 2009Z2-D811].