
Abstract
We have applied thermodynamic databases, which are generally used for the evaluation of phase diagrams and chemical reactions in multicomponent systems, to the calculation of the surface tension of liquid alloys, molten salt mixtures and molten slag. In addition, phase diagrams in nanosized particle alloy systems, which are affected by the surface energy, are also shown with some models and procedures to evaluate the above surface properties.
Introduction
During the last three decades, various thermodynamic databases have been compiled to be mainly applied to the calculation of phase diagrams of alloys, salts and oxides. The accumulation and assessment of thermodynamic data and phase equilibrium information to establish those databases is sometimes called CALPHAD (Computer Calculation of Phase Diagrams) approach (Nishizawa, 1992). The CALPHAD approach has been recognised to be useful in various aspects of metallurgical science and engineering (Nishizawa, 1992). If it would be possible to use the thermodynamic databases to evaluate surface properties as well as phase equilibria, we could not only widen the applicability of those thermodynamic databases but also further the understanding of the physicochemical properties of liquid alloys, molten ionic mixtures, etc.
On the basis of the above concepts, we have applied those thermodynamic databases to the calculation of the surface tension of liquid alloys (Tanaka et al., 1996, 1999, 2001), molten ionic mixtures (Tanaka et al., 1998, 2006; Tanaka and Hara, 1999a; Ueda et al., 1999) and molten slag (Tanaka et al., 2006; Hanao et al., 2007; Nakamoto et al., 2007a, b), the interfacial tension between liquid iron alloy and molten slag (Tanaka and Hara, 1999b) and nanoparticle phase diagrams (Tanaka and Hara, 2001a, b; Lee et al., 2005).
In the present paper, some of the examples on the above evaluation of the surface properties of alloys, molten ionic mixtures and molten slag were described.
Evaluation of surface tension of alloys
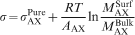
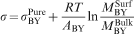
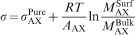
The surface tension σ of liquid A–B binary alloy is evaluated from the following equations (Tanaka et al., 1996, 1999, 2001) based on Butler's equation (Butler, 1932)
 is the molar surface area in a monolayer of pure X (N0 is Avogadro number and VX is molar volume of pure liquid X).
 and
and
 are mole fractions of a component X in a surface and a bulk respectively.
 and
and
 are partial excess Gibbs energies of X in the surface and the bulk as a function of T and
 or
or
 .
.
The partial excess Gibbs energies in the bulk can be obtained directly from thermodynamic databases. The excess Gibbs energy in the surface is evaluated from the following equations (Tanaka et al., 1996, 1999, 2001) on the basis of the idea proposed by Speiser et al. (1987) and Yeum et al. (1989)
Surface tension of liquid Fe–Si and Cu–Pb alloys
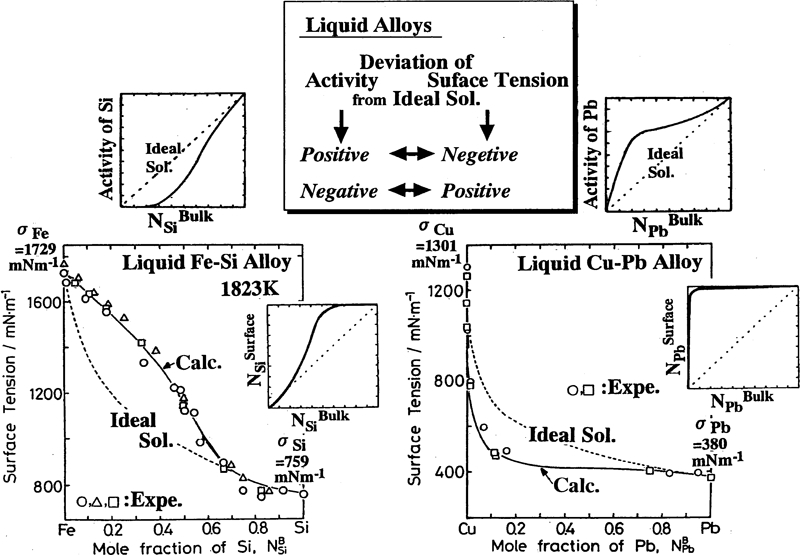
Figure 1 shows that in alloys with negative deviation of activity from the ideal solution (negative excess Gibbs energy) in the bulk (e.g. liquid Fe–Si alloys), the surface tension deviates positively from that of the ideal solution. On the other hand, in alloys with positive deviation of activity from the ideal solution (positive excess Gibbs energy) in the bulk (e.g. liquid Cu–Pb alloys), the surface tensions tend to show negative deviations from that of the ideal solution. This tendency is based on the surface segregation of a component which has lower surface tension of pure metal, and this behaviour can be explained from the above equations (1)–(4). In addition, the surface segregation affects adsorption of oxygen on the surface of liquid alloys.
Evaluation of phase diagrams of nanosized binary alloys
As one of the examples on the application of the surface energy of alloys, we have tried the evaluation of phase diagrams in nanoparticle alloy systems (Tanaka and Hara, 2001a, b; Lee et al., 2005). When pure solid phase is selected as the reference state of Gibbs energy, the total Gibbs energy of an alloy system in a small particle with its radius r is described in the following equations (5)–(8) (Tanaka and Hara, 2001a, b)

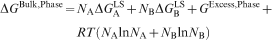
The Gibbs energy of the bulk of A–B binary alloy ΔGBulk, Phase in equation (5), which corresponds to ΔGTotal, Phase with r = ∞, is expressed as follows
 and
and
 are Gibbs energies of pure liquid phases relative to those of pure solid phases. GExcess, Phase is the excess Gibbs energy in A–B alloy.
ΔGSurface, Phase in equation (5), the effect of the surface on ΔGTotal, Phase, is assumed as follows (Tanaka and Hara, 2001a, b)

 and
and
 are surface tensions of pure solid A and B and
 and
and
 are molar volumes of pure solid A and B.
When we have a nanosize particle, the effect of the surface on the Gibbs energy of the particle cannot be neglected although ΔGBulk >ΔGSurface in the bulk size.
The following equation (8) is assumed to express the surface tension
 of pure solid X (Tanaka and Hara, 2001a, b)
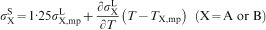
 is the surface tension of pure liquid X at its melting point TX, mp.
The molar volume of alloy VPhase in equation (7) is assumed to be obtained from a simple additivity. The molar volume
 of pure solid X is obtained by considering the volume change due to the fusion at the melting point of each component.
The chemical potentials
 of A and B in solid and liquid phases can be obtained from equation (5) for solid and liquid phases respectively, and the following phase equilibrium conditions are applied to determine the phase equilibrium between solid and liquid phases in a nanoparticle alloy system
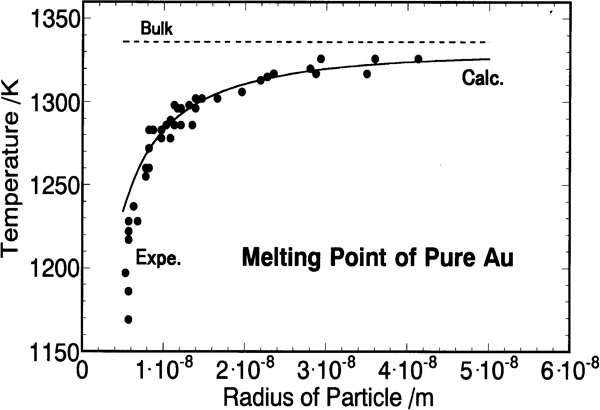
Effect of particle size on melting point of pure Au: experiment
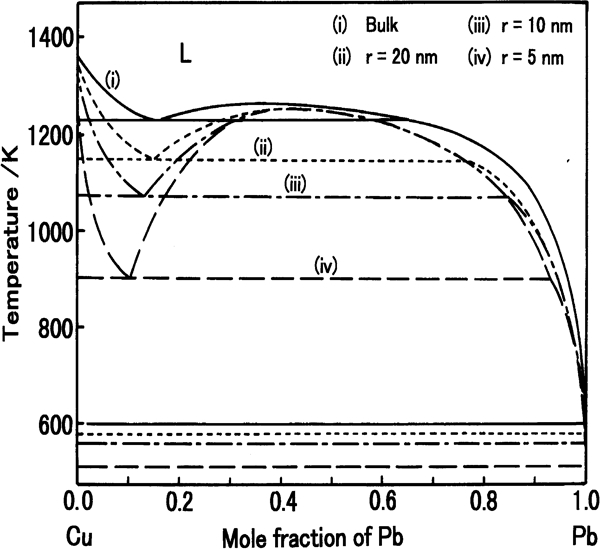
Effect of particle size on phase diagram of Cu–Pb alloy
liquid phase region in the phase diagrams is enlarged as the size of the particle becomes smaller. The change in the phase diagrams with the particle size is remarkable when the size of the particle is <100 nm
in alloys, of which the composition dependence of the surface tension of liquid phase shows large downward curvature, such as Cu–Pb and Cu–Bi alloys, the size of the particle influences largely the phase relations. On the other hand, in an alloy, of which the surface tension of liquid phase changes smoothly with the composition, the effect of the size on the phase relations is not so large. The composition dependence of the surface tension is affected largely by the excess Gibbs energy of liquid phase
phase composition range of a solid solution increases with decreasing size of a particle.
We confirmed the change in melting point of pure metals and phase diagrams in alloys with particle size from direct observation in TEM (Lee et al., 2005, 2006, 2009).
Evaluation of surface tension of molten ionic mixtures
At the present stage, we can evaluate the surface tension of alloys (Tanaka et al., 1996, 1999, 2001) by using Butler's equation (Butler, 1932) with a procedure proposed by Speiser et al. (1987) and Yeum et al. (1989). On the other hand, we cannot apply directly these procedures to evaluate the surface tension of molten ionic mixtures even alkaline halide binary systems, which are the simplest groups in molten ionic mixtures.
The authors have derived the equations (11)–(14) described below on the basis of the following assumptions.
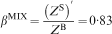
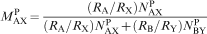
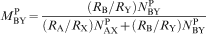
In ionic substances, it is well known that their ionic structures depend upon the ratio of the radius of cation to that of anion (Tanaka et al., 2006). In order to evaluate ionic structure and physicochemical properties of ionic materials, we should consider the ratio of the radius of cation to that of anion. We use the ionic radius fraction considering the ratio of the radius of cation to that of anion instead of mole fractions in the above equations (1) and (2).
Then, we have derived the following equations to evaluate the surface tension σ of molten ionic mixtures
 (N0 is Avogadro number and Vi is molar volume of pure component i) is the molar surface area of pure component i.
The calculated results of the surface tension in various alkaline halide ionic mixtures obtained from equations (11)–(14) are shown in Figs. 4 and 5 with the previous results (Tanaka et al., 1998; Tanaka and Hara, 1999a; Ueda et al., 1999).
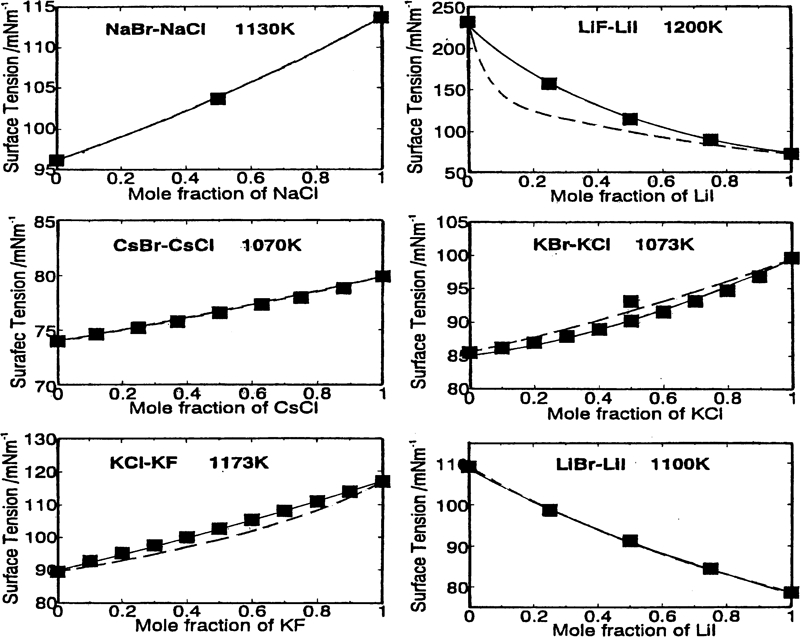
Surface tension of molten alkaline halide systems with common cations: solid curves: present calculation; dashed curves: previous calculation (Tanaka et al., 1998; Tanaka and Hara, 1999a; Ueda et al., 1999); ▪: experiment
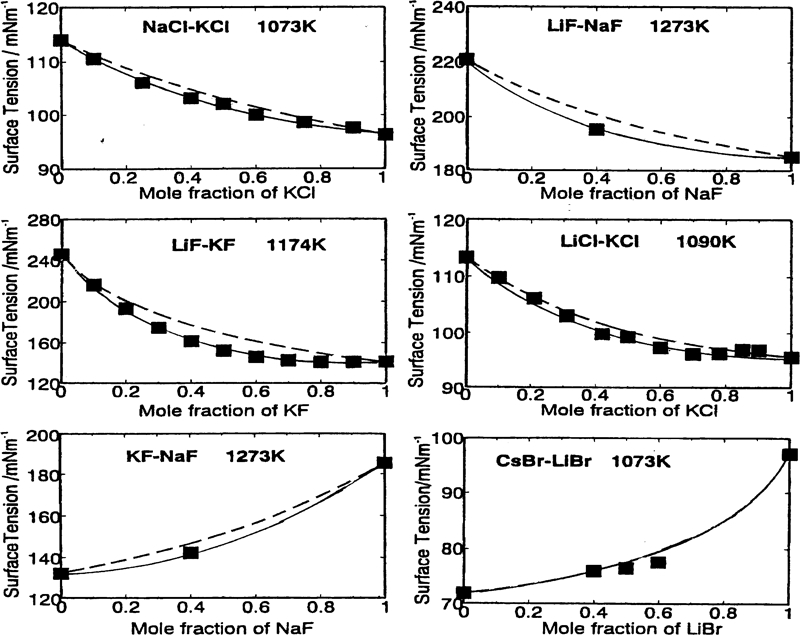
Surface tension of molten alkaline halide systems with common anions: solid curves: present calculation; dashed curves: previous calculation (Tanaka et al., 1998; Tanaka and Hara, 1999a; Ueda et al., 1999); ▪: experiment
As shown in Figs. 4 and 5, the calculated results (solid curves) agree well with the experimental values (▪) (NIST, 1987). In addition, the model reproduces the characteristics of the composition dependence quite well in common ionic mixtures. That is to say, their composition dependence of the experimental surface tension shows almost linear change in common cation systems. On the other hand, common anion systems have concave feature in the composition dependence. Furthermore, the present model can be applied to molten salt mixtures with complex anions such as sulphate systems. In those ionic mixtures, we used the apparent effective radii of complex anions obtained from the investigation of other bulk properties (Tanaka et al., 2006).
Evaluation of surface tension of molten SiO2 based slag
In this section, we have extended the above model derived for molten ionic mixtures to molten SiO2 based slags. Since the complex ion
 exits in molten SiO2 systems, we assumed that Si4+ is cation, and
 is anion unit to evaluate the ratio R = (RAnion/RCation) for SiO2. However, we do not know the value of the ratio of the radius of Si4+ ion to that of
 ion, which is therefore treated as a parameter. In addition, when we apply the above equations (11)–(14) to molten slag, we need the information on the surface tension of pure molten oxides, for example, pure liquid CaO at ∼1873 K because pure CaO exists as solid state at the temperature. Therefore, it is necessary to treat the surface tension of pure oxide components as another parameter at ∼1873 K.
We calculated the surface tension of molten SiO2 based slags from equations (11)–(14) with the following assumptions:
we assume that the ratio of ionic radius of cation to that of anion for SiO2 is regarded as the ratio of the radius of Si4+ to that of

 which is determined to fit calculated results with experimental values
we determine the surface tension of pure components with high melting point, e.g. CaO by parameter fitting to reproduce experimental values of the surface tension of molten slag.
The calculated results are shown in Fig. 6 (Tanaka et al., 2006) with the experimental values reported by Boni and Derge (1956).
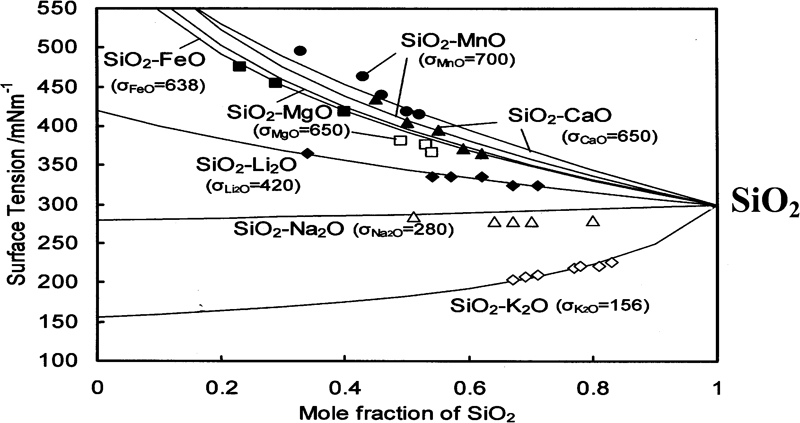
Surface tension of molten SiO2 based binary slag
In the above calculation, we selected R = (RAnion/RCation) = 0·5 as the ratio of the radius of Si4+ to that of
 . Furthermore, we selected the value of the surface tension of molten pure oxides as shown in the parenthesis in Fig. 6. These parameters have been selected as best fitting values to satisfy the calculated results with experimental values. As shown in Fig. 6, we found that we could evaluate the surface tension of various molten SiO2 based slags from equations (11)–(14) although we need to select the values of R = (RAnion/RCation) for SiO2 and the surface tension of pure molten oxides. Based on the results obtained here, the surface tension of industrial molten slag can be predicted from the present model (Nakamoto et al., 2007a, b) because the above equations (11)–(14) can be easily extended to ternary or multicomponent systems as follows
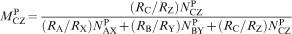
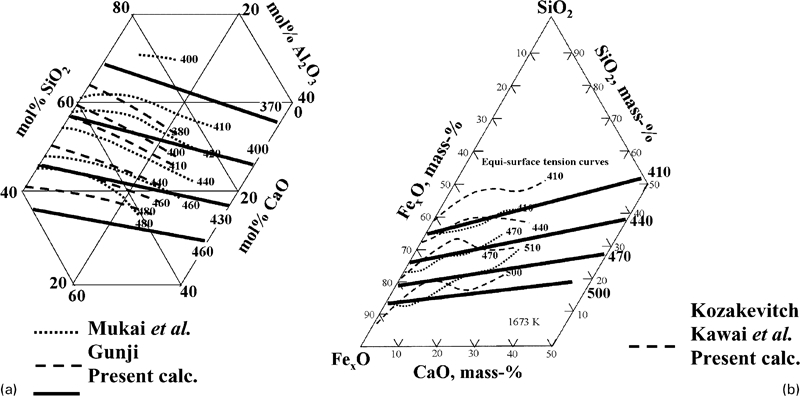
Surface tension of molten SiO2 based ternary slag
Conclusion
Some examples have been described on the evaluation of the surface tension of liquid alloys, molten ionic mixtures and molten slag. In addition, phase diagrams in nanosized particle alloy systems, which are affected by the surface energy, are also shown in this paper. Recently we have tried to evaluate the surface tension of molten slag in multicomponent systems by using neural network computation (Nakamoto et al., 2007c) because some of continuous casting fluxes are over 10 components systems and it is very difficult to evaluate the surface tension of such multicomponent systems by the model described in this paper. We are now aiming to apply the above evaluations with thermodynamic databases as well as kinetic approach to understand various phenomena related to interface reactions among different phases that coexisted in metallurgical complex systems.
Footnotes
This paper is part of a special issue from the Seetharaman – Seminar: Materials Processing Towards Properties