
Abstract
The major issue in stainless steelmaking is the difficulty of oxidising carbon from molten steel without also oxidising large proportions of expensive chromium. This can, however, be achieved by reducing the partial pressure of the gaseous product of carbon oxidation, carbon monoxide, by dilution with argon. Modern stainless steelmaking is dominated by duplex processes which prepare a high carbon melt in an electric arc furnace, and then decarburise it in an argon–oxygen decarburisation (AOD) converter. In this work, the thermodynamic basis of preferential carbon oxidation by dilution of oxygen with argon is discussed, together with a review of AOD practice. The AOD process was simulated using computational thermodynamics software to illustrate the way in which it can achieve very low carbon levels in the molten steel bath without excessive co-oxidation of chromium. The slag reduction stage using ferrosilicon additions was also modelled and shown to be able to recover almost all oxidised chromium from the slag, limited only by the accompanying increase in the silicon content of the steel. The models, although simple and easy to develop, correctly predicted all trends in output variables as input parameters were changed and often matched plant data very well. The models provide a valuable learning tool for those interested in pyrometallurgical processing in general, and stainless steelmaking in particular.
Introduction
Thermodynamic background
The difficulties faced in the production of stainless steels have been discussed in previous papers (Kho et al., 2010; Swinbourne et al., 2010). Stainless steels need to have relatively high chromium contents but very low carbon contents, typically ∼0·03 wt-%C. Carbon can be removed by oxidation, but as carbon is oxidised to very low levels, its activity drops rapidly, which makes chromium oxidation increasingly favourable. The need to oxidise carbon without also oxidising much expensive chromium is the main technical challenge in stainless steelmaking.
Dennis and Richardson (1953) described the competitive oxidation of carbon and chromium in molten stainless steel according to the reaction

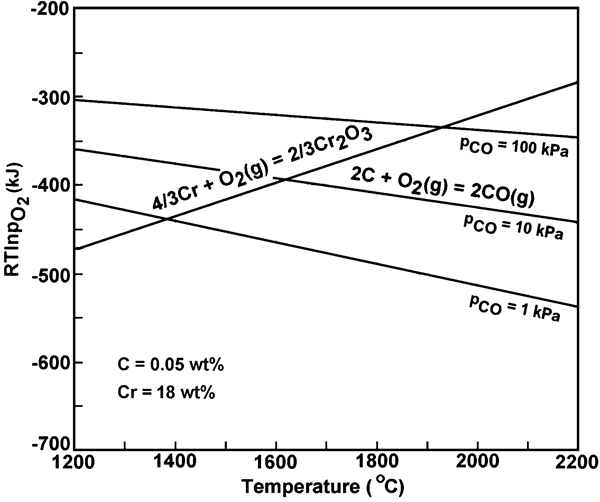
Ellingham diagram for carbon and chromium oxidation reactions with variable carbon monoxide partial pressures as given
Recognition by Krivsky (1973) of the benefits of lowering the carbon monoxide partial pressure completely changed stainless steelmaking practice, which then became ‘duplex’, i.e. an electric arc furnace (EAF) provides a molten steel charge which is then decarburised in a converter in which the carbon monoxide partial pressure can be reduced. The argon–oxygen decarburisation (AOD) process uses argon to dilute injected oxygen and was developed by Union Carbide and commercialised at Joslyn Stainless Steel Company in 1968, as described by Krivsky. Total pressure is reduced in the vacuum–oxygen decarburisation (VOD) process, developed by Edelstahlwerk Witten in Germany from 1962 to 1968 (Schmidt et al., 1968).
In this work, AOD converting will be reviewed, and then modelled using computational thermodynamics to obtain a better understanding of the changes taking place in the molten steel bath during processing.
Argon–oxygen decarburisation technology
The AOD process became the preferred method for making stainless steel within 10 years of its development (Klein et al., 1981) and today accounts for over 75% of the world's stainless steel output (Wei and Zhu, 2002a). In comparison with the VOD process, it offers easier maintenance and simpler deslagging capabilities, in that the AOD converter can be tilted and has a spout; whereas, the VOD ladle must be lifted out of the vessel by crane and moved to a separate deslagging stand. The economic production of a much wider range of alloy steels including nickel based superalloys, cobalt based alloys and super stainless steels containing >26 wt-%Cr and <0·02 wt-%C has been enabled by the advent of the AOD process. The AOD process, however, does have the disadvantage of consuming large quantities of expensive argon. The ferrochromium industry also was forced to shift from the production of expensive low carbon grades to inexpensive low grade, high carbon ferrochromium due to the dominance of the AOD process (Klein et al., 1981).
The AOD converter has been described (Choulet, 1997) as ‘pear shaped’ and is a steel shell lined with refractories, as shown in Fig. 2. The vessel sits in a trunnion ring which enables it to be rotated for charging and tapping and also facilitates rapid replacement of the vessel with a spare rebricked converter when the refractories become excessively worn. The design of AOD converters and all associated drive equipment and gas control facilities has been described by Williams and Ludlam (1978).
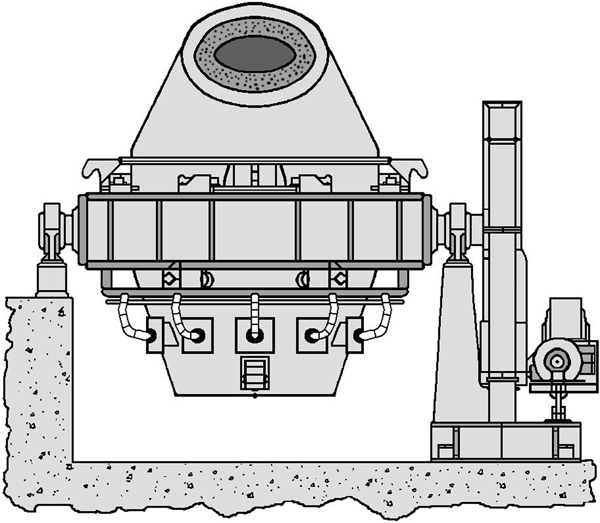
Diagrammatic AOD converter [modified from Scott (1976)]
The dimensions of a typical 50 t converter are given by Moore and Marshall (1980). A large ‘freeboard’ is necessary to contain splash when the converter is being blown, the specific volume usually being 0·4–0·8 m3 t−1 (Davis, 1994; Choulet, 1997). Mixing in the AOD is excellent and there are no large stagnation zones (Fabritius et al., 2003). Gas is injected through two to seven annular tuyeres placed low on the side, with a total blowing rate of 0·7–1·0 Nm3 min−1 t−1 (Moore and Marshall, 1980; Wijk, 1992; Syvänen, 2006). Annular tuyeres have a central pipe through which oxygen/argon flows, surrounded by an outer pipe through which argon flows at ∼0·1 Nm3 min−1 t−1 (Wei and Zhu, 2002a) to provide protection to the surrounding refractories. Low flowrates through the tuyeres cause backflow of steel, blocked tuyeres and uneven refractory wear while high flowrates cause strong bath oscillations and severe splashing. The number, diameter and angle of the tuyeres need to be optimised, although this is difficult because gas flowrate varies through the AOD cycle (Fabritius et al., 2003).
Most AOD converters now use mixed blowing (Syvänen, 2006), i.e. top blowing oxygen lances are added to side blowing converters. This increases converter productivity and allows the AOD to match the increased productivity of EAFs. Top blown oxygen lances operate from subsonic to supersonic velocities and the proportion of oxygen reacting with the bath, as opposed to providing post-combustion of carbon monoxide, ranges from 30 to 100% depending on lance height above the bath, nozzle design and gas velocity (Choulet, 1997).
Argon–oxygen decarburisation refractories
Refractory materials are one of the major operating costs in the AOD process, with the average lining life being 600 heats and specific refractory consumption ∼6 kg t−1 of steel (Amavis, 1990). Refractory wear is not even, but is concentrated around and above the tuyeres, because fluid velocities are higher in those areas and around the slag line. Differing grades and thicknesses of refractories are therefore used in different parts of the vessel. Chrome–magnesite refractories were once widely used, but nowadays >90% of converters are lined with dolomite or magnesia enriched dolomite refractories (LWB Refractories, 2010). They offer the lowest overall cost per tonne of steel and, most importantly, they allow the use of highly basic slags which facilitate desulphurisation and improve the recovery of chromium oxides from the slag. The key to good refractory life is control of both slag chemistry and bath temperature. The slag should have a CaO/SiO2 (w/w) ratio of >1·4 and should contain some MgO, supplied from adding a little dolomite as flux. Bath temperature should be kept below ∼1750°C to avoid melting the silicate bonding phase in the refractory and thus weakening the brick (Klein et al., 1981). However, the temperature must be high enough to prevent rehydration of the refractory. As a result, the vessel must be kept hot between heats using a burner which should fire into the vessel held in the horizontal position to minimise heat loss (Williams and Ludlam, 1978).
Argon–oxygen decarburisation blowing practice
It is very difficult to compare blowing procedures from plants around the world due to the differences in raw materials, product mix, equipment, practice and economic conditions (Choulet, 1997). When starting with a bath containing 1·0–1·5 wt-%C, the most common blowing practice (Klein et al., 1981; Wijk, 1992; Davis, 1994; Hällsten, 2007) is to use:
an oxygen/argon ratio of 3∶1 until temperature is ∼1700°C and the bath has 0·4 wt-%C
followed by an oxygen/argon ratio of 1∶1 until 0·1–0·2 wt-%C
then an oxygen/argon ratio of 1∶3 until the target of 0·02–0·03 wt-%C.
For extralow carbon steels, a fourth stage using an oxygen/argon ratio of 1∶4 or even 1∶5 can be used, but too low a ratio is not practical because the extent of chromium oxidation is reduced too much (Klein et al., 1981). Paradoxically, some chromium oxidation is needed to maintain temperature at very low carbon contents because little heat is then supplied by carbon oxidation. Marshall and Moore (1980) have tabulated data on the progress of a typical heat in a 50 t converter at a British plant, shown graphically in Fig. 3. Most carbon oxidation takes place in the first stage, as also does almost all silicon oxidation. The bath temperature increases from ∼1500 to 1700°C during the first stage when carbon oxidation dominates, but then only increases slowly to 1750°C over the next two stages.
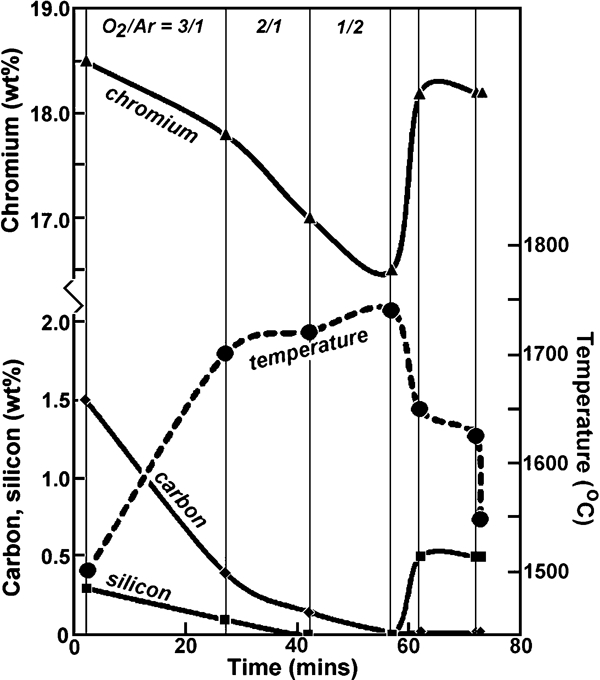
Chromium, carbon and silicon contents of bath, and temperature, for 50 t AOD heat, based on data from Moore and Marshall (1980)
Carbon removal efficiency
The volume of oxygen required to fully decarburise 1 t of molten steel containing 1·5 wt-%C is 14 Nm3, assuming that oxygen only reacts with carbon to form CO(g). In practice, the oxygen consumption in the AOD, normalised to that required for a 1·5 wt-%C steel bath, is variously quoted as 30 Nm3 t−1 (Moore and Marshall, 1980), 20–26 Nm3 t−1 (Choulet, 1997) and 22–28 Nm3 t−1 (Wijk, 1992). It is clear that a considerable fraction of the oxygen supplied is being used to oxidise other elements, i.e. silicon, manganese and chromium.
The efficiency of oxygen use is described by the ‘carbon removal efficiency’ (CRE), expressed as a percentage, and is defined (Klein et al., 1981; Wijk, 1992; Hällsten, 2007) as the instantaneous fraction of injected oxygen which reacts with carbon. The evolution of CRE throughout the AOD cycle is reproduced in Fig. 4. The CRE is initially low because most injected oxygen reacts with silicon, which is the most thermodynamically favoured reaction. After a few minutes, the CRE rapidly rises towards 100% as carbon oxidation dominates, but then decreases as chromium oxidation becomes significant at the lower carbon contents in the bath. At each oxygen/argon ratio change, the CRE is shown to undergo a step change increase to 100%, and then sharply decrease. Davis (1994) reported that the mean CRE during the first stage of blowing is 65%, for the second stage, it is 45% and 30% for the third stage, but this is a gross oversimplification.
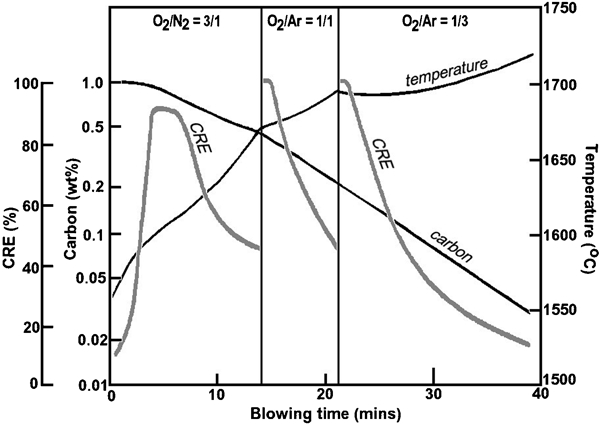
Carbon removal efficiency as function of time during AOD blow, after Hällsten (2007)
Decarburisation mechanism
Reaction (1) is known not to reach equilibrium (Choulet et al., 1971), with the extent of decarburisation also being a function of such variables as the depth of submergence of the tuyeres. Fruehan (1975) was the first to propose a mechanism for the decarburisation of stainless steel melts. He envisaged that when the oxygen/argon mix was injected through the tuyeres, the dominating reaction is the oxidation of chromium to Cr2O3 and effectively all oxygen is consumed. The rising argon bubbles contain dispersed Cr2O3 particles and they oxidise carbon in the steel bath. At high carbon contents, the rate of carbon oxidation is controlled by the rate of supply of oxygen, but at low carbon content, it is controlled by liquid phase mass transfer of carbon. Wei and Zhu (2002a) have critiqued the many variations of this mechanism that have appeared in the literature and concluded that all of them had deficiencies and did not reflect the reality of AOD refining. They developed a model which was shown to predict the behaviour of an AOD heat very well (Wei and Zhu, 2002b). Wijk (1992) also presented a simple model of the AOD process and showed, as expected, that when the carbon content of the bath is below some critical value, then the diffusional control of decarburisation results in the CRE being decreased below that predicted by equilibrium considerations.
Heat balance
Temperature increases during the three blowing stages, as can be seen from Figs. 3 and 4, principally as a result of silicon and chromium oxidation. The initial silicon content of the steel bath is important because if it is too low, the bath will not heat quickly enough and chromium oxidation, favoured at low temperatures, will be promoted (Klein et al., 1981). Carbon oxidation is not significant as a source of heat. High temperatures favour the oxidation of carbon; however, they lead to more severe slag attack on the refractories, so temperature control during an AOD cycle is critical to process success. Conducting a heat balance on the AOD is difficult because the CRE varies through the heat, the refractories have different starting temperatures and their thermal conductivity changes with time due to the effects of slag attack (Klein et al., 1981).
Slags and fluxing
It is commonly stated that chromium is present during AOD steelmaking as Cr2O3 and that this oxide has a very low solubility in slags (Dennis and Richardson, 1953; Wijk, 1992; Hällsten, 2007). This is only true if the slag is very oxidised, e.g. in equilibrium with air. During AOD steelmaking, the slag approaches equilibrium with a bath containing a large fraction of chromium, so conditions are very reducing. Liquidus phase relations in the CaO–SiO2–CrOx system in equilibrium with chromium were determined by de Villiers and Muan (1992), while Morita and Sano (2004) presented the phase diagram at moderately reducing conditions where the oxygen partial pressure was 6·95×10−11 atm. Their phase diagram is most appropriate to AOD converting and is given in Fig. 5. There is a large liquid region and the chromium content of the slag can be high at typical CaO/SiO2 ratios. Saturation with CrO1·5 (Cr2O3) only occurs with very high CaO/SiO2 ratios under such reducing conditions, but will occur under typical CaO/SiO2 ratios when the oxygen partial pressure rises towards the end of each stage of blowing. When MgO (and possibly Al2O3) are present, the solubility of Cr2O3 decreases and saturation with the spinel structure MgO.(Cr, Al)2O3 occurs (Arnout et al., 2008, 2009).
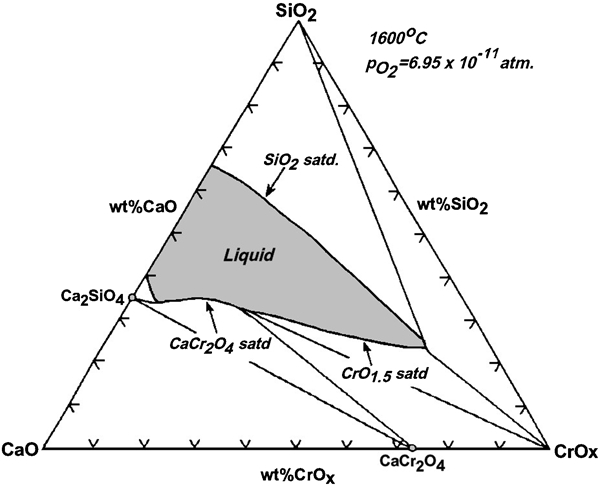
CaO–SiO2–CrOx phase diagram under moderately reducing conditions (Morita and Sano, 2004)
The greatly increased chromium solubility in slag is due to the presence of CrO. It has been shown (Xiao et al., 2002) that for a slag in equilibrium with chromium, the predominant oxidation state of chromium in slag is 2+, i.e. CrO. A recent comprehensive examination of the redox equilibria of chromium in calcium silicate melts (Mirzayousef-Jadid and Schwerdtfeger, 2009) corroborated these findings and showed that Cr2+ comprises ∼80% of total chromium at an oxygen partial pressure of 10−10 atm and a CaO/SiO2 mass ratio of 1·1 at 1600°C, decreasing as the CaO/SiO2 increased.
Fluxing practice generally involves adding lime (CaO) together with some dolomite before charging the AOD (Klein et al., 1981). The target CaO/SiO2 mass ratio basicity is 1·4 (Klein et al., 1981) to 1·7 (Wijk, 1992; Hällsten, 2007). The total CaO requirement depends on the initial silicon content of the steel bath and the target CaO/SiO2 ratio in the slag and is variously quoted as being from 35–45 kg t−1 (Wijk, 1992) to 50–60 kg t−1 (Choulet, 1997).
Slag reduction
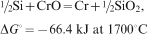
At the completion of oxidation, the slag will contain dissolved CrO and Cr2O3, as well as a significant amount of solid Cr2O3. Most of this can be reduced back to chromium by additions of a reductant such as ferrosilicon or aluminium (Klein et al., 1981). The silicon reduction of chromium oxides can be represented as
Methodology
HSC simulation
The HSC Chemistry for Windows v.5·1 software package (Roine, 1998) was utilised in this work. It was successfully used in two previous publications to model EAF melting of steel scrap (Kho et al., 2010) and VOD refining of stainless steel (Swinbourne et al., 2010). All likely phases in the system; the species which are in or likely to be created in each phase; the activity coefficients of all species in each phase; the masses of all input species, the temperature and the pressure of the system must be specified. A Gibbs free energy minimisation routine is used in HSC to output the quantities of all species in all phases at equilibrium.
HSC can only utilise constant values of activity coefficient, so slag species were represented in the monocation form because this leads to activity coefficient values which are approximately constant over a wide range of concentrations (Yazawa et al., 1983).
The species CrO(l) is not included in the HSC database, so it needs to be added using the data of Toker et al. (1991) as described by Kho et al. (2010). The data for CrO(l) in standard HSC format have the following parameters: H = −334·218 kJ mol−1, S = 62·400 J mol−1 K−1, A = 32·430, B = 20·958, C = −0·381 and D = −2·623.
Early thermodynamic analyses (e.g. Dennis and Richardson, 1953) did not consider the existence of CrO in slag. A line representing the oxygen potential of the Cr/O2(g)/CrO(l) reaction, based on the Toker et al. (1991) data, could be added to Fig. 1. If the activity of CrO(l) is assumed to be 0·1 and the activity of chromium in the alloy 0·2, then the line would be only ∼20 kJ below that for Cr/O2(g)/Cr2O3. As a result, the previous conclusions relating to the effect of CO(g) partial pressure on the relative oxidation of chromium and carbon remain valid.
Model basis
The slag was taken to contain CaO, SiO2, CrO, CrO1·5, FeO and MnO. It was assumed that the slag formed would lie in the liquid region given in Fig. 5, and that the saturating solid phase would be Cr2O3. This is reasonable as saturation with a spinel phase only occurs when MgO and possibly Al2O3 are present (Arnout et al., 2008, 2009). There are databases for several forms of silica in HSC, and in this work, silica was taken to be cristobalite, represented as SiO2(CRS) in the HSC database. NiO was not considered because under the prevailing oxygen partial pressures, nickel oxidation is insignificant. MgO from dolomite flux or refractory attack was also neglected. The amounts of CaO used in the modelling were those which gave a final CaO/SiO2 mass ratio of 1·6–1·7 at the completion of oxidation and reduction. No CaF2 addition to slag was included because its presence would have no affect on the predicted equilibrium outcomes.
The model blowing practice was defined as follows:
the first stage: an O2/Ar ratio of 3 until 0·4wt-%C, and a mean temperature of 1615°C
the second stage: an O2/Ar ratio of 1 until 0·15 wt-%C, and a mean temperature of 1680°C
the third stage: an O2/Ar ratio of 1∶3 until 0·02 wt-%C, and a mean temperature of 1705°C.
A separate HSC model was used for each stage, with the mass of condensed species present at the end of one stage being the input values for the subsequent stage.
During the reduction stage, the reductant was taken to be pure silicon. The amount of iron added with the typical 75 wt-%Si ferrosilicon alloy used is not significant compared with the total amount of iron present in the bath. The average bath temperature was assumed to be 1700°C.
Slag activity coefficients
The activity coefficients of CaO(s) and SiO2(s) were those calculated by Xiao and Holappa (1997) for the CaO–SiO2–CrOx system at 1600°C in equilibrium with pure chromium. The values obtained were close to those used in previous work (Kho et al., 2010; Swinbourne et al., 2010) using a regular solution model (RSM) (Ban-Ya, 1993). The activity coefficients of CrO(l) and CrO1·5(s) in slag are important parameters in this work. Morita and Sano (2004) reported that the activity coefficient of CrO1·5(s) is ∼10 and that of CrO(l) ∼50 at high slag basicity and at 1600°C. Such a high value for CrO(l) is not credible and is likely to be a result of unwanted oxidation during the very difficult titrations used to determine Cr2+ in solution. Xiao et al. (2002) used the electromotive force method to measure the activity coefficients of the chromium oxides at 1600°C and from their data, the value can be taken as 5 for CrO(l) and 8 for CrO1·5(s), although there is a considerable degree of uncertainty because the values of the activity coefficients depend on basicity and the chromium content of the slag. These values are very different from those from the RSM, which gave values of only 3 for CrO(1) but 15 for CrO1·5(s). Experimental data are to be preferred, so the values of Xiao et al. (2002) will be used in this work. The activity coefficients of the minor species FeO(l) and MnO(s) were calculated using the RSM and have a minimal impact on the model predictions. The RSM indicated that all slag species activity coefficients were not significantly affected by temperature over the range of 1600–1700°C, so the same values will be used in all stages in the model.
Metal activity coefficients
Activity coefficients in the molten iron phase were estimated in the same way as detailed previously (Kho et al., 2010). The values of the activity coefficients of all elements except carbon were not significantly affected by temperature over the range of 1600–1700°C. However, the limiting activity coefficient of carbon varied from 0·35 at 1600°C to 0·25 at 1700°C, so the mean value of 0·3 was taken as satisfactory for this work.
HSC model inputs
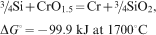
The phases, species, activity coefficients and input masses for the three oxidation stages and the reduction stage are given in Table 1. The initial molten steel bath was taken to contain 18 wt-%Cr, 10 wt-%Ni, 0·5wt-%Mn, 0·3 wt-%Si and 1·5 wt-%C. No slag carryover from the EAF was considered.
Species, activity coefficients and input masses (kg) for HSC models used during all stages of AOD cycle
The output masses of all condensed species became the input masses for the subsequent model. Output masses of gaseous species were not passed to the next stage. Oxygen and argon step sizes were in the appropriate ratio for each oxidation stage.
Results and Discussion
First oxidation stage
The masses of important species as a function of the amount of oxygen blown are given in Fig. 6. Solid Cr2O3 begins to form just as the carbon content of the bath reaches 4 kg, i.e. very close to 0·4 wt-%C, which is the endpoint expected. The amount of oxygen required to reach this endpoint is ∼22 kg t−1 (16 Nm3 t−1). Silicon is oxidised to very low levels, while significant manganese oxidation also takes place. The model also predicts that for most of this stage of blowing, chromium is present in the slag in almost equal amounts of both CrO and CrO1·5.
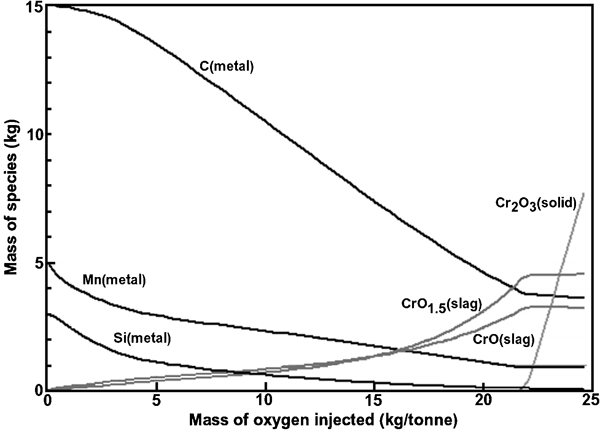
Masses of several species as function of mass of injected oxygen during first stage, at O2/Ar ratio of 3∶1 and temperature of 1615°C
The CRE, given in Fig. 7, was calculated incrementally for each step of the simulation as the percentage of injected oxygen which reacted to form CO(g) and CO2(g). The form of the CRE curve is similar to that shown in Fig. 4. Most noticeable is the sharp drop in CRE once Cr2O3 saturation of slag occurs, so blowing should not continue into this region.
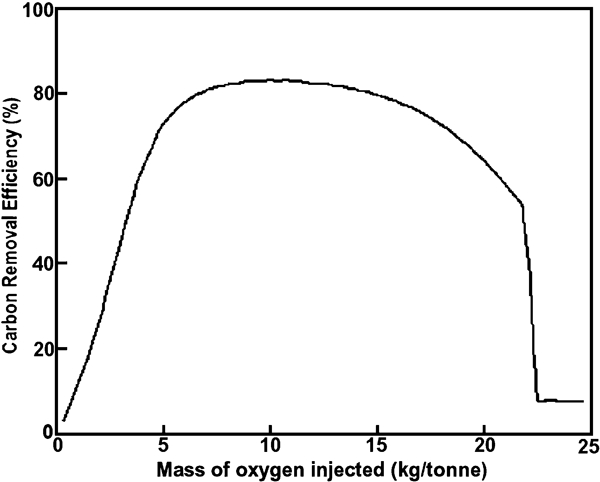
Carbon removal efficiency as function of mass of injected oxygen during first stage, at O2/Ar ratio of 3∶1 and temperature of 1615°C
In the first stage, where the rate of supply of oxygen is the limiting factor (Fruehan, 1975), it would be expected that the model should predict the amount of oxygen required to reach the carbon target of 0·4 wt-% quite well. However, there are very little data in the literature under equivalent operating conditions which can be used for comparison. It can be calculated from information given by Moore and Marshall (1980) that the oxygen requirement in the first stage is 13 Nm3 t−1 and this compares quite well with the predicted value of 16 Nm3 t−1. Stoichiometric calculations show that the amount of oxygen required to oxidise carbon from 1·5 to 0·4 wt-% is 10·3 Nm3 t−1, and noting that the average CRE for this stage is estimated at 65% (Davis, 1994), the actual oxygen requirement should be 15·8 Nm3 t−1. This match is excellent.
Second oxidation stage
The masses of important species as a function of the amount of oxygen blow in the second stage are given in Fig. 8. It can be seen that further carbon removal occurs without the formation of solid Cr2O3, and with only small increases in the masses of dissolved chromium oxides. Solid Cr2O3 begins to form at 3 kg t−1 of oxygen, just as the carbon content of the bath reaches 1·8 kg, i.e. ∼0·18 wt-%C. This is close to the expected endpoint of 0·15 wt-%C, which could be reached by allowing the formation of some Cr2O3. The manganese content of the steel bath drops a little further, but the silicon content remains almost constant. It can be seen from Fig. 3 that, in practice, a little silicon oxidation is expected in the second stage.
Masses of several species as function of mass of injected oxygen during second stage, at O2/Ar ratio of 1∶1 and temperature of 1680°C
The evolution of the CRE for the second stage as a function of the mass of oxygen injected is given in Fig. 9. The CRE is initially over 100%, indicating that oxygen is supplied from a source other than that being injected. When the oxygen/argon ratio is dropped from 3∶1 to 1∶1, the slag becomes overoxidised with respect to the new oxygen partial pressure, so metal oxides in the slag react with carbon in the bath. This can be seen in Fig. 8 as a lower mass of carbon at zero oxygen addition than the final mass of carbon at the end of the first stage, a small decrease in the masses of CrO and CrO1·5 up to 1 kg t−1 of oxygen and a slight increase in the mass of manganese in the steel.
Carbon removal efficiency as function of mass of injected oxygen during second stage, at O2/Ar ratio of 1∶1 and temperature of 1680°C
Wijk (1992) referred to the overoxidised state of the slag as a result of changing the O2/Ar ratio and implied that this results in carbon oxidation by indicating that some AOD operators blow only argon as a fourth stage to further lower the carbon content of the bath. Clearly, this can only take place via reaction with metal oxides in the slag. Klein et al. (1981) stated that CRE values >100% are unattainable, but this is incorrect. In practice, CRE values over 100% are unlikely to be observed because they require that the slag and metal bath be perfectly mixed. The CRE drops to ∼50% before Cr2O3 forms, so the average CRE will be somewhat greater than 45% as given by Davis (1994).
Comparison of the predicted oxygen requirement with the literature is not possible or meaningful for the second and third oxidation stages. Both stages for the example from Moore and Marshall (1980) used different O2/Ar ratios from those in this work. In addition, the extents of metal oxide reactions with carbon in practice will be much less than those in this model.
Third oxidation stage
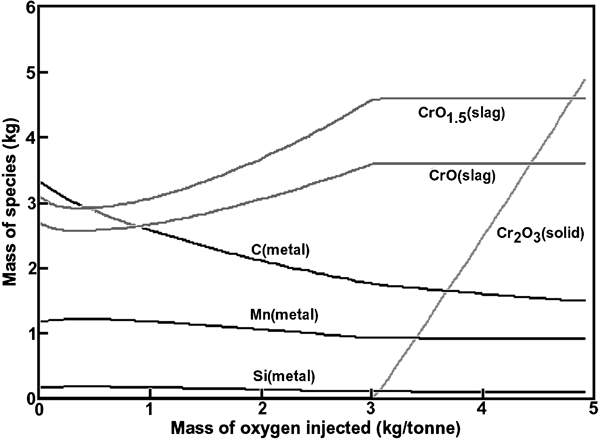
The masses of important species as a function of the amount of oxygen blow in the third stage are given in Fig. 10. Again more carbon removal occurs after the change in O2/Ar ratio before any solid Cr2O3 forms. However, it can also be seen that the carbon content of the bath does not reach the target of 0·2 kg (0·02wt-%C) even after large amounts of solid Cr2O3 have formed.
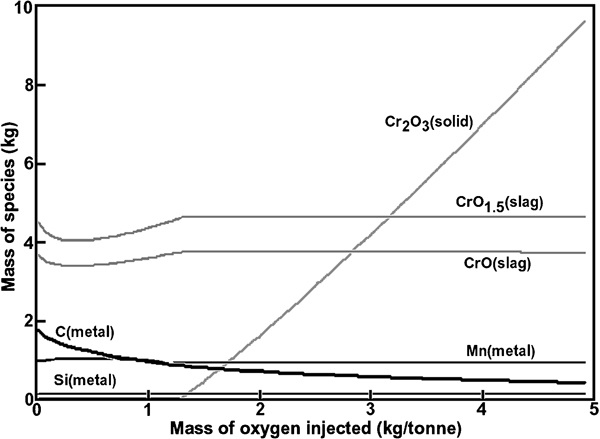
Masses of several species as function of mass of injected oxygen during third stage, at O2/Ar ratio of 1∶3 and temperature of 1705°C
HSC Chemistry for Windows functions in a ‘closed system’ mode. As oxygen and argon amounts are incremented, all output species from step ‘n’ becomes the inputs to step ‘n+1’, so all CO(g) formed in previous steps is retained during calculation. In practice, it is likely that most CO(g) formed in the AOD is rapidly flushed from the converter, so that the process can be considered to operate in an ‘open system’ mode. The result will be a lower CO(g) partial pressure and therefore lower carbon contents in the steel bath. HSC cannot calculate in ‘open’ mode, but this can be simulated by dividing the third stage into five substages. Only the masses of condensed species are passed manually from one substage file to the next. The results are shown in Fig. 11 and it can be seen that the target carbon content of 0·02 wt-%C can be reached and requires ∼4 kg t−1 of oxygen (3 Nm3 t−1). The difference between closed and open modes of calculation is insignificant at the higher carbon contents in the first two stages.
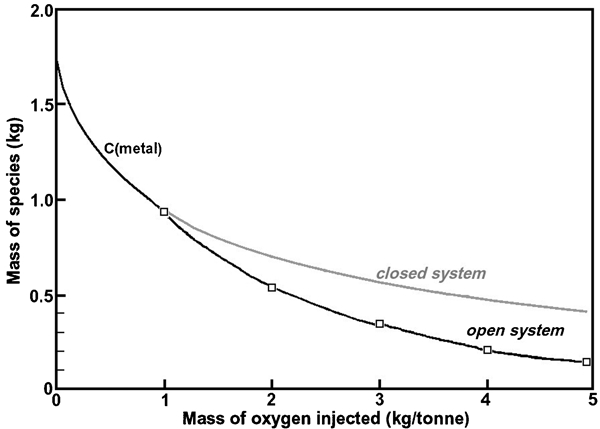
Mass of carbon as function of mass of oxygen blown during third stage under closed system conditions and under simulated open conditions
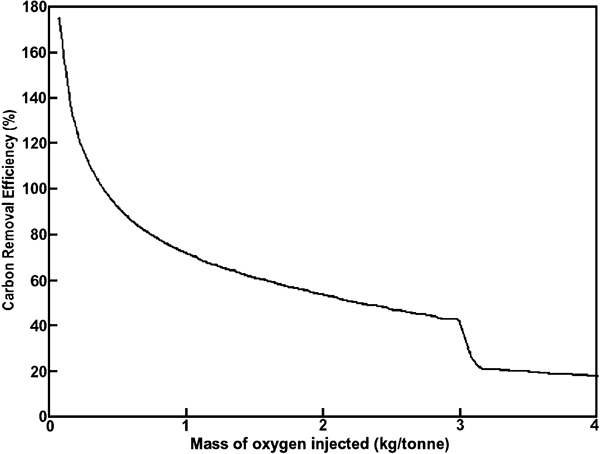
The CRE is shown in Fig. 12 and again, for the same reason as in the second stage, the initial CRE value exceeds 100%. The CRE rapidly decreases and it can be seen that the average CRE of 30% suggested by Davis (1994) is reasonable. Under open system conditions, the CRE values are minimally affected because they only result in very small changes in the carbon content of the steel bath.
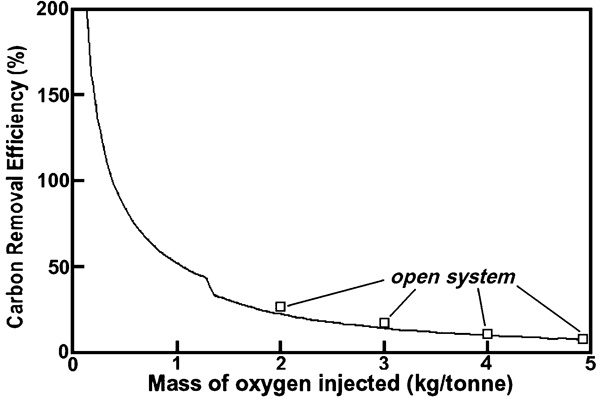
Carbon removal efficiency as function of mass of oxygen injected during third stage when O2/Ar ratio is 1∶3 and mean temperature is 1705°C, for both closed and open conditions
Reduction stage
The amounts of species present at 4 kg t−1 of oxygen addition were used as the input data to the reduction model, as given in Table 1. The amount of CaO was increased to that sufficient to achieve the target CaO/SiO2 (wt-%) of 1·6–1·7 when the silicon content of the bath reached 0·5 wt-%.
The masses of important slag and metal species as a function of the mass of silicon added are given in Fig. 13. No Cr2O3 appears because CaO has been added to the slag and the model predicts that all Cr2O3 then dissolves into the enlarged slag mass. The masses of chromium oxides in the slag initially decrease quickly but never reach zero. The mass of silicon in the steel bath rises steadily, but commercial stainless grades limit the silicon content to a maximum of ∼0·5 wt-%. This limit is reached at an addition of 9 kg t−1, which is equivalent to 12 kg t−1 of 75 wt-%Si ferrosilicon. This compares acceptably with typical ferrosilicon consumptions of 8–11 kg t−1 (Wijk, 1992; Choulet, 1997).
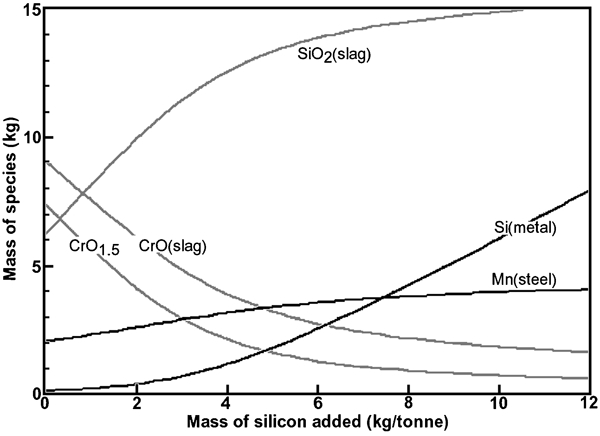
Masses of some important species in slag and metal bath as function of mass of silicon added, at 1700°C
It can be estimated from Fig. 13 that the remaining mass of chromium in the slag is ∼2 kg t−1. The initial mass of chromium in the bath was 180 kg t−1, so the overall chromium recovery to the steel is 99%. Chromium recoveries in practice are given as being in the range of 97–100% (Klein et al., 1981; Davis, 1994), in agreement with the model.
Overall, the consumption of CaO predicted by the model was 25 kg t−1 while Wijk (1992) gave typical consumptions as 35–45 kg t−1. This difference is not due to differing assumptions of the initial silicon content of the steel. This model assumed that no slag was carried over from the EAF to the AOD, while in practice some carryover is to be expected and additional CaO may be needed to flux the SiO2 in this carryover slag. No information on expected amounts of slag carryover could be found in the literature. In addition, the CaO/SiO2 ratio (w/w) may have been higher than that assumed in this work, so improved desulphurisation of the melt could be achieved.
Model evaluation
A simple thermodynamic model of the AOD practice cannot be expected to predict all operating parameters accurately because it is known that kinetic factors also play a role in operation of the AOD. Additionally, the values of the activity coefficients of important slag species are uncertain and had to be assumed to be constant for all stages due to the limitations of the software package. Finally, temperature was assumed constant during each stage and EAF slag carryover, MgO addition via dolomite flux or refractory attack and the addition of fluorspar to the reduction slag were not considered. A model which predicts the correct trends in outputs as input variables are altered and leads to improved understanding of the process is what is required in the educational context.
The primary aim of the modelling was to illustrate how diluting the oxygen blown into the AOD converter with increasing amounts of argon allows very low carbon contents in the stainless steel bath to be reached without excessive chromium oxidation. A secondary aim was to show how oxidised chromium can be recovered from the slag, and how this is limited by the silicon specification of the stainless steel. Both aims have been achieved by a simple and transparent computational thermodynamic model which should prove of value to those wishing to better understand pyrometallurgical processes.
Conclusion
The three stages of decarburisation using decreasing ratios of oxygen/argon and the slag reduction stage in the AOD stainless steelmaking converter were modelled using computational thermodynamics software. The way in which this blowing practice could achieve very low carbon levels in the molten steel bath without excessive co-oxidation of chromium was illustrated. The CRE was calculated for each stage and shown to be a good match with existing plant data. Additions of silicon in the form of ferrosilicon were also shown to be effective in reducing chromium oxides from the slag, but the extent of reduction is limited by the accompanying increase in the silicon content of the steel. Despite the simplicity and transparency of the models, they correctly predicted all trends in output variables as input parameters were changed and in most cases matched plant data very well. The models will be a valuable learning tool for those interested in pyrometallurgical processing.