
Abstract
A series of experiments have been carried out to investigate the direct melting reduction process of high phosphorus iron in a nitrogen atmosphere with non-isothermal heating. The weight loss factor of the iron ore can be considered as a function of the temperature in the reduction progress. The kinetic parameters of the model can be determined by the data in a single test with a non-isothermal heating rate. With the temperature increasing, the reduction process can be divided into decrystal water phase of limonite, the pre-reduced phase of hematite, and finally reduced phase. The final reduction can be divided into three sections. On this basis, functions of the reaction mechanism and apparent activation energy in each stage are expected to be investigated. Then, the compensation effect of the whole reaction process is presented. Finally, the relationship of apparent activation energy and pre-exponential factor are also analysed.
Introduction
Based on long term research and development, non-blast furnace iron making technique has gradually become a modern system with direct reduction and smelting reduction as its main part (Chen et al., 2007). The direct smelting reduction process of limonite by coals covers the followings, removal of crystallisation water, precipitation of volatile, volatile reduction, and carbon reduction. Recently, lots of researches are focused on the carbon reduction (Abraham and Ghosh, 1979) and removal of crystallisation water (Zhang et al., 2010), on the other hand, some researches are concentrated on the precipitation and reduction of volatile (Bryk and Lu, 1986; Dutta and Ghost, 1994; Huang et al., 1996; Huang and Kong, 1995; Wang et al., 1997; Fan et al., 2010; Aslanoglu, 2005). However, the reduction kinetics cannot accurately reflect the whole process. Therefore, combined the pre-reduction with final reduction when establishing the kinetic equations, namely the comparative authentic way, is proposed to be employed to demonstrate the whole process of the direct smelting reduction in this paper. It is proven by experiments that the weight loss is mainly related to the temperature in reduction process of iron ore and instead of the rate of heating (Ma et al., 2002). Some kinetic equations are complicated to be solved. This paper tries to set up a kinetic equation to illustrate the whole process during limonite's direct smelting reduction. The model parameters of this reaction can be determined by one-time heating in this method.
The rest of the paper is organized as follows. Details of the experiment, such as the raw materials, equipment, and the main phase are presented in the section on ‘Experimental’. The whole process of the direct smelting reduction and analysis of the relation between weight loss and temperature are discussed in the section on ‘Process analysis based on calculated of heat–weight’. The kinetic equation and method of calculating kinetics parameters are described in the section on ‘Kinetic equation’. Experimental results are illustrated in the section on ‘Results and discussion’. Finally, the section on ‘Conclusions’ concludes the paper.
Experimental
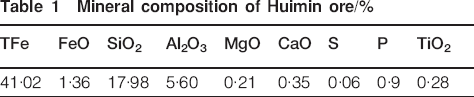
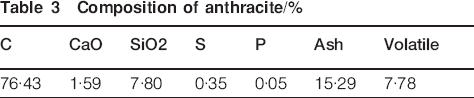
Raw materials employed in the experiment are taken from the Huimin high phosphorus iron ore in Yunnan province. The composition of Huimin ore and auxiliary raw materials such as coal, CaO, are shown in Tables 1–3. They are in the uniform state after crushing and grinding. As a reducing agent, the coal in the reaction vessel can maintain a strong reduction atmosphere to make sure that the iron in smelting slag is fully reduced. In addition, the added CaO can increase the basicity in the slag of reduction process to improve their liquidity and to make iron oxide fully reduced.
Mineral composition of Huimin ore/%
Ingredients of solvent/%

Composition of anthracite/%
As shown in Fig. 1, the main phases of Huimin iron ore are Fe2O3.H2O and SiO2. Huimin limonite ore is a kind of water goethite.
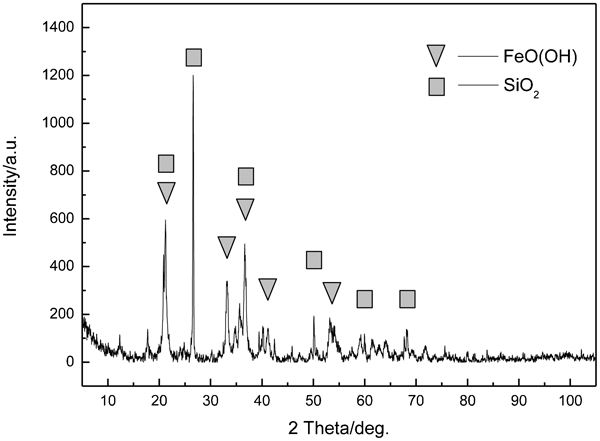
X-ray diffraction collection of illustrative plates of Huimin iron ore
The particle size is ranged from 0·001 to 0·1 mm. There are two genetic types for the limonite ore, one is the sedimentary limonite, which was implicit and crystalline aggregate; another is the limonite aggregate formed by exogenous effect of oxidation and hydrolysis. In addition, there are three formatted quartz in the gangue, the first form is the recrystallisation of siliceous rock by sedimenting; the second is the debris of quartz; the third is the epigenetic quartz, whose particle size is relatively large and often occurred as veined and banded shapes.
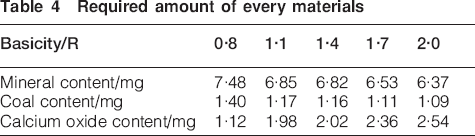
The main iron mineral of limonite is the water iron oxide nFe2O3.nH2O (n = 1–3, m = 1–4). According to the different values of n and m, there are different minerals taking shape. Generally, they are lean ore (37–55%Fe) with phosphorus in high content, and other ingredients, including Mn, Cr, V, Ni and As. Limonite features loose texture and has a good reducing property. The smelting experiments are carried out with respective basicity as 0·8, 1·1, 1·4, 1·7, 2·0; the experimental ratios are shown in Table 4.
Required amount of every materials
TGA equipment employed in this experiment is proposed by Netzsch, modeling as STA 449 F3. As shielding gas, nitrogen gas flows at 50 mL min−1. Purge gas is argon which flows at 10 mL min−1.
Shielding gas is used to protect the balance of heat and maintain the balance of scale; purge gas is used to get rid of the gas, which was decomposed in the thermal gravimetric analysis.
The loss of combustion in the ore is mainly oxygen, which was reduced by the carbon contained in the coal and the volatiles, then the gangue reacted with CaO formed the silicate of slag.
The whole reaction is indicated by weight loss rate (reaction scores) of limonite in the direct smelting reduction process as equation (1)

Process analysis based on calculated of heat–weight
The direct smelting reduction by solid carbon plays the critical role in the droplets area of smelting furnace for Hismelt technology, with its reduction rate several times faster than coke in blast furnace, in which CO is used as the stirring force. In addition, CO is continuously purged by argon in this experiment, which shifts the equilibrium of equations (2)–(4) rightward, accordingly promotes the direct reduction by solid carbon. Therefore, the results of this experiment are much closer to the real situation in melting furnace for Hismelt technology. The direct reaction by carbon can be expressed as equations (2)–(4)


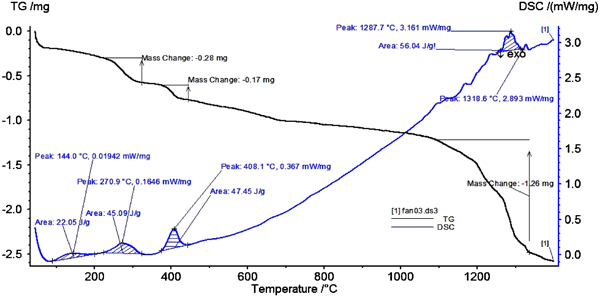
TG-DSC curve diagram at R = 1·7
Fourth, the DSC curve has been rising between 500 and 1100°C, but the corresponding TG curve has changed little, which is caused by the transition of solid–solid reactions from solid state to semisolid state, eventually to molten state. Judging from the straight line, this process can be regarded as a physical change and the flatness of DDSC curve has also supported this result. A large amount of heat is needed in this stage, while the mass has not changed much. The result of micro morphology for raw ore and reduced product at 1100°C is shown in Fig. 3. It is found from Fig. 3, CaO is employed to make the large particles of the ore to break up into small ones in high temperature. In the meanwhile, the surface becomes from roughened to smooth, which is caused by change of crystalline form for the iron oxide.
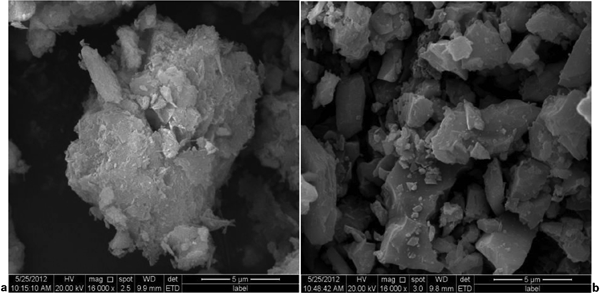
Comparison of raw ore and reduced product at 1100°C for micromorphology: a raw ore; b reduced product at 1100°C
The occurrence forms of Fe2SiO4 have illustrated the melting degree in Fig. 4. In addition, a few amounts Fe2O3 is result from oxidation of air. Finally, the final reduction stage is appeared after 1100°C. In this stage, part of the intermediate of FexO would have been fully transformed into Fe3O4, then into FeO, eventually into Fe. As a result, a clear endothermic peak appears, and the mass decreases obviously. There is a small exothermic peak, which is caused by the exothermic reaction of oxidation dephosphorisation around 1300°C.
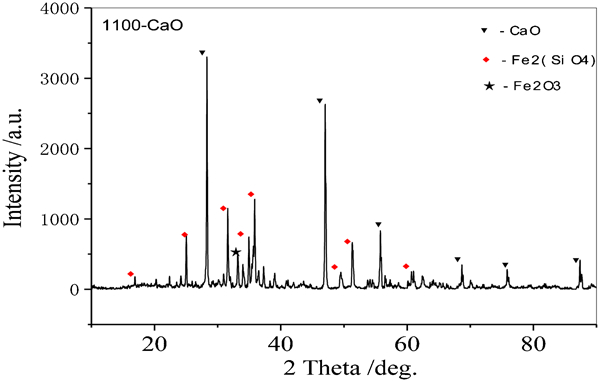
X-ray diffraction collection of illustrative plates of Huimin iron ore reduced at 1100°C
As shown in Fig. 5, the reaction rate for reduction of the iron ore is accelerating along with the heating rate increasing but the characteristics do not change, this result illustrates that the heating rate almost has no influence on the reduction mechanism. However, faster heating rate would not only easily lead to the lag in reaction and the loss of intermediate product information, but also the DSC baseline drift, the only advantage is that it can improve the sensitivity and peak shape (when the heating rate was set in 20 K min−1). On the contrary, slower heating rate could enable more accurate expression of the reduction process, however, it will lead slower some chemical reactions or physical responsive rate, the smaller DSC baseline drift and smaller the peak shape.
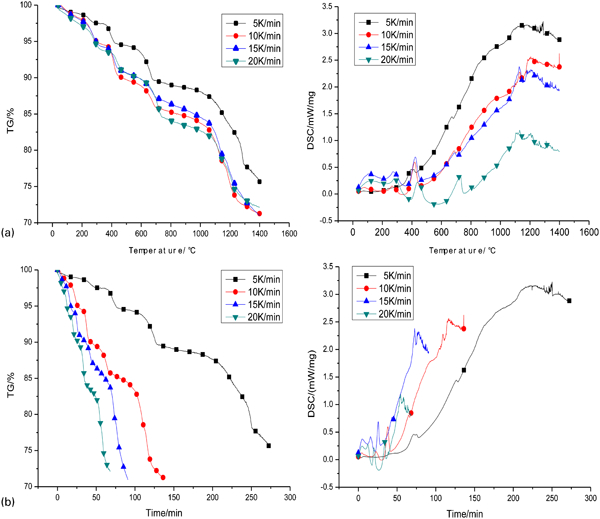
TG-DSC curves with different heating rates at a R = 1·7(x-temperature) and R = 1·7(x-time)
Kinetic equation
The chemical reaction rate can be expressed as equation (5)


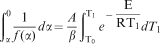
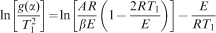
 versus 1/T1 under a given analytical form of g(α) should be a straight line whose slope and intercept allow the evaluation of activation energy and pre-exponential factor respectively.
Results and Discussion
The analytical results of each phase are shown as followings.
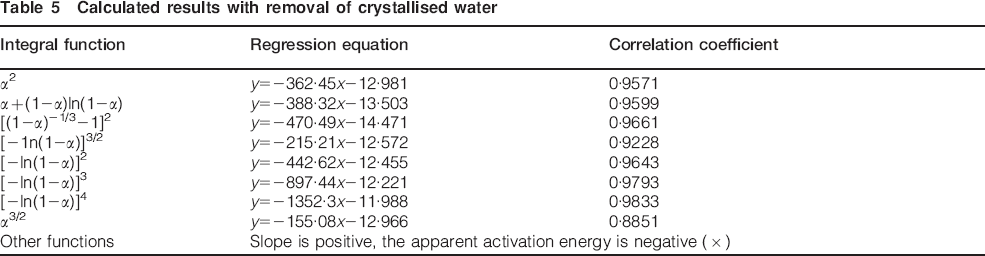
Phase I: Removal of the crystallised water
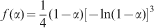
As shown in Table 5, the maximum of related coefficient is 0·9833. The corresponding integral function is
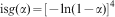
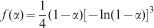
 , and the mechanism function is
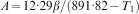
 . The calculation manifests the apparent activation energy E = 11·24 kJ mol−1, pre-exponential factor
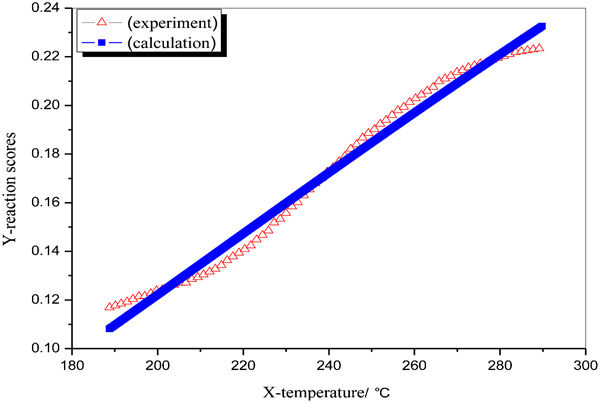
 , and the stage belongs to the random nucleation and subsequent growth of Avrami-Erofeev equation. The comparison between the measured and calculated by the model on reaction fraction of volatile and crystal water removal phase is shown as Fig. 6.
Phase I comparison between measured and calculated
Calculated results with removal of crystallised water
Phase II: The reduction of Fe2O3 (pre-reduction)
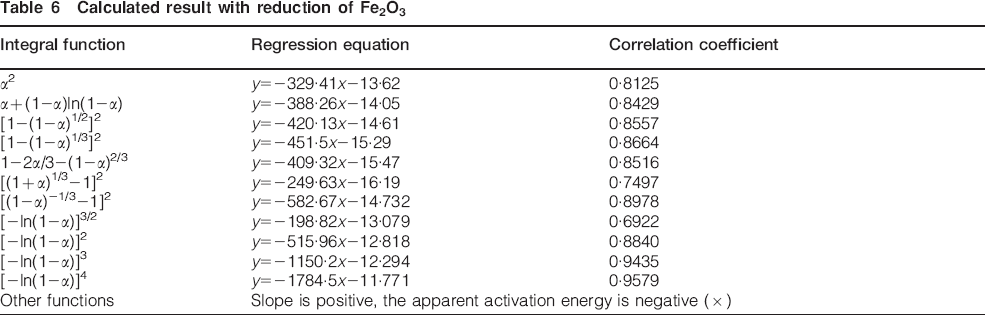
As shown in Table 6, the maximum of related coefficient is 0·9579. The corresponding integrated function is
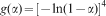
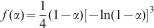
 , and the mechanism function is
 . The calculation manifests the apparent activation energy E = 14·83 kJ mol−1, pre-exponential factor
 , and the stage belongs to the random nucleation and subsequent growth of Avrami-Erofeev equation. The comparison between the measured and model calculated on reaction fraction of the pre-reduction phase is shown as Fig. 7.
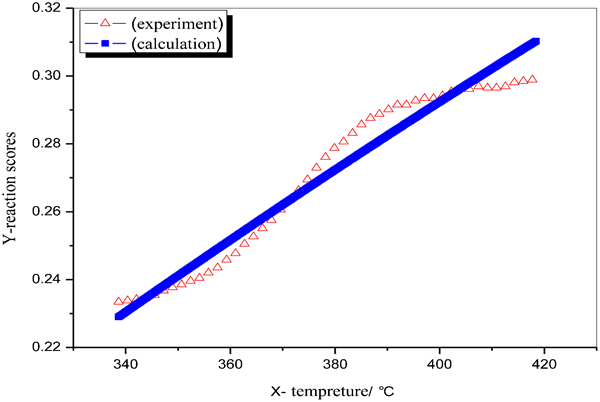
Phase II comparison between measured and calculated
Calculated result with reduction of Fe2O3
Phase III(A): The transition of molten progress
The slopes of most integrated functions are positive, only few ones are negative but the correlation coefficient is very low. The reason lies in physical changes (from solid to molten state) in this phase. There are three representative stages in next phase (B).
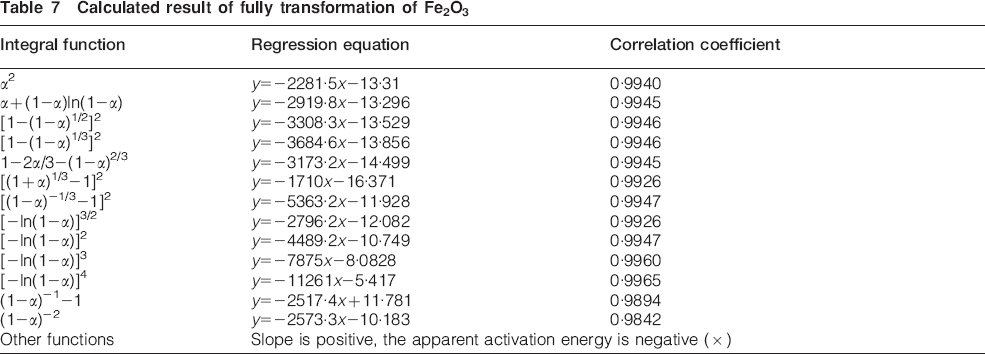
The fully transformation of Fe2O3
As shown in Table 7, the maximum of related coefficient is 0·9965. The corresponding integral function is
 , and the mechanism function is
 . The calculation manifests the apparent activation energy E = 93·58 kJ mol−1, pre-exponential factor
 , and the stage belongs to the random nucleation and subsequent growth of Avrami–Erofeev equation.
Calculated result of fully transformation of Fe2O3
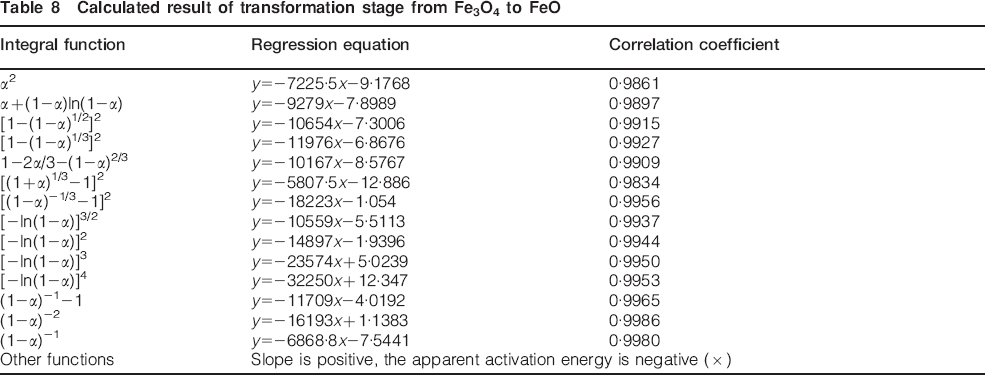
The transformation stage from Fe3O4 to FeO
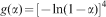
As indicated in Table 8, the maximum of related coefficient is 0·9986. The corresponding integral function is
 , and the mechanism function is
 . The calculation manifests the apparent activation energy E = 134·56 kJ mol−1, pre-exponential factor
 , and the stage belongs to a slow-down α−t curve.
Calculated result of transformation stage from Fe3O4 to FeO
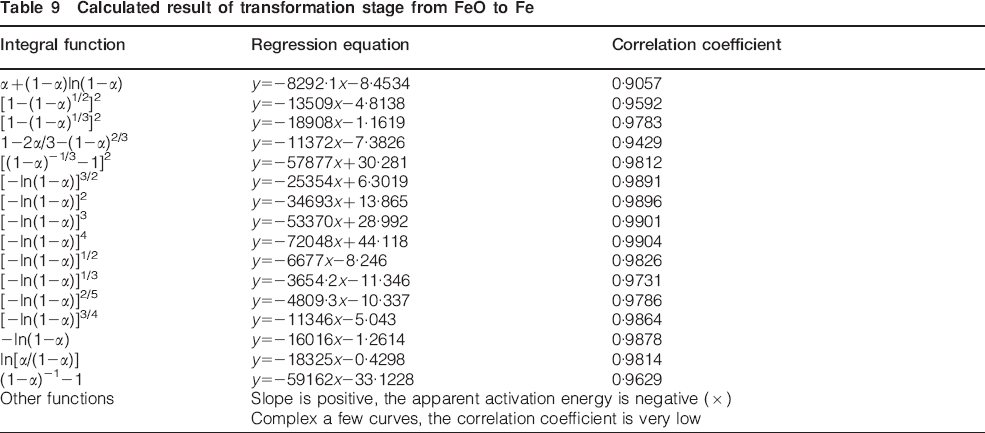
The transformation stage from FeO to Fe
It can be seen from Table 9 that the maximum of related coefficient is 0·9904. The corresponding integral function is
 , and the mechanism function is
 . The calculation manifests the apparent activation energy E = 598·72 kJ mol−1, pre-exponential factor
 , and the stage belongs to the random nucleation and subsequent growth of Avrami–Erofeev equation. The comparison between the measured and calculated on reaction fraction of the final reduction phase is shown in Fig. 8.
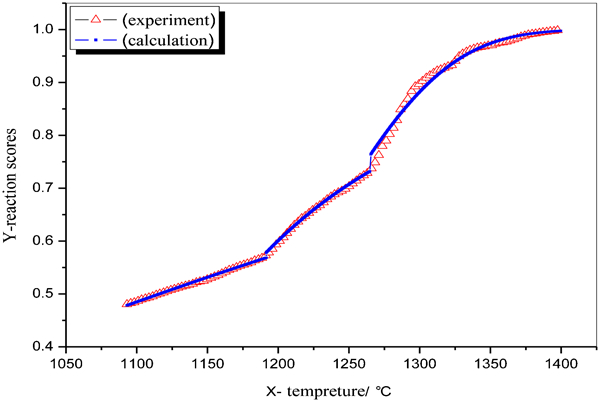
Phase III(B) comparison between measured and calculated
Calculated result of transformation stage from FeO to Fe
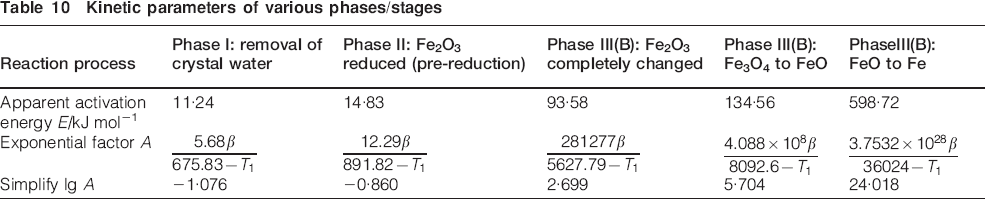
As shown in Table 10, the apparent activation energy of each phase/stage appears an increasing trend along with the temperature increasing, which illustrates that the reaction starts only when the external energy can at least provide the needed amount of activation energy. In addition, according to Fig. 9, lg A and the apparent activation energy E are in significant linear fitting relationship.
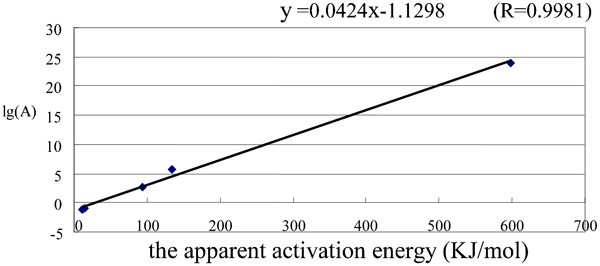
Curve of compensation effect
Kinetic parameters of various phases/stages
Conclusion
This paper provides the TGA experiments with direct smelting reduction of Huimin high phosphorus iron ore based on five different alkalinities. With the help of TG-DSC curves, a detailed analysis of the iron oxide's direct reduction process in carbon atmosphere is also presented. First, the results shows that the whole direct smelting reduction process can be clearly divided into five stages: removal of crystallisation water; Fe2O3 reducing stage (pre-reduction); the fully transformation stage of Fe2O3; the transformation stage from Fe3O4 to FeO; and the transformation stage from FeO to Fe.
Second, the analyses and the calculated results of each stage indicate the following conclusions.
For removal of crystallised water stage, the mechanism function is
 .
.
For Fe2O3 reducing stage (pre-reduction), the mechanism function is
 .
.
For the transition phase of molten stage: this stage is mainly about physical change, which can be learned from both the correlation coefficient and the image of DDSC.
For the fully transformation stage of Fe2O3, it is a stage not only for the complete transformation into Fe3O4 but also for the volatilisation, the mechanism function is
 .
.
For the transformation stage from Fe3O4 to FeO, the mechanism function is
 .
.
For the transformation stage from FeO to Fe, the mechanism function is
 .
.
1, 2, 4 and 6 belong to the random nucleation and subsequent growth of Avrami–Erofeev equation; while 5 belongs to a slow-down α−t curve.
Finally, through a regression analysis between apparent activation energy E and lg A, it is found that there is a linear fitting relationship between them as
 .
.
Footnotes
Acknowledgements
This study is supported by National Natural Science Foundation of China under Contract no. 51064015, and National Science Council, Taiwan (NSC 100-2628-H-161-001-MY4; NSC 100-2811-H-161-001).