
Abstract
Thermodynamic analysis was carried out to interpret the results of corrosion testing of nickel ferrite samples in cryolite-based baths. The equilibrium between cryolite-based baths and nickel ferrite was considered.
Isopleths between cryolite-based baths and nickel ferrite confirmed that for the temperature range of interest (1223–1273 K) there was limited solubility of nickel ferrite in the bath.
To better understand the formation of the metal from nickel ferrite, the effect of reducing potentials on nickel ferrite and nickel ferrite–cryolite-based bath systems were considered. The formation of a metal phase was predicted at relatively high pO2. The metal phase was nickel-rich at higher pO2, becoming enriched in iron as the pO2 decreased. The oxide phases seen in corroded nickel ferrite samples corresponded to the spinel phase in the thermodynamic calculations. Penetration of aluminium oxides into the spinel phase seen in the experimental samples occurred only under a reducing potential.
Introduction
Renewed interest in the sidewall materials used in the Hall–Héroult cells has been driven by a desire to eliminate the solid cryolite ledge (Nightingale et al., 2011, 2013; Mukhlis et al., 2010). Currently used carbonaceous or silicon carbide-based sidewall refractories rely on the formation of the solid ledge of cryolite to help prevent attack. This ledge is formed by wall cooling, and the resultant energy losses can represent up to 35% of the total input power (Grjotheim and Welch, 1988) to the cell. The use of refractories that do not require this cooling/ledge formation could result in significant energy/cost savings and reduce the environmental impact of aluminium production. It may also allow the use of larger anodes, increasing the production capacity and productivity of a given cell or Al pot.
Recent work on the corrosion of nickel ferrite spinel, NiFe2O4, in cryolite shows that it might be suitable as an alternative sidewall refractory (Nightingale et al., 2011, 2013; Mukhlis et al., 2010; Yan et al., 2007; Downie, 2007). It could be used as either as a bulk refractory in non-metal contact areas, or as part of a multi-refractory system. The primary potential weakness of nickel ferrite is the possibility of contamination of the molten aluminium product.
Laboratory scale experiments were undertaken to examine the suitability of nickel ferrite as a sidewall refractory in the Hall–Héroult cell (Nightingale et al., 2011, 2013). The corrosion testing was carried out by immersing nickel ferrite samples in a cryolite-based bath at 1273 K for the time period between 2 and 24 h. In these experiments, it was found that the mechanism of corrosion was complex, involving the reduction of the nickel ferrite to a nickel-rich nickel–iron alloy and penetration of aluminium oxide from the bath into the original oxide material. Figure 1 shows a typical cross-section of the interface between the bath and a nickel ferrite sample after corrosion testing.
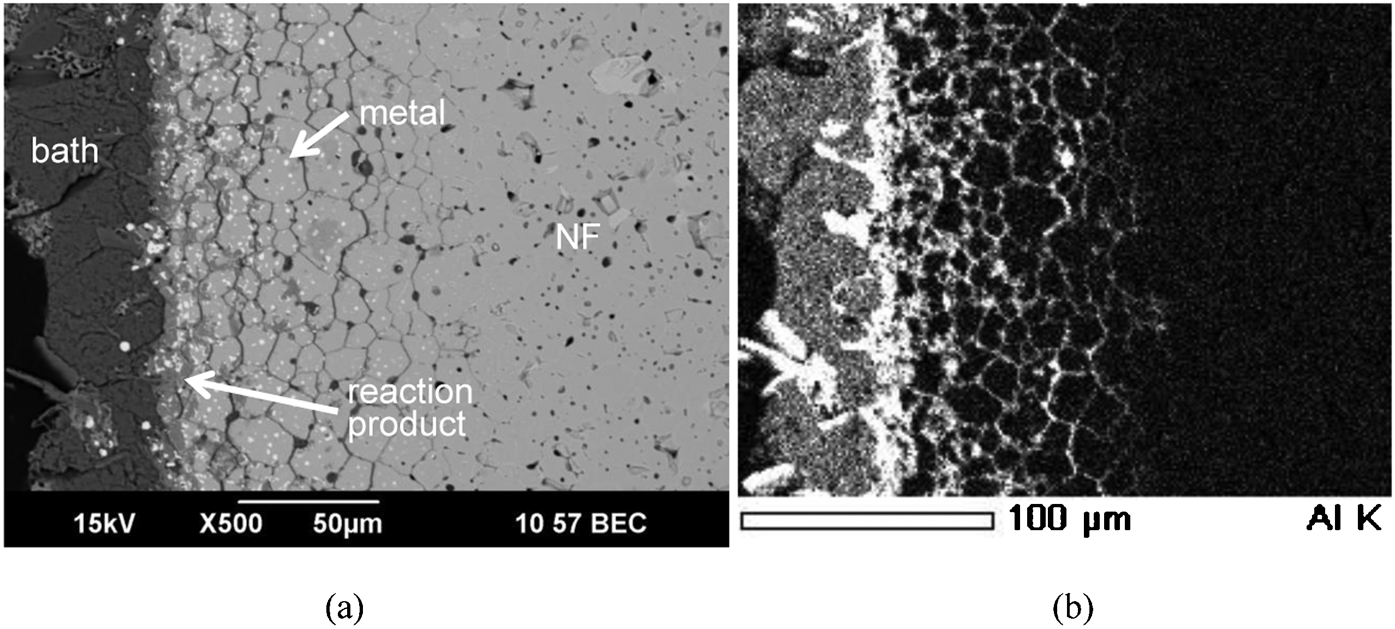
Typical microstructure of nickel ferrite after corrosion testing in 10% alumina-cryolite bath at 1273 K for 4 h. a Nickel ferrite–bath interface. b Elemental map of aluminium for the same region (Nightingale et al., 2013)
During the corrosion of the nickel ferrite samples in the cryolite baths two main phenomena were observed: the formation of a metal phase, and the deposition and penetration of aluminium oxide in the microstructure, in the grain boundaries and near the bath–sample interface, which is shown in Fig. 1 (Nightingale et al., 2011, 2013). Corresponding to these phenomena were changes in composition of the nickel ferrite across the interface, as well as the formation of new phases.
In order to understand the corrosion/degradation products of the corrosion experiments thermodynamic analysis has been carried out using published thermodynamic data, as well as the thermodynamic modelling package MTDATA 5·10 (Davies et al., 2002).
The aim of this study was to use thermodynamic modelling to better understand the corrosion processes that were observed in the small scale corrosion testing. Two main streams of thermodynamic calculations were carried out, the first considered the equilibria between nickel ferrite and cryolite-based baths, and the second considered the reduction of nickel ferrite as well as the equilibria between nickel ferrite and cryolite-based baths under reducing conditions.
Experimental
Stoichiometric samples of nickel ferrite were corroded by immersing them in a cryolite-based bath. The production and corrosion testing of stoichiometric nickel ferrite samples was described in detail in the study by Nightingale et al. (2013). Samples from that study were subsequently further analysed using electron probe microanalysis (EPMA) for improved elemental analysis. Large areas (up to 1024×1024 μm) of each sample were mapped using a step size of 0·5 μm. The elemental mapping data was then processed using Chimage, a software package developed by CSIRO for automated phase analysis from EPMA data (Harrowfield et al., 1993; Wilson and MacRae, 2005). Regions in the maps were separated into distinct phases, and the average composition of each given.
Initial EPMA conditions used were a 12 kV accelerating voltage, 64 nA beam current, with a 25 ms dwell time. These were found to give some apparent intermixing during the phase analysis. To improve the resolution of the analysis, the EPMA conditions were changed to 10 kV accelerating voltage, 50 nA beam current and 0·4 μm step size. The results of the elemental analysis by EPMA are only semi-quantitative as the background and matrix effects were not taken into account.
Thermodynamic model background
Thermodynamic modelling was carried out using MTDATA 5·10. MTDATA determines the chemical equilibrium of a system by minimising its Gibbs energy with respect to the amounts and compositions of all phases that might form (Davies et al., 2002; Taskinen et al., 2005). In order to do this, the Gibbs energy of each competing phase is expressed as a function of composition and temperature.
Different models are used for crystalline and liquid solution phases. The model used for crystalline solution is the compound energy model, which is described in detail in Barry et al. (1992). In this model, ionic species are assumed to mix independently on a series of separate sublattices. The sublattice structure within this model is based upon crystallographic data. As well as the thermodynamic properties of the crystalline phases, the distribution of ions on different sites and other properties are included in the model.
The liquid (bath) phase is modelled in terms of a series of non-ideally interacting species (Barry et al., 1993; Taskinen et al., 2005; Gisby et al., 2007). These can either be pure oxides or fluorides, such as CaO and SiO2, or associated species, such as CaSiO3 and Ca2SiO4, which are used to take into account sharp changes in the thermodynamic properties of the liquid phase at particular compositions. The associate model (Chuang and Chang, 1982) is used for liquid oxides, fluorides and metals within the same set of data.
The databases used for the calculations were NPLOX_5NI, NPLOXF and SGSOL. NPLOX_5NI was a custom database which added data for nickel to the existing metal oxide database (NPLOX_5). NPLOXF was also a custom database that included the Ni–Fe–Na–Al–Ca–F system. SGSOL (version 4·31) was a standard database for metallic solutions. Both the NPLOX_5NI and SGSOL databases included data for oxygen in the gas phase. Overall, within the databases the Ni–Fe–O–Na–Al–Ca–F system has been modelled fully taking into account thermodynamic and phase equilibrium data for all sub-systems, from binary, ternary, and up to septenary, where available. All compounds and solutions within this system known to be stable at equilibrium were included in the database.
To facilitate calculation gases other than oxygen in the gas phase and oxygen solution in the metal phase have been neglected in MTDATA. It has been assumed that while there may be some effect on the absolute pO2 value calculated and the associated phase equilibria, that this effect would be small.
The compositions for many of the MTDATA calculations were chosen so that there was an excess of oxygen. This was done to ensure that there would always be oxygen present in the gas phase, and allowing the partial pressure of oxygen to be controlled.
Constant pressure bath – nickel ferrite isopleths
To understand the behaviour of the nickel ferrite in a cryolite-based bath, isopleths were calculated using MTDATA. In these calculations, the composition was varied from the bath composition to nickel ferrite at a constant pressure. The isopleths are phase stability diagrams that represent pseudo-binary sections taken across temperature–composition space.
The isopleth for the simplified system containing cryolite and nickel ferrite is shown in Fig. 2. The diagram can be seen as a eutectic between the cryolite and the nickel ferrite. For the temperatures of interest (1223–1273 K), there is generally liquid bath and spinel, with solid cryolite present below 1253 K. The spinel phase in Fig. 2 has a composition close to that of nickel ferrite. This is not fully representative of the bath composition used in experiments, as it contains CaF2 and has excess AlF3 to lower its melting temperature.
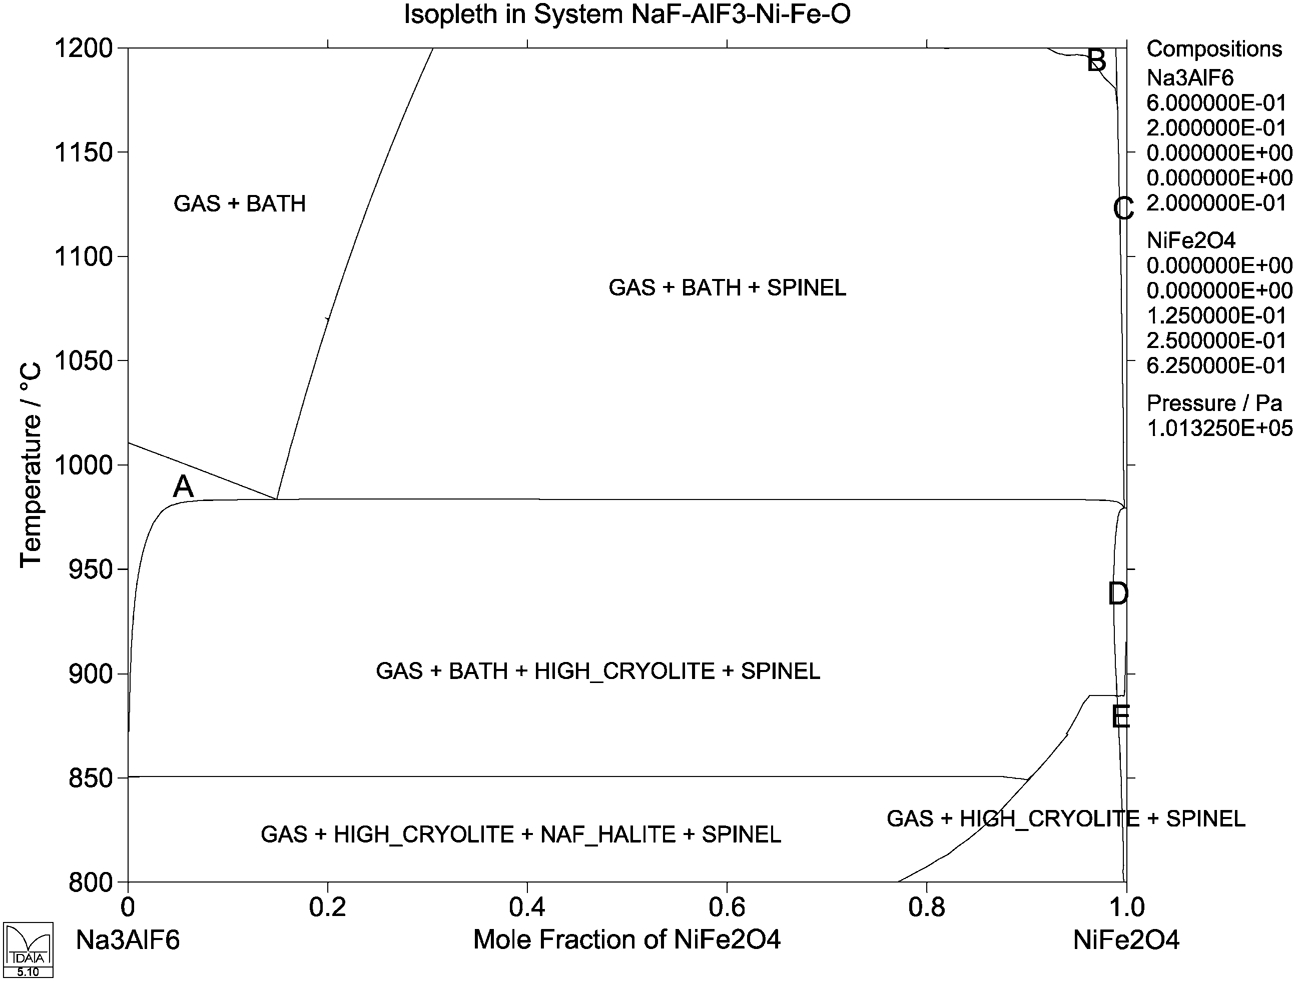
Na3AlF6–NiFe2O4 isopleth, calculated at P = 101325 Pa (1 atm)
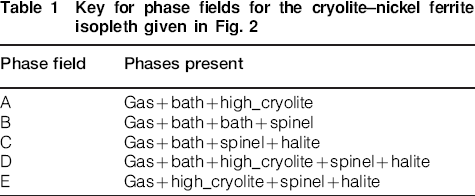
Key for phase fields for the cryolite–nickel ferrite isopleth given in Fig. 2
To assess a system more representative of the experiments, the experimental bath composition (82·1 wt-% Na3AlF6–2·9% AlF3–5·0% CaF2–10·0% Al2O3) and nickel ferrite were used in generating an isopleth, noted as ‘Bath’ and NiFe2O4 respectively in Fig. 3. The key for the phases for each field given in Fig. 3 are listed in Table 2. From this figure, it can be seen that over the temperature range of interest, 1223–1273 K, for the majority of compositions there will be a two-phase region of liquid cryolite bath and spinel (phase field B). The bath phase has variable composition, different to the input ‘bath’. The presence of the spinel phase over the majority of the composition range shown indicates that there is limited solubility of the spinel (nickel ferrite) in the bath.
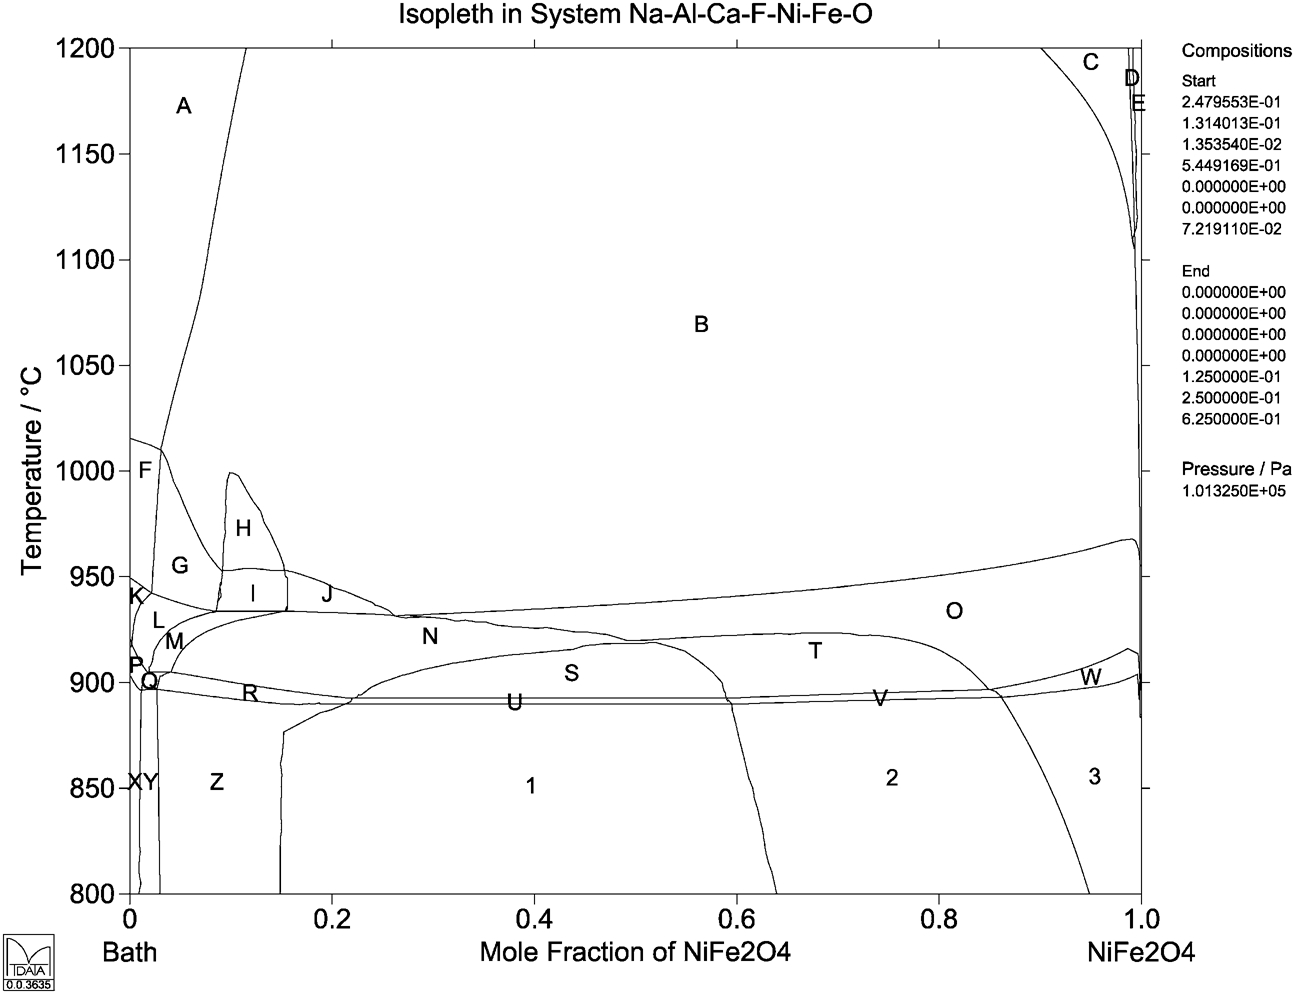
‘Bath’–nickel ferrite isopleth, calculated at P = 103125 Pa (1 atm). The composition of the ‘bath’ is 82·1 wt-% Na3AlF6–2·9% AlF3–5·0% CaF2–10·0% Al2O3
Key for phase fields for the bath–nickel ferrite isopleth given in Fig. 3
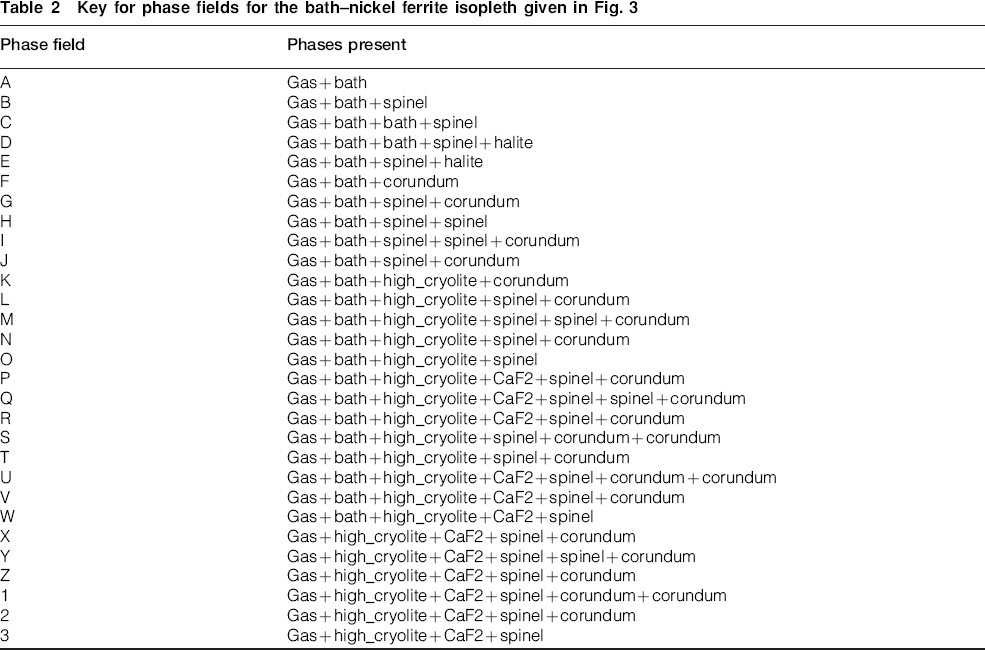
At the ‘bath’-rich end of the system, the isopleth shows the formation of a corundum (alumina, from the saturated bath) phase (fields F, G, I and J). A miscibility gap in the spinel phase is found at the bath-rich end of the diagram. At low temperatures towards the nickel ferrite end of the system, solid cryolite is formed (field O). As expected, there is no metal formation under the highly oxidising calculation conditions (p = 1 atm, only O2 in gas phase).
Assessment of the reduction of nickel ferrite
The isopleths did not agree with what was found in the experimental samples (Nightingale et al., 2011, 2013). Further analysis was conducted to better represent the reducing experimental conditions, through consideration of published thermodynamic data and using MTDATA.
Predicted nickel ferrite reduction by consideration of published data
Several possible reactions were proposed in Nightingale et al. (2013) to investigate the formation of metal by the reduction of nickel ferrite at the bath–sample interface. The reactions proposed represented the reduction of nickel ferrite to different combinations of nickel and iron metal and oxides. It was found that the reduction of nickel ferrite to metallic nickel and wüstite and the reduction of the nickel ferrite to metallic nickel and iron were the thermodynamically favoured reactions, shown in equations (1) and (2). The other reactions considered were either not thermodynamically favoured or less favoured than the reduction to metallic nickel and either wüstite or metallic iron. The Gibbs free energies for these reactions under the prevailing conditions found at the bath–solid interface with changing partial pressure of oxygen was calculated from equation (3).


Reaction coefficients and standard Gibbs free energies for reactions (1) and (2)
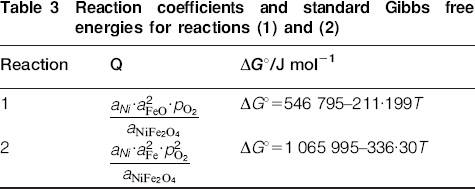
Tabulated thermodynamic data
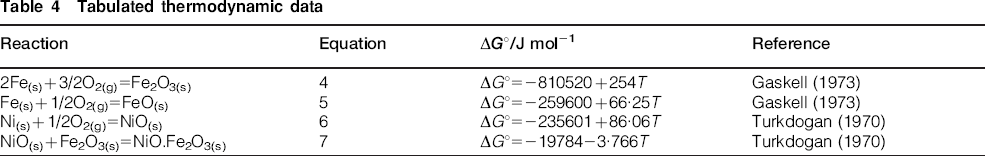
To give a representation of the thermodynamics of the phenomena occurring across the bath–nickel ferrite interface during the corrosion process, different zones were identified within the microstructures of corroded samples, and the activities of the species in each zone were estimated. An example of the zones of a corroded sample is given in Fig. 4. Zone 1 was related to regions in the corrosion samples away from the bath–sample interface. Zone 3 was the interface between the bath and nickel ferrite. Zone 2 was the region intermediate between zones 1 and 3. Within the reaction zones, the product phases present were identified and the composition for each phase as measured by EPMA is given in Table 5. The compositions reported are averages based on the analysis of the bath–nickel ferrite interface of several samples.
Representative image indicating different zones within the corroded samples. Image is taken from a nickel ferrite sample corroded for 4 h
Semi-quantitative average composition (in mol.-%), as measured by EPMA at CSIRO, of different phases found in the corroded samples and the zones in which the phases are typically found.
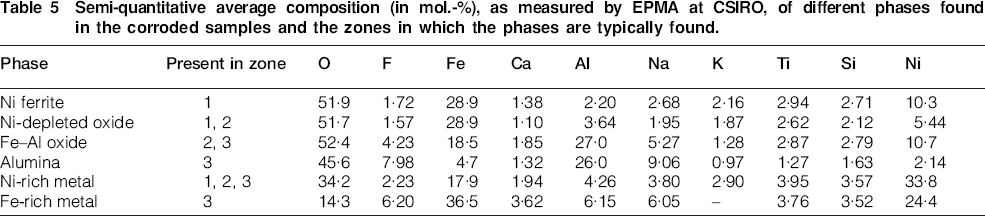
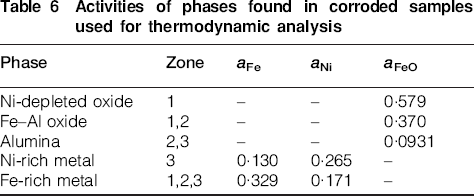
MTDATA was used to calculate the activities of both iron and nickel in a binary alloy as a function of the composition. The activities of iron and nickel in a binary alloy were then determined using the measured compositions. The activity of nickel ferrite was assumed to be unity, while the activity of any product oxides were assumed to be ideal Raoultian (i.e. ai = xi). The activities used for the thermodynamic analysis are given in Table 6.
Activities of phases found in corroded samples used for thermodynamic analysis
The effect of pO2 on the Gibbs free energies for reactions (1) and (2) in each of the different zones is shown in Fig. 5. Under the conditions considered, the Gibbs free energy for reaction (1) was more sensitive to the compositions examined than for reaction (2). Reaction (1) became possible (ΔG<0) at a pO2 of 1·9×10−11 atm for zone 1, 9·7×10−11 atm for zone 2, and 7·5×10−10 atm for zone 3. Reaction (2) became favoured over reaction (1) when the pO2 decreases below 2·0×10−15 atm for zone 1, 3·2×10−16 atm for zone 2, and 5·2×10−17 atm for zone 3, with the majority of this difference caused by reaction (1). This can be interpreted as an indication of an oxygen potential gradient across the bath–sample interface, with the more reducing conditions towards the outside. This agrees with what is seen in the corroded samples. In Fig. 4 and Table 5 it can be seen that the harder to reduce oxides (alumina) were present at the interface, while the more easily reduced oxides (nickel oxide) were more prevalent towards the interior of the samples, and iron-rich oxides in the intermediate region.
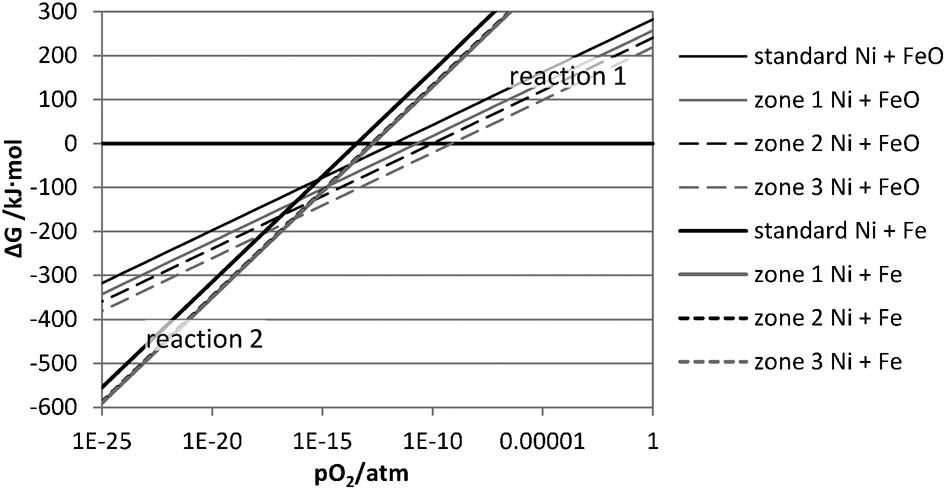
Change in the Gibbs free energy at 1000°C for reactions (1) and (2) with changing partial pressure of oxygen in the different zones within a sample
As expected, decreasing the activity of the products decreases the ΔG at a constant pO2 or decreased the pO2 at which the reactions became favourable. The activity of iron oxide had a larger effect than the activity of either of the metal products. This is consistent with what may be expected from consideration of pO2 effects on the equilibrium constant. The pO2 in reaction (2) is proportional to
 , and proportional to aNi. In reaction (2), pO2 is proportional to
 and aFe. Thus it would be expected that variations in aFeO have a larger effect than variations in the metal activities.
Predicted nickel ferrite reduction using MTDATA
The effect of reducing potential on the nickel oxide–iron oxide system at 1273 K was assessed using MTDATA and is shown in Fig. 6. Metal formation occurs at quite high oxygen partial pressures, from 2·5×10−6 Pa (2·5×10−11 atm). As the metal phase forming is nickel-rich, the spinel phase was found to become progressively rich in iron. At pO2 values below around 10−13 atm the remaining spinel is reduced to a nickel rich metal (designated as Alloy) and iron-rich monoxide (Halite) phase with a composition close to wüstite. At lower partial pressures of oxygen, below approximately 10−15 atm, the stable phase is an iron–nickel alloy. These results are in agreement with what was found and reported previously (Nightingale et al., 2013) and those presented in Fig. 5. The formation of metal occurs at oxygen partial pressures that would be possible within the experimental set-up.
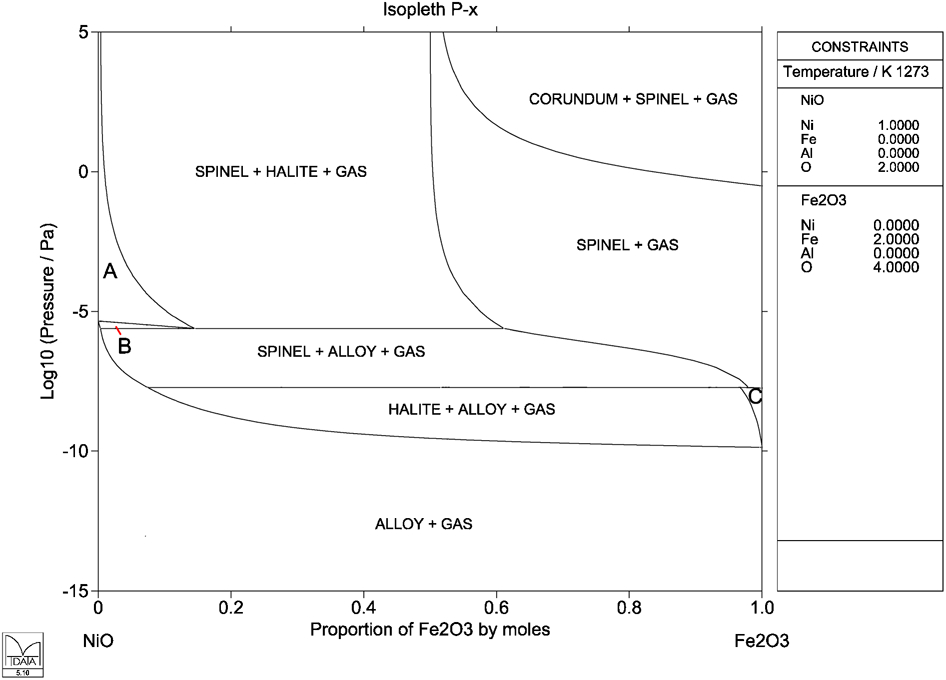
The effect of reducing potential on the nickel oxide–iron oxide system at 1273 K, as calculated by MTDATA
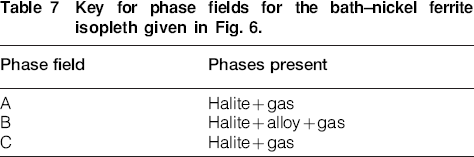
Key for phase fields for the bath–nickel ferrite isopleth given in Fig. 6.
The effect of reducing potential on the nickel ferrite–alumina system at 1273 K, using MTDATA is given in Fig. 7. This system was used to represent/investigate the deposition of aluminium oxides at the bath–sample interface seen in the experimental samples.
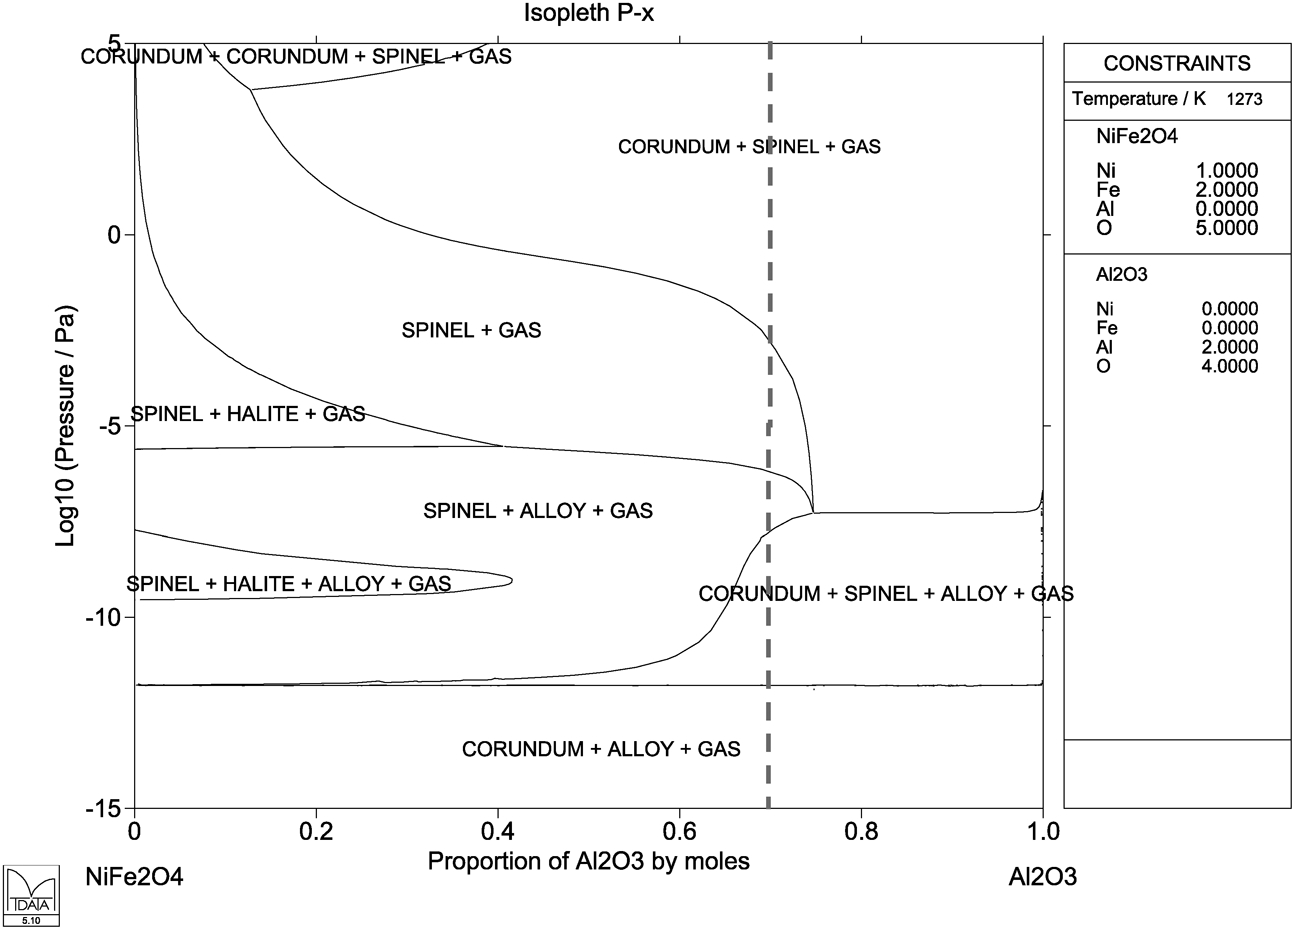
Partial pressure–composition isopleth in the nickel ferrite–alumina system at 1273 K
The formation of several different oxides at different reduction potentials, as well as the formation of metal was predicted. Metal formation occurs at quite high oxygen partial pressures, from 2·7×10−6 Pa (2·6×10−11 atm) at the nickel ferrite side of the diagram to 5·5×10−8 Pa (5·3×10−13 atm) at the alumina-rich side of the diagram. At lower partial pressures of oxygen, below approximately 10−10 Pa (∼10−15 atm), the stable phases are an iron–nickel alloy and an aluminium-rich corundum phase.
A halite phase forms at the left-hand side of the diagram at two different oxygen partial pressure ranges. The halite that forms at the higher oxygen partial pressures was found to be nickel-rich, while that which formed at the lower pO2 values was iron-rich. At high oxygen partial pressures (5·5×103 Pa, 5·4×10−2 atm), a miscibility gap was found in corundum, with one composition being close to alumina, and the other being close to haematite. In other areas of Fig. 7, corundum was seen to have a composition close to alumina.
Additional detailed calculations have been carried out using MTDATA to give the expected compositions of the phases for the case of 0·3 mole fraction alumina (0·7 mole fraction nickel ferrite). The results of these calculations are given in Fig. 8. Again the phases presented in Fig. 8 agree well with those found in the corroded samples, while the potential needed for the formation of these phases would be reasonably achieved during the corrosion testing.
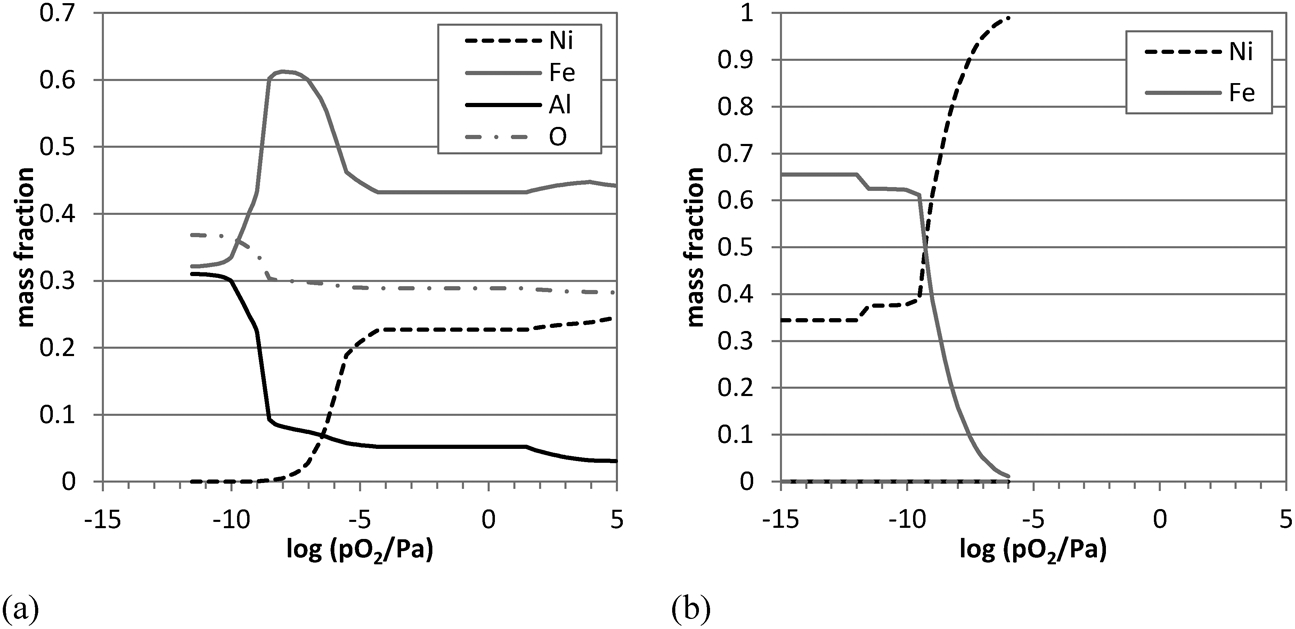
Changes in the compositions of a spinel and b alloy phases with pO2 in the Ni–Fe–Al–O system, at 1273 K and 70% NiFe2O4–30% Al2O3
The spinel phase was found to be the major oxide phase in the system. It can be seen that at higher pO2 values, ∼10−6 Pa (∼10−11 atm), the spinel phase is largely nickel ferrite with some alumina in solution. Between pO2 levels of ∼10−6 and ∼3×10⁻⁹ Pa (∼10−11–3×10⁻¹⁴ atm) the nickel level of the spinel drops rapidly as the nickel oxide is reduced to form a nickel-rich alloy, leaving the spinel phase predominantly as iron oxides. This result agrees with the experimental findings, where oxides depleted in nickel were beside the nickel-rich alloy, in zones 1 and 2 indicated in Fig. 2 and Table 3.
At pO2 values of ∼3×10⁻⁹ to ∼3×10⁻¹² Pa (∼3×10⁻¹⁴ to ∼3×10⁻¹⁷ atm), the aluminium content of the spinel rapidly increases. This also agrees with the experimental findings, as iron–aluminium oxides were found in the samples, in zones 2 and 3 as indicated in Fig. 2 and Table 3. Under these conditions, the composition of the alloy changes rapidly from being nickel-rich to being iron-rich. An iron-rich metal was found in zone 3 as shown in Fig. 2 and Table 3.
At pO2 levels below ∼3×10⁻¹² Pa (∼3×10⁻¹⁷ atm), all of the nickel and iron oxides are reduced, leaving non-spinel alumina as the only oxide remaining in the system. Alumina was found on the outer edges of the interface of the cross-sections of the samples after corrosion testing.
There is good agreement between the results of the thermodynamic modelling of the Ni–Fe–Al–O system in Figs. 7 and 8 corresponding well with the phases and compositions found in the samples after the corrosion testing in the cryolite-based bath. The formation of the aluminium containing phases is dependent on a reduction of the nickel ferrite. This perhaps indicates that the penetration of the aluminium oxides in the samples during the corrosion testing is also dependent on the presence of a reducing potential to occur.
The composition of the spinel phase could be interpreted in terms of the oxidation state of iron in the spinel phase, starting with Fe3+ in the initial nickel ferrite at high pO2 levels. The iron is then reduced to a mix of Fe2+ and Fe3+ when the spinel was mostly iron oxide. At lower pO2 levels, the iron in the spinel phase is predominantly Fe2+ when the spinel consisted of iron and aluminium oxides.
The compositions of the phases present in the cross-sections of the samples after the corrosion tests indicate the presence of a reduction potential gradient across the interface. Phases corresponding to lower pO2 values occur towards the bath side of the interface, while phases corresponding to higher pO2 values occur further away from the bath.
Predicted nickel ferrite reduction in bath–nickel ferrite systems
While the reduction of nickel ferrite and nickel ferrite–alumina systems allowed interpretation of the phases found in the corroded nickel ferrite samples, the effect, if any, of the cryolite-based bath on the reduction also needed to be examined. This was done by examining two systems, a simplified pure cryolite–nickel ferrite system, and a more thorough examination using the experimental bath composition.
The nickel ferrite–cryolite system, Fig. 9, shows the formation of different oxides at different reduction potentials, as well as the formation of metal. Metal formation occurs at quite high oxygen partial pressures. At the nickel ferrite side of the diagram, metal will form when pO2 is below ∼10−6 Pa. Dissolution of nickel and iron into the cryolite is limited at low (below 10−9 Pa or 10−14 atm) and high (above 10−3 Pa or 10−8 atm) pO2 values, but is higher (up to 20 mol.-%) at intermediate reduction potentials when a halite (monoxide) phase is present.
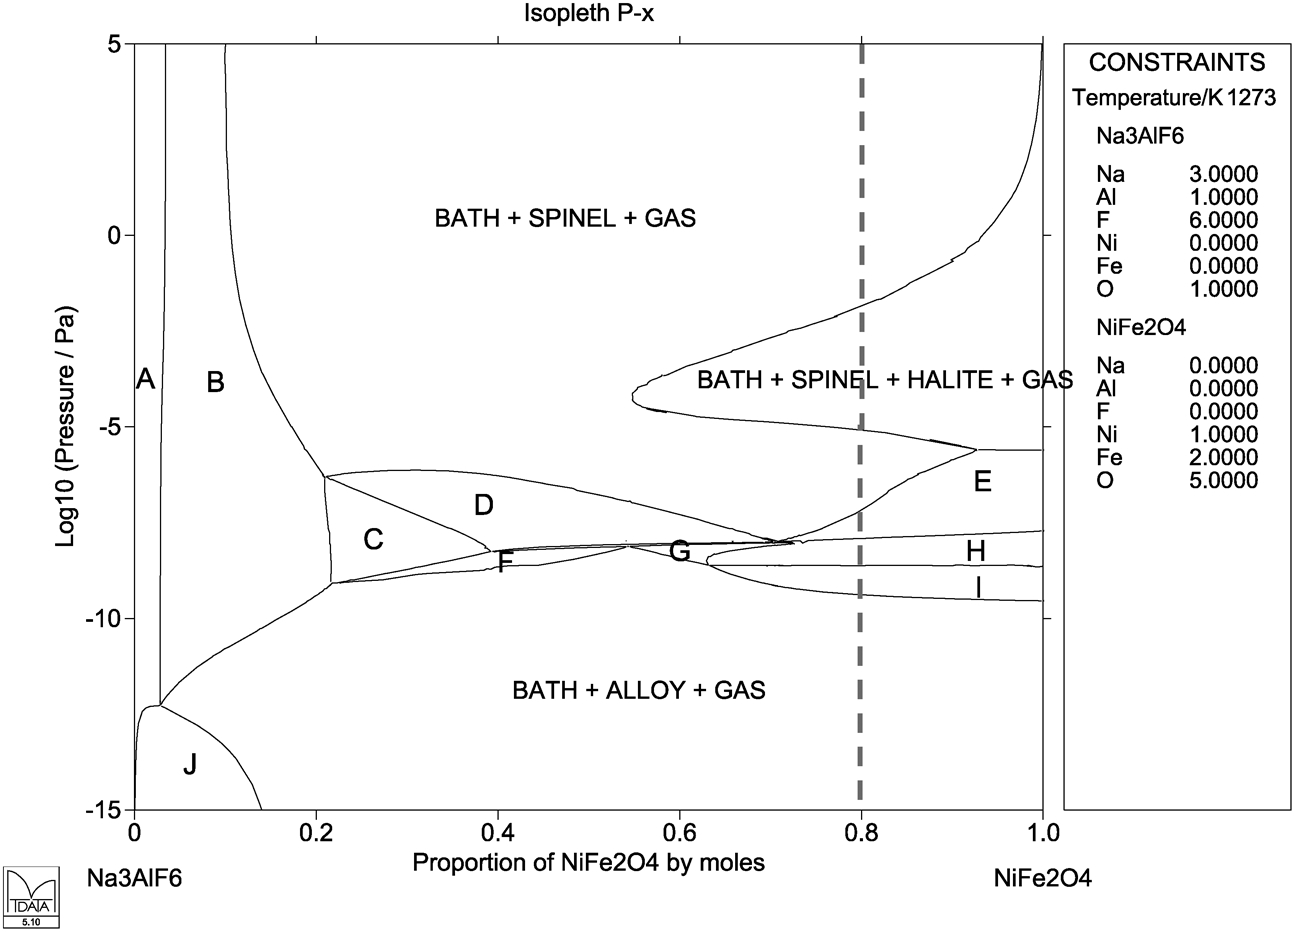
Pressure–composition isopleth in the cryolite–nickel ferrite system at 1273 K
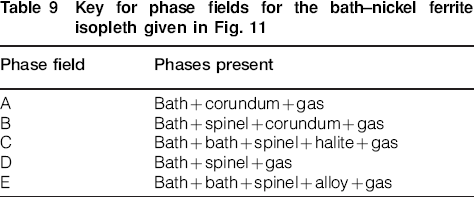
Key for phase fields for the bath–nickel ferrite isopleth given in Fig. 9.
Additional calculations were carried out using MTDATA to give the expected compositions of the phases for the case of 0·8 mole fraction nickel ferrite and 0·2 mole fraction cryolite. The results of these calculations are given in Fig. 10. The phases presented in Fig. 10 and the compositions in Fig. 10 broadly agree with those found in the corroded samples, while the potential needed for the formation of these phases would be reasonably achieved during the corrosion testing.
Changes in the compositions of a spinel and b alloy phases with pO2 in the Na–Al–F–Ni–Fe–O system, at 1273 K and 80% NiFe2O4–20% Na3AlF6
Spinel was the main oxide phase found in the thermodynamic analysis of the cryolite–nickel ferrite system. At higher pO2 values, above ∼10−3 Pa (∼10−8 atm), the spinel is largely nickel ferrite. As the pO2 decreases from ∼10−3–3×10⁻⁸ Pa (∼10−8–3×10⁻¹³ atm) the nickel content of the spinel decreases, with the formation of a nickel-rich monoxide. Nickel-rich oxides were noted in the corroded samples, but were interpreted as an indication of incomplete formation of nickel ferrite as similar features were noted in uncorroded samples.
At pO2 values below ∼10−5 Pa (∼10−10 atm) aluminium oxides begin to enter the spinel phase, with the aluminium content increasing rapidly below ∼10−8 Pa (∼10−13 atm). Again the presence of an iron–aluminium oxide phase was noted in the corroded samples, however, in these calculations the aluminium content of the spinel was relatively low. The spinel phase became thermodynamically unstable at pO2 values below ∼3×10⁻⁹ Pa (∼3×10⁻¹⁴ atm).
In these calculations, the alloy phase was seen to form when the pO2 dropped below 5×10⁻⁸ Pa (5×10⁻¹³ atm). Initially the alloy was nickel-rich, with the iron content of the alloy rapidly increasing with decreasing pO2. The iron and nickel contents of the alloy largely levelled off below ∼10−11 Pa (∼10−16 atm), when almost all of the iron and nickel was reduced. While nickel-rich metal was found in the corroded samples, it was largely found beside a nickel-depleted nickel ferrite, rather than the largely iron oxide predicted in Fig. 10.
The results of the thermodynamic modelling of the simplified cryolite–nickel ferrite system with changing pO2 do not agree particularly well with the analysis of the microstructures of the corroded samples. This is most likely due to the lack of Al2O3, CaF2 and excess AlF3 in the cryolite which were present in the experimental bath. Owing to this, reduction of nickel ferrite under the experimental conditions could not be adequately approximated using the simplified cryolite–nickel ferrite system.
To better explain the experimental results further calculations were carried out using the full bath composition. The pressure–composition isopleth at 1273 K for the bath–nickel ferrite system is given in Fig. 11. The composition of ‘bath’ in Fig. 10 is the composition of the alumina saturated bath used in the experiments (82·1 wt-% Na3AlF6–2·9% AlF3–5·0% CaF2–10·0% Al2O3). Metal formation occurs at quite high pO2 values. At the nickel ferrite side of the diagram, metal will form when pO2 is below ∼10−6 Pa (∼10−11 atm).
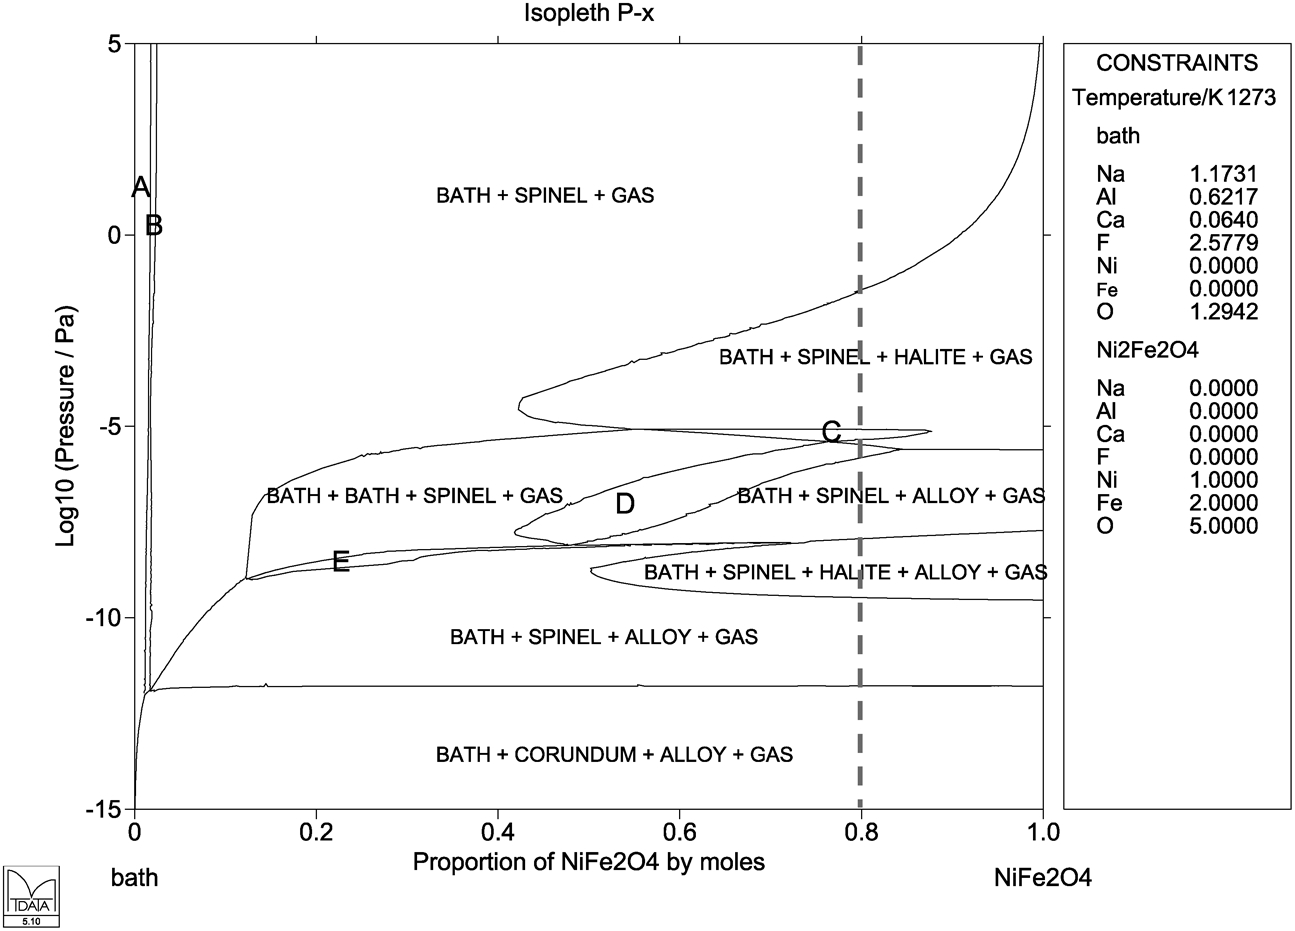
Pressure–composition isopleth in the ‘bath’–nickel ferrite system at 1273 K. The composition of the ‘bath’ is 82·1 wt-% Na3AlF6–2·9% AlF3–5·0% CaF2–10·0% Al2O3.
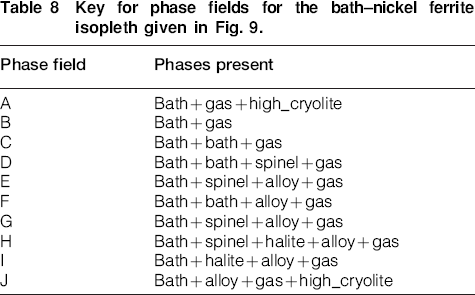
Key for phase fields for the bath–nickel ferrite isopleth given in Fig. 11
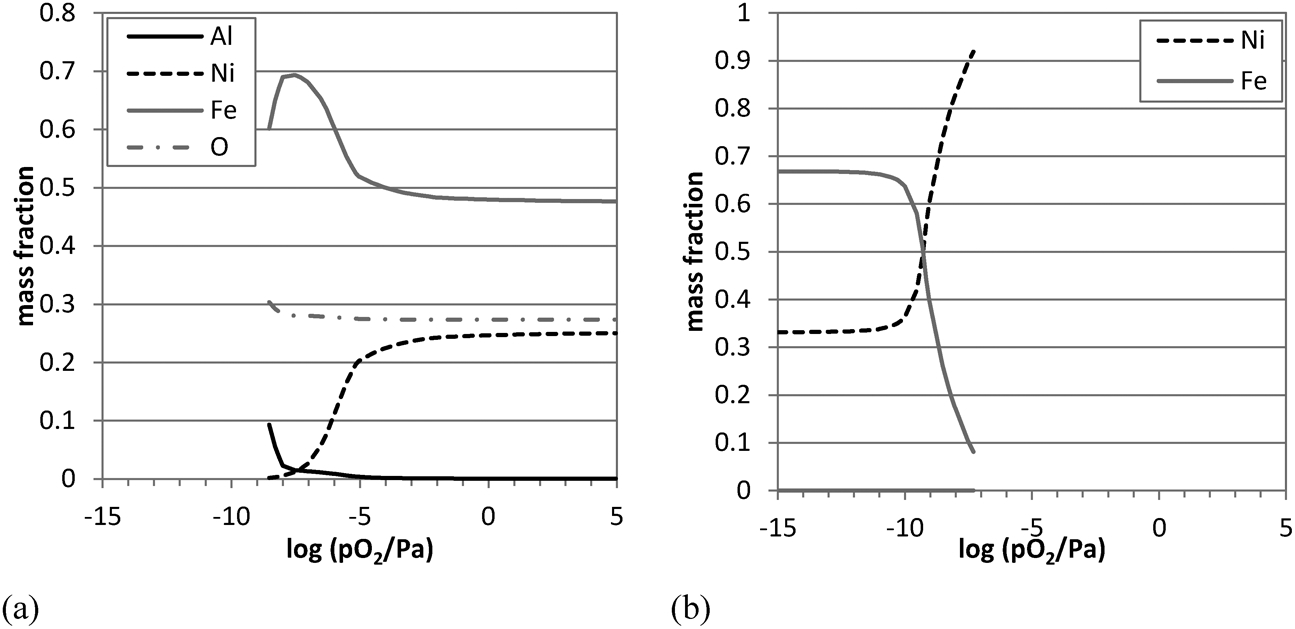
Additional calculations were carried out using MTDATA to give the expected compositions of the phases for the case of 0·8 mole fraction nickel ferrite and 0·2 mole fraction ‘bath’. The results of these calculations are given in Fig. 12. The phases presented in Fig. 11 and the compositions in Fig. 12 agree well with those found in the corroded samples. There is better agreement between the thermodynamic predictions in this system than were found for the simplified cryolite–nickel ferrite system. The potential needed for the formation of these phases would be reasonably achieved during the corrosion testing.
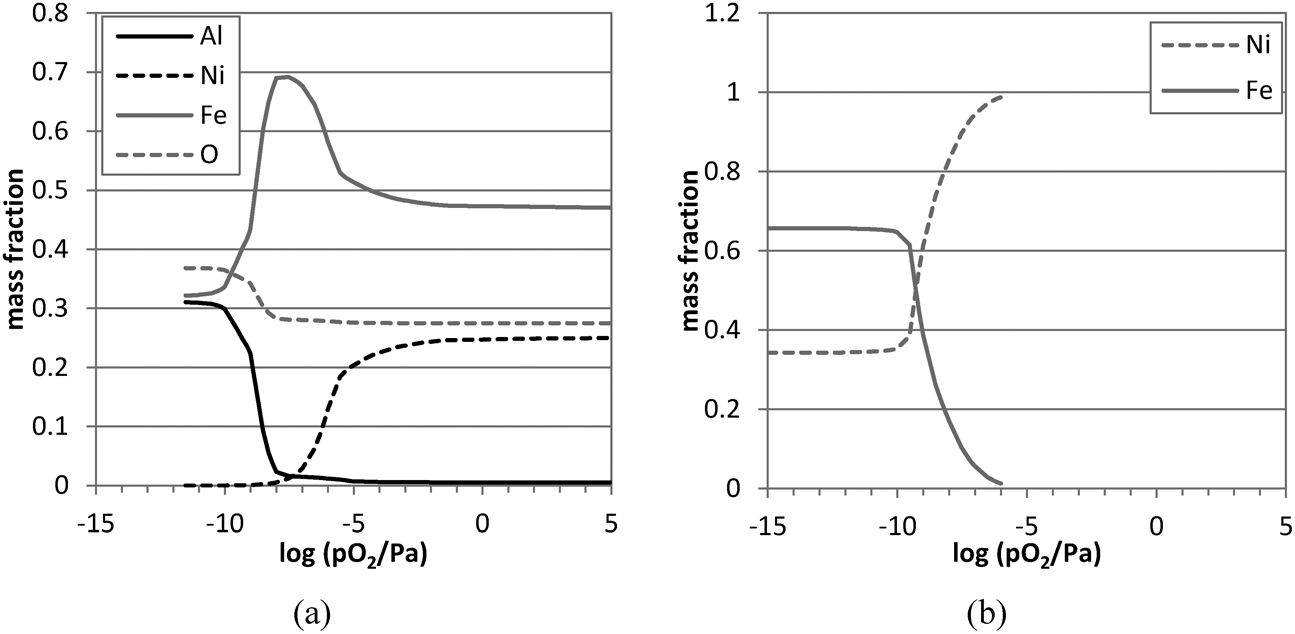
Changes in the compositions of a spinel and b alloy phases with pO2 in the Na–Al–Ca–F–Ni–Fe–O system, at 1273 K and 80% NiFe2O4–20% ‘bath’, where the ‘bath’ composition is 82·1 wt-% Na3AlF6–2·9% AlF3–5·0% CaF2–10·0% Al2O3
Again, spinel was the main oxide phase found in the thermodynamic analysis of the ‘bath’–nickel ferrite system. At higher pO2 values, above ∼10−3 Pa (∼10−8 atm), the spinel is largely nickel ferrite. As the pO2 decreases from ∼10−3–3×10⁻⁸ Pa (∼10−8–3×10⁻¹³ atm) the nickel content of the spinel decreases, with the formation of a nickel-rich monoxide (halite) and an iron-rich spinel. As noted above, nickel-rich oxides in the samples were interpreted as an indication of incomplete formation of nickel ferrite.
Aluminium oxides begin to enter the spinel at pO2 values below ∼10−5 Pa (∼10−10 atm). The aluminium content of the spinel increased rapidly when the pO2 was below ∼10−8 Pa (∼10−13 atm). At pO2 values lower than ∼10−10 Pa (∼10−15 atm) the spinel is predominantly an iron–aluminium oxide. As noted previously, an iron–aluminium oxide phase was present in the corroded samples. Below partial pressures of oxygen of 3×10⁻¹² Pa (3×10⁻¹⁷ atm) the spinel phase becomes thermodynamically unstable.
These pO2 values noted for the changes in composition of the spinel are similar to those in the simplified cryolite–spinel system. However, in this case the spinel remained stable at lower pO2 values than in the simplified system. At the lower pO2 values, the aluminium content of the spinel was higher, better agreeing with the experimental results (Table 3).
In these calculations, the alloy phase was seen to form when the pO2 dropped below 5×10⁻⁶ Pa (5×10⁻¹¹ atm). Initially, the alloy was nickel-rich, but the iron content of the alloy rapidly increased with decreasing pO2. The iron and nickel contents of the alloy largely levelled off below ∼10−10 Pa (∼10−15 atm). These results agree quite well with the compositions of the metal found within the cross-sections of the corroded samples, with nickel-rich metal found further away from the bath (zones 1 and 2 in Fig. 2, Table 3) and iron-rich alloy found closer to the sample–bath interface (zone 3 in Fig. 2, Table 3).
In the thermodynamic calculations examining the effect of reducing potentials on the nickel ferrite–alumina, cryolite–nickel ferrite and ‘bath’–nickel ferrite systems, it was found that the majority of the phases seen in the corroded samples could be interpreted from the results of the spinel phase. This would indicate that the oxides within the samples maintained a spinel structure, over quite a large composition range going from nickel ferrite, through predominantly iron oxide to an iron–aluminium oxide spinel.
Nickel ferrite solubility in cryolite-based baths and driving force for reduction
Up to now, we have examined in depth the thermodynamics of the reduction of nickel ferrite in cryolite-based baths. However, two key issues remain to be discussed: the solubility of nickel ferrite in the cryolite-based baths; and what is driving the reduction of the nickel ferrite in the experimental corrosion tests.
The solubility of nickel ferrite in cryolite and cryolite-based baths can be seen in Figs. 2, 3, 9 and 11. From Figs. 2 and 3, it can be seen that the solubility of nickel ferrite is a function of temperature and bath composition. At 1200°C, Fig. 2 shows that the bath phase can contain up to ∼30 mass-% of nickel ferrite, which drops as the temperature decreases to ∼15% at 1000°C. When the bath composition was changed to that used experimentally, as shown in Fig. 3, the solubility of nickel ferrite dropped significantly. This is most likely due to the presence of alumina in the bath, as alumina has been shown in several previous experimental studies to have a large effect on the solubility of nickel ferrite. DeYoung (1986) and Lai et al. (2006) found that the solubility of nickel ferrite decreased with increasing alumina content of the melt. Alcorn et al. (1993) found that the corrosion rate of nickel ferrite-based cermet inert anodes increased at low alumina contents of the bath. Yan et al. (2007) examined the use of nickel ferrite as Hall–Héroult cell sidewall refractories, and found that the alumina content of the bath had a large effect on the corrosion of the nickel ferrite. At 5% alumina, the testpiece was significantly corroded after 24 h. At 10 and 15% alumina, the measureable corrosion was much lower.
The solubility was also found to vary with the partial pressure of oxygen. It can be seen in Fig. 9 that the solubility of nickel ferrite in cryolite increased from 10 mol.-% at a pO2 of 1 atm to 40 mol.-% at a pO2 of 6·3×10−9 Pa. These values are quite high, but similar to the differences between Figs. 2 and 3, solubility also varies with the bath composition. Figure 11 showed that with the experimental bath composition used the solubility of nickel ferrite in the bath was low, at ∼2 mol.-%.
The variability of the solubility of nickel ferrite with oxygen partial pressure was also expected, based on previous findings in the literature. Yan et al. (2007) in particular examined the corrosion behaviour of nickel ferrite under different atmospheres. It was found that the solubility of nickel ferrite decreased with increasing pO2, as the atmosphere from argon to carbon dioxide to air.
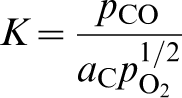
The second key question is what is driving the reduction of the nickel ferrite during the corrosion tests. Consideration of the experimental set-up (Nightingale et al., 2013) indicates that the pO2 in the experimental set-up is low due to two factors. The atmosphere used during the test is high purity (99·99%) argon, which is dried by passing it through drierite and ascarite. However, the main possibility for creating the pO2 values required for the reduction of nickel ferrite would be from the graphite crucible used to contain the experimental bath. Considering the reaction


Conclusion
Thermodynamic analysis has been carried out to interpret the results of corrosion testing of nickel ferrite samples in cryolite-based baths. This was done by considering the equilibria between cryolite-based baths and nickel ferrite and by considering the effect of reducing potentials on nickel ferrite and nickel ferrite–cryolite-based bath systems.
Isopleths between cryolite-based baths and nickel ferrite at 1 atm confirmed that for the temperature range of interest (1223–1273 K) there was limited solubility of nickel ferrite in the bath. The bath composition was found to play a large role in the solubility of the nickel ferrite, with the alumina content of the bath most likely lowering the solubility of nickel ferrite. Further isopleths calculated with varying pO2 showed that the solubility of the nickel ferrite changed with pO2.
Reducing potentials were necessary to replicate the results seen in the corroded nickel ferrite samples. From investigation of the reduction of nickel ferrite it was found that the formation of a metal phase was predicted at relatively high partial pressures of oxygen. The metal phase was found to be initially nickel-rich at higher pO2, while becoming progressively enriched in iron as the pO2 decreased.
The calculated compositions of the spinel phase corresponded well with many of the oxide phases observed in nickel ferrite samples after corrosion in cryolite-based baths. Penetration of the aluminium oxides into the spinel phase, as seen in the experimental samples, occurred only under a reducing potential. The predicted phases at equilibrium at different partial pressures of oxygen agreed well with the phases found in close proximity for the nickel ferrite–alumina and ‘bath’–nickel ferrite system (for the full bath composition). It was found that the simplified cryolite–nickel ferrite system did not give an adequate representation of the experimental system.
The reduction of the nickel ferrite seen during the corrosion testing, and thermodynamically simulated here, was most likely driven by the graphite crucible used to contain the cryolite-based bath.
Footnotes
Acknowledgment
The authors would like to express their gratitude to the CSIRO's Light Metals and Minerals Down Under Research Flagships for supporting this research as part of the ‘Breakthrough technology for primary aluminium’ research cluster, and to Mark Pownceby for his assistance with the EPMA analysis. The authors acknowledge the use of the JEOL-JSM6490 LV SEM at the UOW Electron Microscopy Centre.