
Abstract
The beneficiation of graphite is very costly and energy intensive and can necessitate multiple processing steps, often including flotation. Products have to satisfy very stringent quality criteria. To decrease beneficiation costs, a careful characterisation of feed and concentrate materials is needed. This study elucidates the additional benefit of methods of automated SEM-based image analysis, such as mineral liberation analysis (MLA), in addition to ‘traditional’ methods [optical microscopy and X-ray powder diffraction (XRD)] for the analyses of graphite raw materials and processing products. Owing to the physical and chemical properties of the mineral graphite, samples require delicate sample preparation as well as particular backscattered electron (BSE) imaging calibration for automated image analysis. These are illustrated in this study. The results illustrate that SEM-based image analysis of graphite feeds and concentrates can provide accurate and reliable information for the graphite beneficiation process. This applies to both mineralogical characteristics and process relevant parameters.
Keywords
Introduction
Graphite, a crystalline form of native carbon with a sheet-like crystal structure (Rösler, 1991), has a unique combination of physical properties, e.g. good thermal and electrolytic conductivity, outstanding lubrication properties, resistance against chemicals as well as temperature-change resistance. Because of these properties graphite has a wide range of industrial applications, including the production of graphene. The beneficiation of graphite is influenced by its crystallinity, flake size and the nature and distribution of associated gangue minerals (Acharya et al., 1996). It may compose of a variety of processes, including crushing, grinding, screening, tabling, flotation, magnetic separation, and electrostatic separation (Andrews, 1992). Beneficiation intricacy can vary from simple hand sorting and screening of high-grade ore to a multi-stage flotation process (Olson, 2012). As mineral beneficiation is both energy and cost intensive, graphite raw materials and beneficiation products need to be characterised very carefully to optimise the beneficiation process chain. Currently, graphite raw materials are characterised using optical microscopy, X-ray powder diffraction (XRD), differential thermal analysis/thermogravimetry (DTA/TG), Raman spectroscopy, secondary ion mass spectrometry (SIMS) as well as chemical analysis (see, for example, Kwiecinska et al., 2010; Patnaik et al., 1999; Volkova et al., 2011; Patil et al., 1997).While these analytical methods provide a host of relevant information, only optical microscopy will provide at least some information about mineral association, liberation or locking, and all attributes relevant parameters to understand the success of beneficiation. However, optical microscopy is very time-consuming and thus expensive, with results often biased by the human factor. For many raw material types, this situation has been greatly improved by the use of automated SEM-based image analysis, for example with a mineral liberation analyser (Fandrich et al., 2007; Gu, 2003) or a QEMSCAN system (Gottlieb et al., 2000; Pirrie et al., 2004; Sutherland and Gottlieb, 1991).
Automated SEM-based image analysis has already been successfully applied to coal (Creelman and Ward, 1996; Liu et al., 2005; Moitsheki et al., 2010; O'Brien et al., 2011; van Alphen, 2007). However, its use has never been tested for graphite raw materials. This study thus explores the application of automated SEM-based image analysis for the characterisation of graphite raw materials and beneficiation products.
Sample preparation and analytical methods
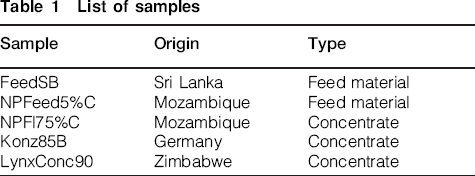
Five crushed graphite samples were provided by the German-based AMG Mining AG for method development. These samples consisted of two crushed feed samples and three concentrate samples, which were each unsized. The samples originated from four different localities (Table 1). Before analysis no other data were furnished by AMG Mining for these samples.
List of samples
For automated SEM-based image analysis, polished sample surfaces of very high quality, as well as a very consistent backscattered electron (BSE) imaging condition that enables differentiation of different mineral particles and extraction of particles from the mounting medium, are needed. Epoxy resin typically used for grain mount sample preparation cannot be used for preparation of graphite bearing samples as the average atomic number (AAN) for graphite is very similar to that of epoxy resin. Thus the use of conventional epoxy would result in similar BSE grey values for both, which, in turn, would render impossible the distinction of graphite from the mounting medium. Furthermore, graphite is a mineral that is exceptionally soft and with an excellent basal cleavage. Achieving well-polished surfaces and avoidance of smearing of graphite on the sample surface therefore require different preparation procedures compared to coal samples (FEI Company, 2009). Sample preparation was carried out in the Department of Mineralogy, TU Bergakademie Freiberg. To attain a suitable contrast between graphite and mounting medium carnauba wax, having a lower AAN (and thus a lower BSE level) was used for the preparation of the samples according to a technical application note by FEI Company (2009). The graphite-bearing samples were mixed with the carnauba wax in a ratio of 1: 4 (graphite:wax) in 25 mm diameter plastic tubes. Then the samples were placed in an oven at 90°C (melting point of carnauba wax, 84°C) for about 2 h until the wax was thoroughly melted, encasing the sample material, and the particles had sunk to the bottom of the tube. Afterwards the oven was set to 40°C to reduce the temperature slowly to control shrinkage and prevent cracking of the wax block. After cooling, the sample blocks were removed from their tubes and were mounted with epoxy resin in the middle of 30 mm moulds to give the wax strength, prevent it from breaking and provide a stable surface for the polishing process.
The formation of a thin graphite film, a few micrometres in thickness, across the entire sample surface was observed during the polishing of all samples. This film causes reduced contrast and brightness of the BSE image, but has otherwise no detrimental impact as samples because SEM-based image analysis is usually covered by a conducting carbon layer. Because the exact thickness of the graphite film generated during polishing is not known, its presence was addressed by calibrating BSE image parameters using a quartz grain in the FEI's standard block for image calibration (FEI Company, 2009). It needs to be stressed that systematic errors can easily be introduced by sample preparation (Bachmann et al., 2012) and/or choice of analytical parameters. The occurrence or extent of such systematic errors can only be assessed by verification of analytical results using results obtained by independent, well-established analytical methods. For this purpose, data were sourced from other analytical methods, with some of the information directly sourced from AMG Mining.
The polished grain mount specimens were carbon-coated (a few nanometres layer thickness) to provide a conductive coating for non-conducting minerals. Automated image analysis was carried out on a FEI MLA 600F system at the Department of Mineralogy, TU Bergakademie Freiberg. This system is based on a FEI Quanta 600F scanning electron microscope equipped with a field emission gun and two Bruker X-Flash SDD-EDS X-ray spectrometers. The instrument and image acquisition were controlled by the mineral liberation analysis (MLA) software. Measurement modes used included ‘XBSE_STD’ to collect mineral standards and ‘GXMAP’, i.e. grain X-ray mapping at a magnification of 200 times. The analytical working distance during the measurement was 10·9 mm, the emission current was 205 μA, the beam current was 10 nA, and the overall electron beam accelerating voltage was 25 kV.
Quantitative XRD analysis was conducted by the mineralogical laboratory of the Department of Mineralogy, TU Bergakademie Freiberg on two of the samples (FeedSB and NPFeed5%C) using an URD 6 XRD device (Seifert/Freiberger Präzisionsmechanik, Germany) with Co-Kα radiation (40 kV/30 mA). The irradiated length was kept constant at 15 mm and the samples were scanned with 2θ steps of 0·02° in the range from 5° to 80° at step times of 2 s per step. Quantification of powder diffraction patterns was carried out using the Rietveld programs BGMN/AutoQuan (Taut et al., 1998).
Dry sieve classification data were supplied by AMG Mining AG, Kropfmühl, Germany. Silicon oil-based laser diffraction was done at the Institute of Mechanical Process Engineering and Mineral Processing of the TU Bergakademie Freiberg using a Sympatec HELOS based on laser diffraction and a CUVETTE wet dispersing system. Before analysis the diluted suspension (graphite in low viscosity silicon oil) was dispersed by ultrasonication using a 200 W Bandelin sonotrode system for 4 min at 50% pulsation.
Loss-on-ignition (LOI) as a method for measuring carbon content in graphite was conducted by AMG Mining AG, Kropfmühl, Germany. The sample size was 1 g per sample (dry weight), the ignition temperature was 850°C and the exposure time was 20 min.
Results and Discussion
A cursory look at BSE images and extracted particle shapes shows that graphite mineral particles are very well resolved and grain outlines well recovered from BSE images collected (Fig. 1). Based on this impression, the results were processed to assess a comprehensive range of mineralogical and microfabric parameters relevant for beneficiation. These parameters where then, wherever possible, compared to data from alternative analytical tools. The most relevant parameters tested are presented and discussed below.
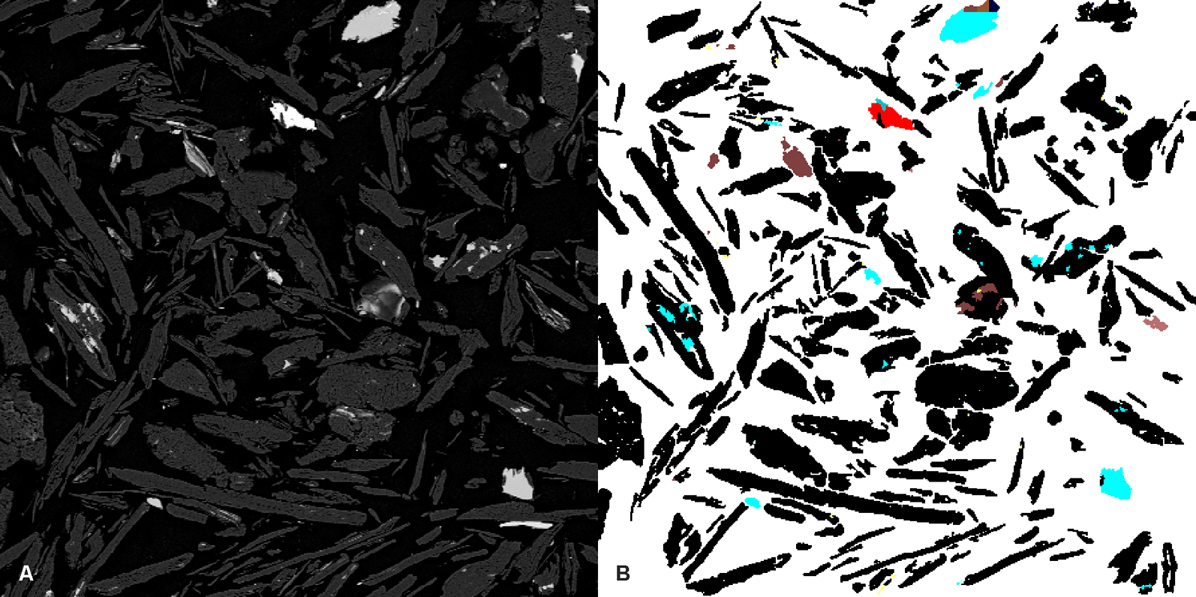
a Backscattered electron (BSE) image of a mineral liberation analysis (MLA) measurement frame of concentrate sample LynxConc90 mounted in carnauba wax (black, matrix of carnauba wax; dark grey, graphite; brighter grey tones, silicates) and b associated false colour image after background extraction and classification of minerals (graphite, black; quartz, blue; clay-minerals, brown; pyrite, red; muscovite, yellow) (size of frame: 500×500 pixels = 1·5×1·5 mm)
The MLA results showed that all five samples are principally composed of graphite and quartz, as well as feldspar and mica of variable composition (Fig. 2). Minor constituents include carbonates, chlorites and clay minerals. The complete mineral list for all samples comprises altogether 45 minerals. It should be noted that the minerals of the alunite group (including alunite, crandallite, jarosite, and natrojarosite), which occur with about 4 wt-% in sample Konz85B and about 1–2 wt-% in samples NPFeed5%C and NPFl75%C, are not primary constituents of the raw material. Instead, these minerals formed by the oxidation of sulphides, e.g. pyrrhotite and pyrite, during storage of these samples. Furthermore, it is noted that each sample contains particular minerals characteristic of particular host rocks that point to the origin and geological context of the graphite raw material. Such minerals include pyroxenes, amphiboles and garnets in sample FeedSB. The presence of such a suite of gangue minerals points to an origin of graphite from charnockite, calc gneiss, or garnet-bearing gneiss. In sample LynxConc90, in contrast, sillimanite was identified suggesting that graphite was extracted from a sillimanite-bearing gneiss.
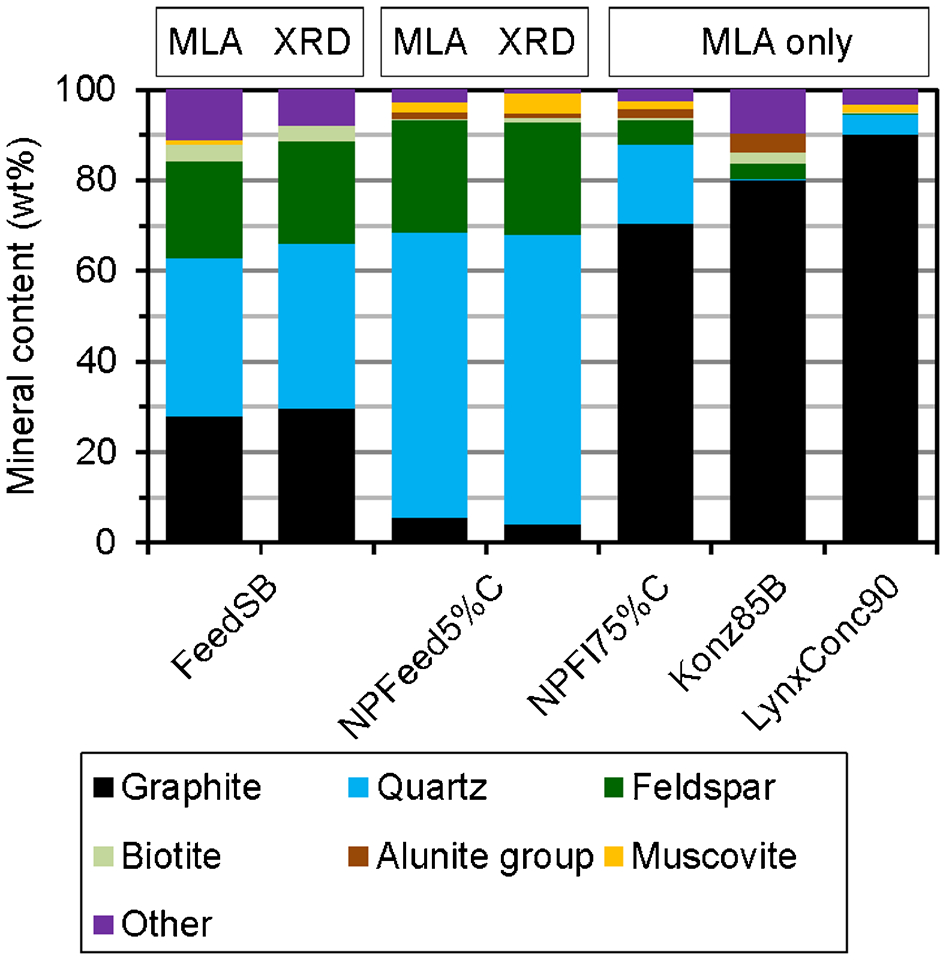
Modal mineralogy of the five graphite samples studied based on mineral liberation analysis (MLA) measurements and results of Rietveld analysis for comparison
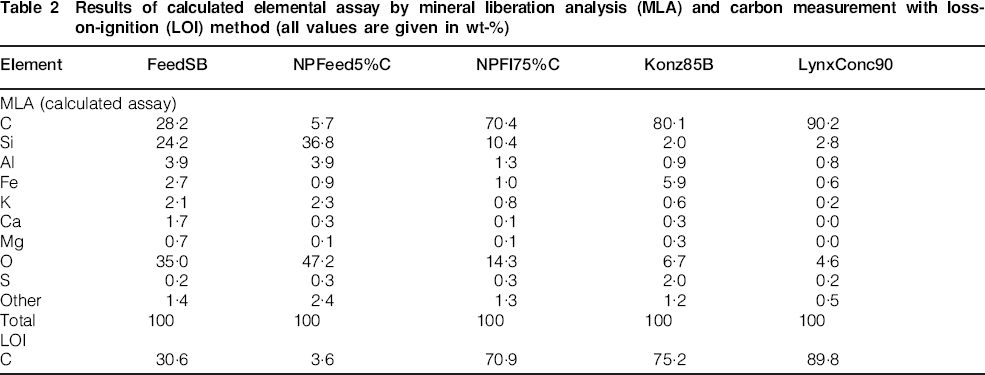
Modal mineralogies obtained by SEM-based image analysis for two feed samples (FeedSB and NPFeed5%C) contrasted with the results from quantitative XRD analysis that demonstrate an excellent agreement between the two analytical methods (see Fig. 2). Similarly, the elemental assay computed by the MLA software from the quantitative mineralogical data and stoichiometric mineral compositions can be compared to actual chemical assays (Table 2). In this case, the calculated carbon content is compared to the carbon concentration measured by the laboratory of the AMG Mining AG, Kropfmühl, Germany based on loss-on-ignition (LOI) determinations. Unfortunately, no analytical error values for LOI analysis are available in geochemical textbooks or in peer-reviewed articles. So it seems impossible to assess the carbon values calculated by MLA in comparison to the LOI determinations.
Results of calculated elemental assay by mineral liberation analysis (MLA) and carbon measurement with loss-on-ignition (LOI) method (all values are given in wt-%)
The results of the MLA particle size investigations show fairly similar size distributions for all samples (with P50 ca. 140–200 μm), except sample Konz85B, which appears to be finer grained (P50 = 51 μm). A similar observation applies to the graphite mineral grain size distributions (Fig. 3). It is to be noted that size data are based on the measured 2D surface of the particles, and grains and were calcualted from the MLA software using the equivalent circle diameter method. For comparison, particle size distributions were also assessed using dry sieve classification and wet laser diffraction (WLD). It has to be stressed that particles >315 μm could not be measured with the WLD instrument used here. This coarse fraction was thus screened off before laser diffraction experiments. In general, the results of dry sieve classification yield a finer particle size distribution than WLD across the central part of the particle size distribution curve (see example Fig. 4 and Supplementary Material). This is in good agreement with a study by Vlachos and Chang (2011) and is attributed to particle shape attributes and their impact on the results of the analytical methods used. Furthermore, it should be considered that particle sizes of very soft minerals, such as graphite, may well be affected by mechanical abrasion during sieve classification. It is also obvious that WLD shows a much larger fraction of very fine particles than the two other methods. Given the physical properties of graphite, it appears likely that fine graphite-rich particles are effectively dispersed, and may be even decomposed, by the ultrasonic dispersion process and mechanical transport (Merkus, 2009). Further explanations for the observed differences could be the classification of particles in the transfer from the sample dispersion unit to the measurement zone, instability of the dispersion or the inclusion of air bubbles. Sieve classification, as well as analysis by MLA, may well suffer from agglomeration of very fine particles.
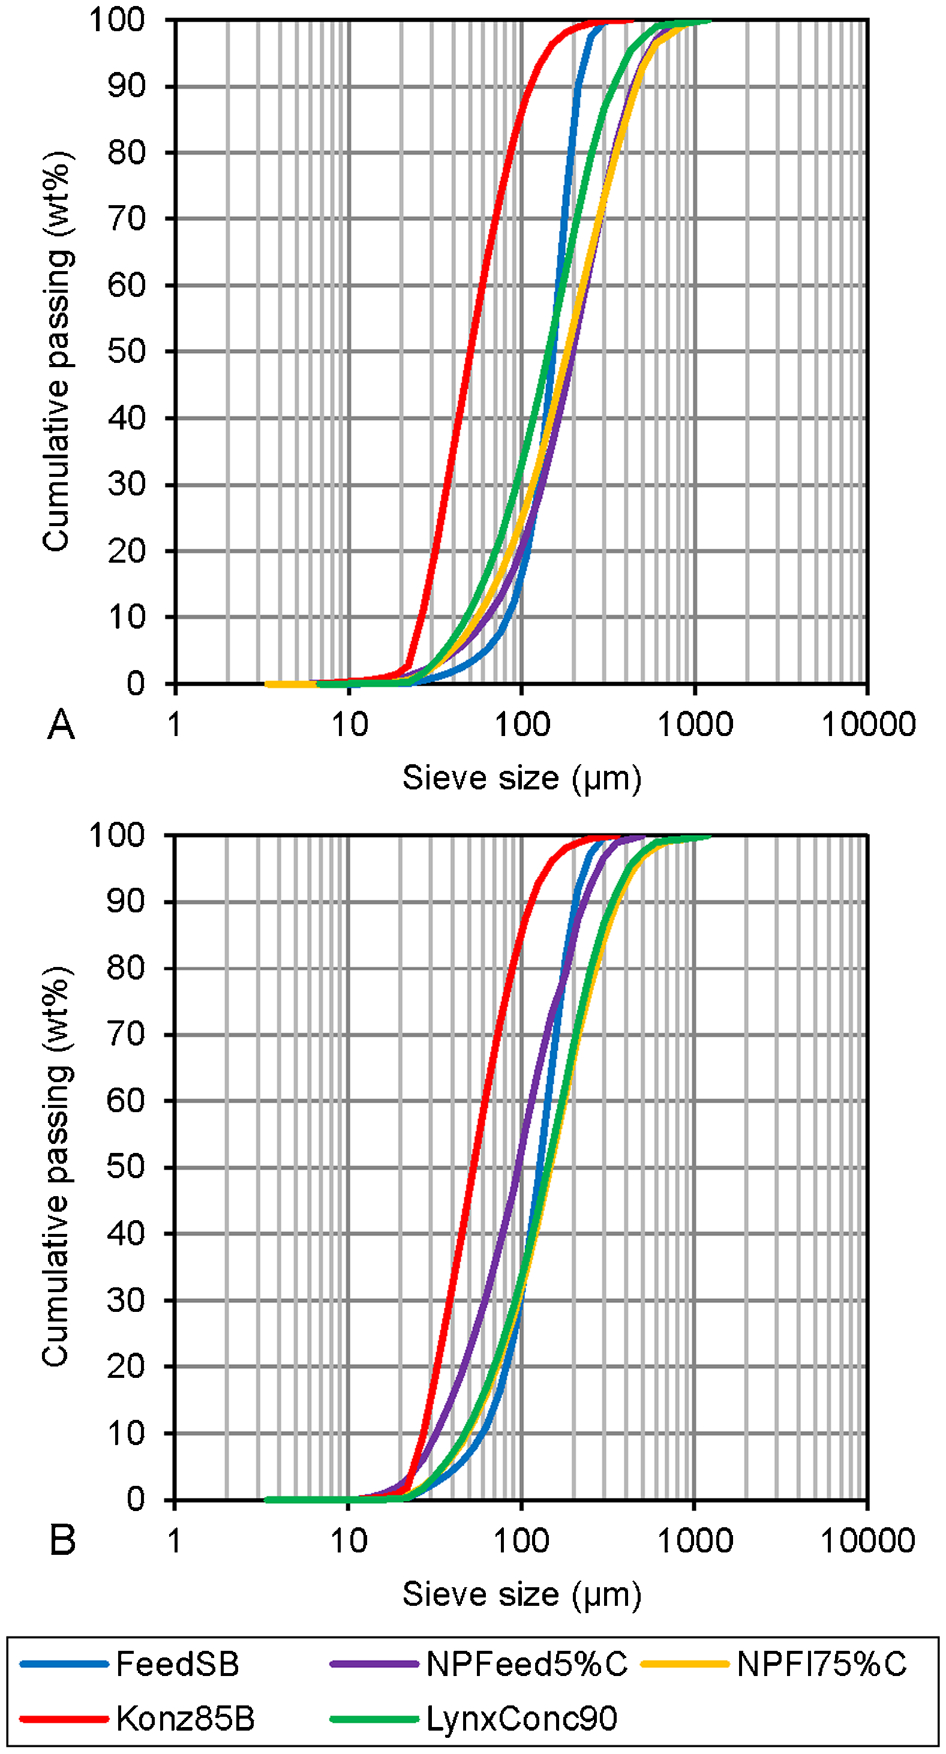
a Cumulative particle size distribution and b cumulative graphite mineral grain size distribution
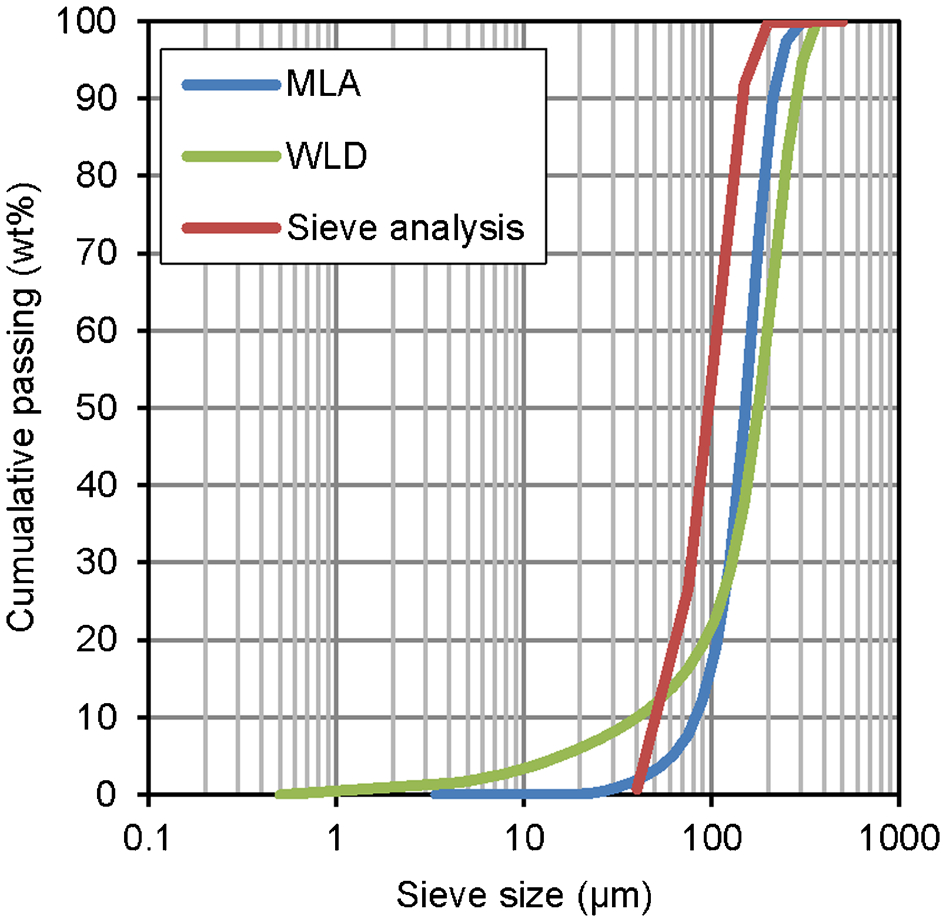
Comparison of particle size distributions as determined by sieve classification, wet laser diffraction (WLD) and mineral liberation analysis (MLA) for sample FeedSB. (Note: comparative data for all samples are included in Supplementary Material.)
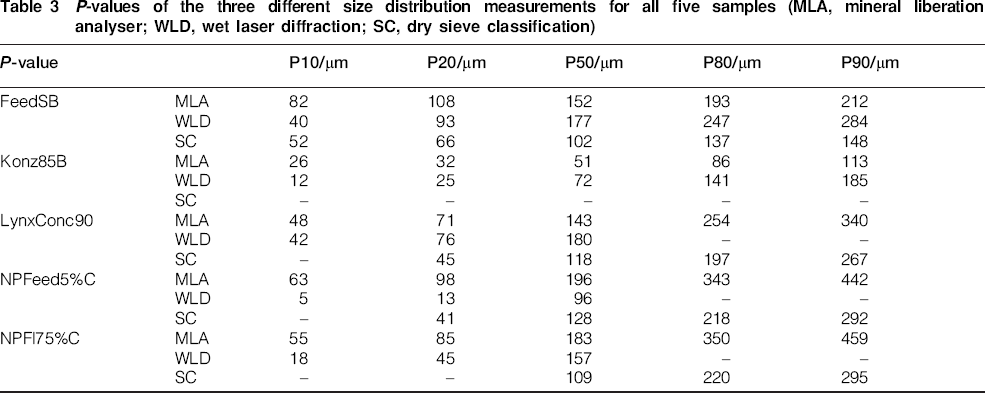
For three of the five studied samples (FeedSB, Konz85B, and LynxConc90), particle size distributions as determined by MLA are between those determined by sieve classification and laser diffraction. In contrast, the results for NPFeed5%C and NPFl75%C obtained by MLA show a somewhat coarser particle size distribution in comparison to the two other methods (Table 3). This is tentatively attributed to minor preferred orientation of the graphite flakes into the polished sample surface, an effect that may be particularly pronounced for graphite-rich samples. Finally, it is fair to conclude that MLA analysis provides a realistic assessment of particle size distributions of graphite feed and concentrate samples.
P-values of the three different size distribution measurements for all five samples (MLA, mineral liberation analyser; WLD, wet laser diffraction; SC, dry sieve classification)
Unlike the parameters discussed above, quantitative mineral association and liberation data cannot be acquired with methods other than SEM-based image analysis; unless one uses optical microscopy, which is both very laborious and difficult for a mineral such as graphite which tends to obscure all associated mineral grains by forming thin coatings during sample preparation. Usage of SME-based image analysis thus yields very tangible information that can otherwise not be determined. The mineral association calculations show that quartz, feldspar and micas are the principal minerals associated with graphite in all samples (Fig. 5). An exception is concentrate sample Konz85B. In this sample, the secondary alunite group minerals are the most commonly attached to or intergrown with graphite. It is obvious that this is a phenomenon that would be irrelevant to beneficiation, since the alunite group minerals formed during sample storage.
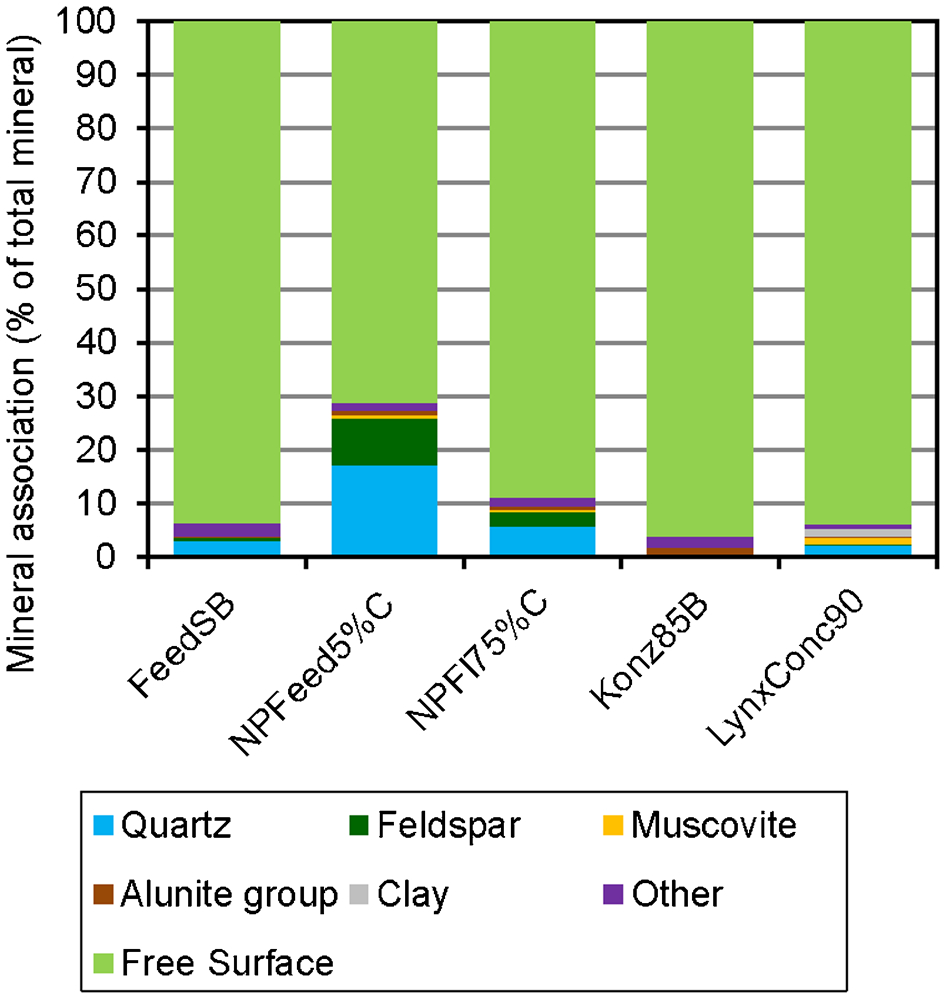
Mineral association for graphite mineral grains
Based on the results of the mineral association parameters in Fig. 5, about 90% of the total graphite mineral grain surface in the three concentrate samples is free surface. Even the two feed samples have very well exposed mineral surfaces, with FeedSB having more than 90% and NPFeed5%C having about 70% free surface of graphite mineral grains. The mineral liberation by free surface curves for graphite (Fig. 6) for concentrate samples LynxConc90, Konz85B as well as feed sample FeedSB are marked by excellent liberation, in good agreement with the predominance of free surface. Similarly, the distinctly lower amount of free surface finds its expression in lower liberation of graphite in concentrate sample NPFl75%C. Feed sample NPFeed5%C, with a very low content of graphite, is also marked by low graphite liberation. Liberation may be increased in both cases by further comminication. The mineral liberation by free surface curve is relevant for the flotation process as it gives information about the quality of the direct contact of the graphite to the flotation reagents. Calculated mineral grade recovery curves (Fig. 7) can be used to assess the maximum potential recovery at a given grade. This study clearly demonstrates that for all samples, except sample NPFeed5%C, high graphite recovery rates can be achieved at high mineral grades.
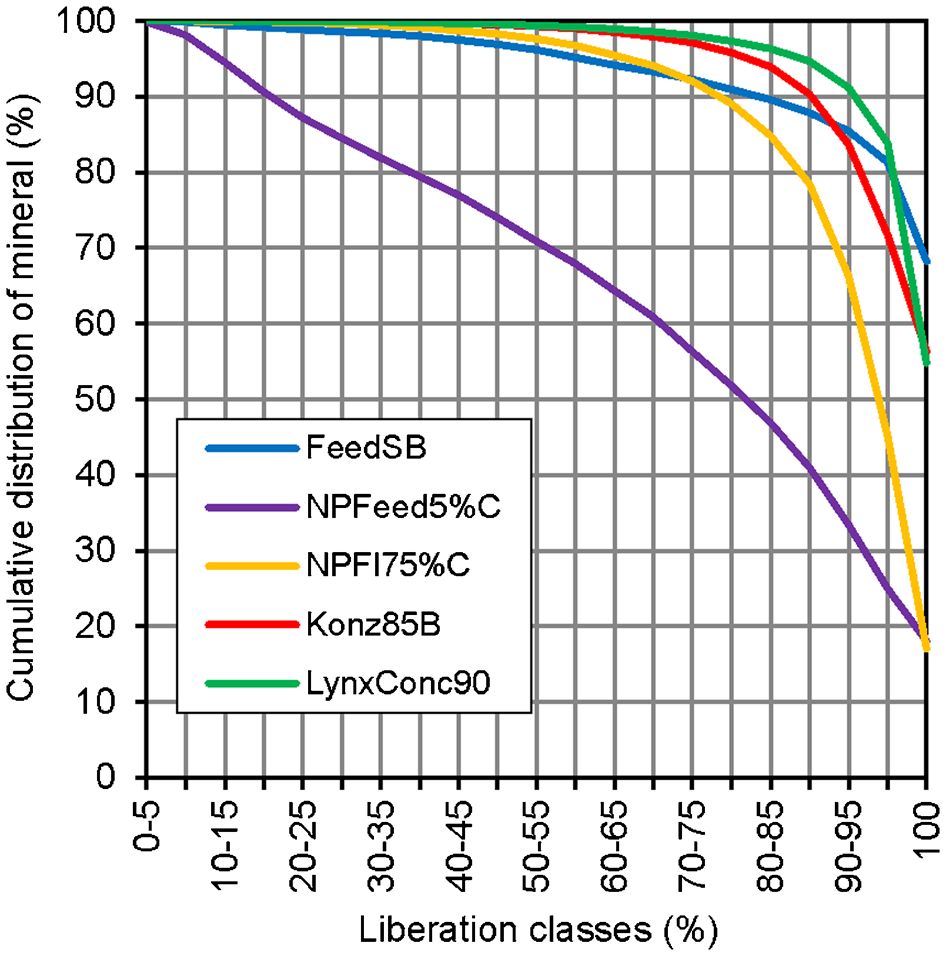
Mineral liberation by free surface curve for graphite
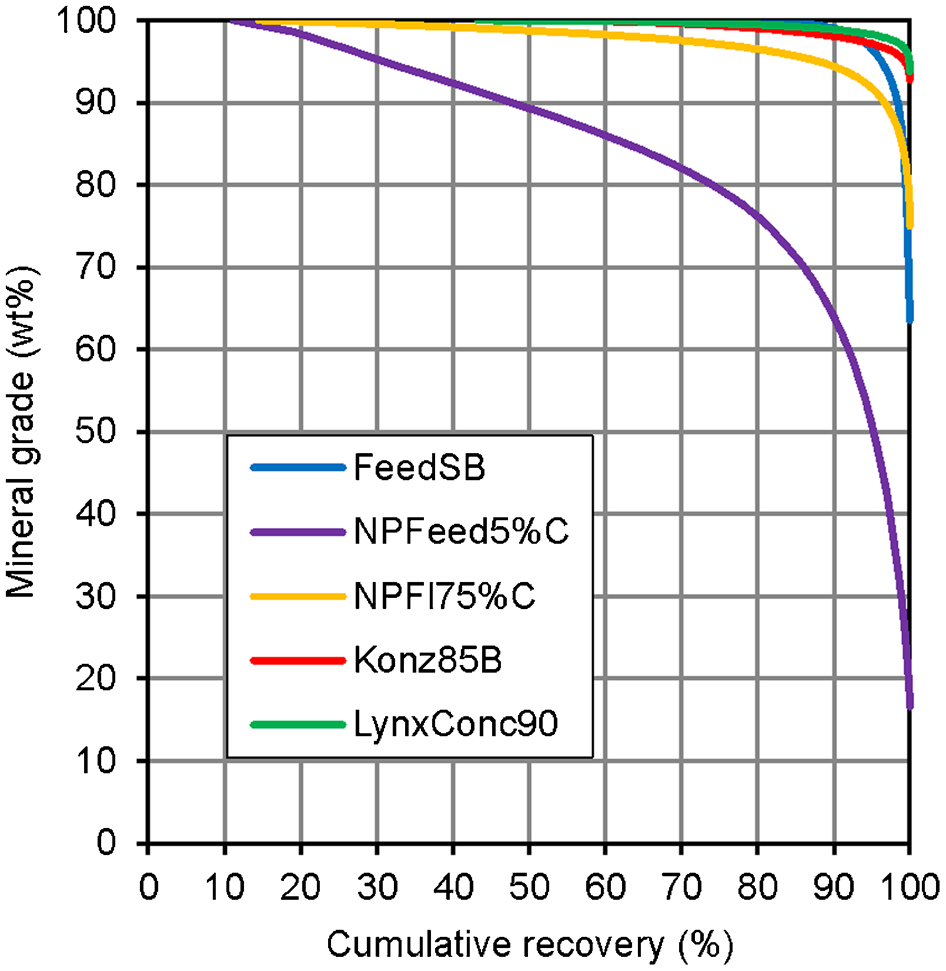
Calculated mineral grade recovery curve for graphite
Conclusion
The present study reveals that automated SEM-based image analysis can be used effectively to characterise graphite raw materials and beneficiation products to predict and monitor the effects of mineral processing. The comparison of results with those obtained by well-established analytical methods yields good to excellent agreement with respect to quantitative mineralogy, carbon content, as well as particle size distribution. In addition, results of SEM-based image analysis provide access to tangible data on mineral grain size distribution, mineral association and liberation – information that cannot be obtained by other analytical tools currently available.
Footnotes
Acknowledgement
The authors would like to acknowledge the provision of sample material for this study as well as additional analyses by the AMG Mining AG (formerly Graphit Kropfmühl AG). Fiona Reiser from AMG Mining AG is thanked for providing further information on the samples and related literature as well as data of comparing analytical techniques and kindly reviewing of this study. Authors thank Bernhard Schulz from the Department of Mineralogy (TU Bergakademie Freiberg) for support during the MLA investigation and Martin Rudolph (Helmholtz Institute Freiberg for Resource Technology) as well as Annet Kästner (Department of Mechanical Process Engineering and Mineral Processing, TU Bergakademie Freiberg) for the realisation of the laser diffraction analysis. Robert Möckel (Helmholtz Institute Freiberg for Resource Technology) is thanked for conducting the quantitative XRD analysis. The authors thank an anonymous reviewer for thorough review. Special thanks are due to William John Rankin (Co-editor editor) for his editorial handling and helpful comments to improve the submitted version of the manuscript. Discussions and support by the researchers of the Nordic Researcher Network on Process Mineralogy and Geometallurgy (ProMinNET) is gratefully acknowledged.