
Abstract

Comments regarding the paper ‘Factors influencing overbreak in the Barkers orebody, Kundana Gold mine: narrow vein case study’ by P. C. Stewart, R. Trueman and I. Brunton. 2011.
Franklin (1993) defines empirical design as quantified judgment based on experience. He further states that empirical methods often proof ‘closer’ to the ‘truth’ than the apparently more precise predictions of theoretical analysis, adding that based on real data empirical methods provide a standard against which theoretical predictions are measured and can be judged. Mathews et al. (1981) stated that empirical methods based on back analysis are powerful predictive tools, particularly if combined with numerical modelling and analysis techniques. The author believes in the power of empirical methods.
The stability graph is an empirical method developed by Mathews et al. (1981) for designing open stopes. The method has since gained worldwide recognition, and is widely accepted for open stope design. The author greatly acknowledges the roles of the following contributors to the advancement of the method following its initial inception: Potvin (1988), Stewart and Forsyth (1995), Pakalnis and co-workers (Nickson, 1992; Milne, 1997; Clark, 1998; Caceres, 2007), Diederichs and Kaiser (1996), Suorineni (1998), Suorineni et al. (1999a,b; 2001b), Hadjigeorgiou and co-workers (Hadjigeorgiou et al., 1995; Germain and Hadjigeorgiou, 1996) and Trueman and co-workers (Mawdesley et al., 2001; Mawdesley, 2002; Stewart, 2005; Stewart et al., 2007).
The author has followed with interest the contributions of Trueman and his co-workers to the advancement of the use of the stability graph. This rejoinder discusses issues related to the stability graph application that are raised in Stewart et al. paper in Vol. 120(2), pp. 80–89 of this journal. The authors’ attention is drawn to a recent publication by Suorineni (2010) on the subject that gives details of the achievements and developments in the use of the stability graph in the past 30 years, and identifies research needs for further improvement in the performance of the method. He writes:
‘The present tendency for authors to arbitrarily choose between the original and modified stability number factors result in incomparable data that cannot be combined, while the different transition zones result in different interpretations of the stability state of stopes. The review also shows that there is need for factors that account for stope stand-up time, blast damage, and a gravity factor that is stress factor dependent. There is also a need to develop procedures for determining stability of open stope surfaces that are made of backfill. The inexperienced user and practitioner unaware of the various versions of the stability graph should be conscious of the different versions and types of stability graphs to make the appropriate choice for his/her design. The stability graph should also be used with caution, when applied to narrow vein orebodies because no version of the graphs accounts for orebody thickness in the definitions of the stability states.’
Figures 1 and 2 show some of the consequences of the uncoordinated and arbitrary use of the stability graph factors and transition zones. Figure 1 shows that even with points more than 400, different transition zones result contrary to the 150 points required to have reproducible transition zones as suggested by Stewart and Trueman (2001), and restated in Stewart et al. (2011). Statistically, it is not the number of total points in the database that matters in this case, but how the points are distributed to the various stability states. In Fig. 2, the stability states of stope surfaces plotted as X and Y are very uncertain as they depend on the stability graph version used! The question here is ‘which interpretation is correct?’
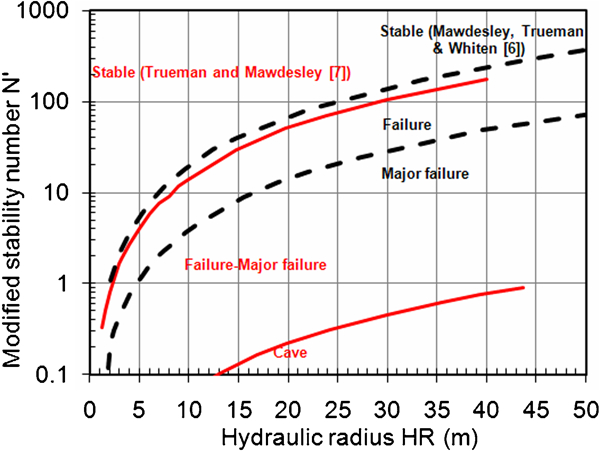
Effect of data quantity and reliability of empirical methods: boundaries replotted from Mawdesley et al. (2001) and Trueman and Mawdesley (2003) (Suorineni, 2010)
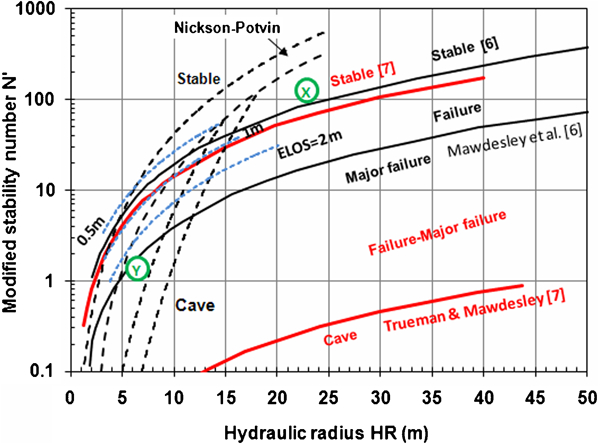
Stope stability states calculated with different factors plotted on stability graph with different transition zones showing that depending on each transition zones stope stability states are different (Suorineni, 2010)
Trueman and co-workers prefer to use the original stability graph factors rather than the Potvin (1988) modified factors, arguing that there is no significant difference between the two. Mathews et al. (1981) wrote:
‘The divisions (i.e. stope stability state boundaries) are considered to be sound conceptually but it is emphasized that at least two of the three sites should be revisited to obtain additional data. …. The basic problem is that site data was collected in the early stages of the study; sufficient data was collected to develop the concepts presented but not to confirm them.’
Potvin (1988) confirmed the concepts with 175 case histories from 34 mines, resulting in the calibration of the original stability graph factors. As stated by Suorineni (2010), the size and quality of an empirical database dictates the reliability of its predictions. Therefore, both intuitively and statistically, the Potvin (1988) modified factors must be more reliable than the earlier factors based on a limited case histories.
Another argument by some researchers and practitioners is that the stability graph should be made site specific. The original stability graph method was based on 26 case histories from 3 mines. The modified stability graph (Potvin, 1988) was based on 175 case histories from 34 mines. The extended stability graph by Mawdesley et al. (2001) and Mawdesley and Trueman (2003) contained over 400 case histories from Mt Charlotte Mine in Australia, and other mines. In the stability graphs developed from all these databases from the different mines, the stability states of stopes have clustered well. That is to say, in each stability graph, clear boundaries can be defined between the stability states of stopes, despite the fact the data came from different mines with different ground and operational conditions. However, some authors (Bawden, 1993; Stewart and Forsyth, 1995; Diederichs and Kaiser, 1996; Hutchinson and Diederichs, 1996) advocate site specific stability charts. Stewart et al. (2011) seem to support this view today. Stewart and Trueman (2001) wrote:
‘There is substantial anecdotal evidence that site specific effects may result in erroneous stability predictions. Greer (1989) back analysed Thompson mine data to determine how well Potvin's modified stability chart predicted stability at this particular site. Greer's analysis (Bawden 1993) found unstable hangingwall points were largely misclassified as stable. Although this particular case uses Potvin's modified stability graph, the Extended Mathews Stability Graph would have predicted similarly erroneous stability predictions. Greer identified operational conditions such as blast damage, the effect of adjacent sandfill and delays to filling as likely causes for the misclassification. Early versions of the vertical crater retreat method were used during this period of the Thompson mine life. This method can result in significant blast damage due to inherently more blasting confinement and higher powder factors than long-hole stoping. Additional examples of inaccurate stability prediction are the Winston Lake hangingwalls (Milne 1997). The assumption that sandfill provides the same abutment characteristics as solid rock could be a source of erroneous stability prediction for the Winston Lake mine. Milne concluded, from comprehensive hangingwall monitoring at the Winston Lake mine, that treating backfill limits the same as rock abutments is overly optimistic. The Thompson and Winston Lake mines are both examples of sites where apparent site-specific effects may have impacted adversely upon the ability of a generic stability graph to predict stability. However, it could be argued that these effects are not truly site-specific. The authors of this paper propose that similar operational conditions would have resulted in erroneous predictions at any mine site and are therefore not truly site specific.’ (Emphasis mine).
The reason for some researchers and practitioners suggesting site specific stability graphs is to account for site specific operating conditions, whether ground or operational including equipment. As pointed out earlier, all recognised versions of the stability graph have data coming from more than one mine. This definitely suggests the data is from a range of ground and operational conditions. However, clear clusters exist between the various stope surface stability states. Hence, there seems no justification to advocate for site specific calibrations, when data from one mine are misclassified. Rather, it is apparent that in those cases, we must be doing something fundamentally wrong.
The question in this case is ‘what are we doing wrong in trying to apply the stability graph method developed for wide orebodies to narrow vein orebodies?’. The answers to this question may be hidden in the assumptions made in the development of the method among which are:
The method is applicable to two-way span exposed excavation surfaces, i.e. excavations with span to strike lengths ranging between 2∶1 and 0·5∶1. In narrow vein orebodies this ratio will normally exceed 4∶1, making them one-way span excavations to which the shape factor definition is not applicable. For one-way spans, the hydraulic radius remains relatively constant, and will not reflect the effect of changing round conditions.
Deficiencies in the Q and therefore Q′ system. The Q system implicitly assumes that all joint systems are continuous, and hence Rock Quality Designation/Joint Set Number (RQD/Jn) is an indirect block size. In geotechnical joint mapping practice, all natural fractures are to be mapped and stereographic plots used to determine number of joint sets, and hence Jn in Q′. In most cases, the mapping exercise does not discriminate between joint trace lengths or continuity, and hence not all joint sets identified in a stereonet are necessarily continuous, and will result in underestimation of Q or Q′, and therefore N or N′. Mathews et al. (1981) suggest only joints with trace lengths equal to or greater than 3 m be considered. The problem is, how many geotechnical engineers take this recommendation into consideration in the assessment of Q′ for open stope stability assessment? In narrow vein mining with open stopes, the required joint trace length to consider might be <3 m since joint continuity is excavation size dependent. Suorineni et al. (2008) provide guidelines for taking excavation size into account in defining joint continuity for the determination of Q or Q′.
How to handle blast induced fractures. It is well recognised that the potential impact of blast induced damage has more severe consequences in narrow vein mining. Mathews et al. (1980) note that difficulty arose in estimating RQD, as blast fractures became misleading. Generally, it was felt that the user of the classification system (i.e. Q system) needs to be experienced in its use to get good reproducibility. The authors cautioned against the use of the volumetric joint count Jv approach by Palmström (1982) to estimate RQD.
Are we applying the method to the right mining method in the correct ground conditions? Mathews et al. (1981) states that in general, if open stoping is being used the rock quality will be high and the most likely type of failure is one in which geological structure is a controlling factor. Stewart et al. (2011) state that their database contains rock mass qualities Q′ between 0·01 and 90. One can also question why 100 data points were rejected! The Potvin (1988) database contained 175 points including the original Mathews et al. (1981) database.
Tatman (2001) provides an excellent commentary on mining in North America between 1970 and 1990, with particular emphasis on the shifts between open pit mining to bulk mining, and how this shift influenced narrow vein mining negatively. Between 1970 and 1980, there was a rapid decline in underground mining in North America in favour of open pit mining as low grade deposits became economic. In the intervening period, expertise in underground mining had been lost to open pit mining and many of the management and technical staff employed to operate the new wave of underground mines, coming from the surface mining operations, brought little experience in underground mining. The experience with large volume mining in open pits was thus transferred to underground as bulk mining methods. Note that the stability graph method for open stope mining (bulk mining method) was developed at the beginning of the shift (1980) from surface to underground mining. Consequently, as a result of loss of expertise in narrow vein mining (traditionally manual and labour intensive), coupled with the tendency to reduce underground mining cost, the bulk mining methods, including the stability graph method, were adopted in narrow vein mining, with little calibration. The issues arising today, some of which are highlighted above, in the use of the stability graph in open stope mining are therefore not surprising.
Recent publications such as those by Trueman and co-workers and the author (see Suorineni et al., 2001; Suorineni, 2010) are now addressing the issues needed to be resolved before bulk mining methods can be effectively applied in narrow vein mining. Lizotte (1993) conducted a comprehensive review of longhole/blasthole stoping for narrow vein mining in Canada. Echo Bay Mines Ltd and Pakalnis and Associates (1998) and Clark (1998) investigated the impact of longhole blast patterns on narrow vein mining. They concluded that in narrow vein open stope mining blast induced overbreak can result in high levels of unplanned dilution, in the best designed stopes. Blasting can affect stope stability as a consequence of its tendency to induce additional fractures in the rock mass, in particular, if the blasting practice is poor. Blast induced fractures lower RQD and increase Jn in Q′, resulting in reduced stability number N. Thus, it seems logical to account for the effect of blasting directly through these parameters. It is unclear why this effect should be accounted for in the gravity factor C as suggested in both Stewart et al. (2011) paper and by Mathews et al. (1981) through the use of the excavation support ratio, a factor that is more related to time (see Suorineni, 1998) and excavation importance.
The issue of backfill stability is raised in the paper by Stewart et al. (2011), who concluded backfill abutments be treated as solid rock. Backfill issues have been addressed by Caceres (1997). The stability number (N or N′) is a function of Q′ (a modified Q, Barton et al., 1974). Cemented backfill can be accepted as a weak rock, considering the low compressive strength associated with these materials. Løset (1997) states that the Q system as developed primarily suited hard, jointed rock masses, adding that in weak rock evaluation of the Q value may be more difficult and must partly be based on judgment and experience. There is a fundamental difference between weak soft rock and weak hard rocks. The Q system is adequate for the latter and not the former. A soft rock with RQD = 100% does not have the same competence as a hard strong rock mass with RQD of 100%. There is therefore need for a classification system for soft rocks, and its application to backfill in predicting stability of backfill faces that form parts of an open stope.
The issue of time in the performance of rock engineering structures has been recognised in both soft and hard rocks. Cristescu and Hunsche (1998) give details of soft rock time dependent behaviour. Daemen (2009) gives an exhaustive review on the importance, and difficulty, of dealing with the time dependency of engineered structures in, on, or with hard rock. With reference to underground mining approaches to integrating time dependency in the engineering of structures in, with, or on rock he writes:
‘Suorineni & Kaiser (2002) address the issue of standup time of large mine stopes on the basis of, as stated by the authors, a limited number of cases. Nevertheless, they integrate time into a stope stability graph, but conclude that ‘More data is required to fine-tune the stand-up time limits to further improve the reliability of the proposed stand-up time dependent stability graph.’ Of particular value is the strong emphasis placed by these authors on the need to incorporate the time factor in the design of mine stopes, and of its critical importance for mine planning and operations.’ (Emphasis mine).
It is unknown what the role of time is in the case histories presented by Stewart et al. in their paper, and indeed in previous case histories since Potvin (1988). Figure 3 presents examples of time dependent excavation stability in both mining (stope stability) and civil engineering (tunnels) from various sources. Could this be one reason why some stope stability state data do not fall within the defined stability zones in the generic stability graphs?
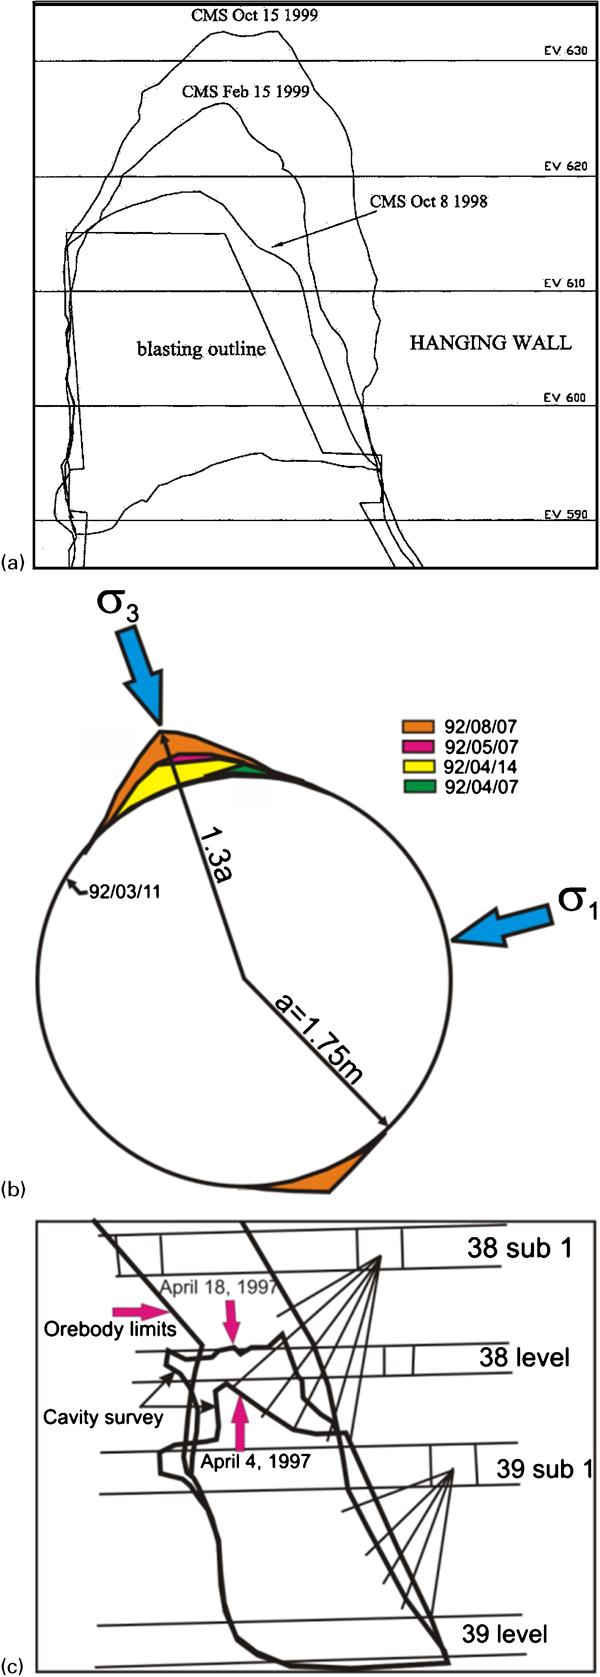
Effect of time on stability of underground structures
Finally, it has long been recognised that one of the limitations of the stability graph before 1998 was its inability to account for the presence of faults. Evidence of this limitation is cited in Quesnel and Gordon (1991), Reschke and Romanowski (1993), Stewart and Forsyth (1995) and Hutchinson and Diederichs (1996). Potvin and Milne (1992) stated as follows:
‘The design technique (referring to the stability graph method) cannot account for discrete geological features such as faults, shear zones, dykes or waste inclusions which may act to cause instability.’
It was on these grounds Suorineni (1998) developed a fault factor for incorporation into the stability graph method. Details of the procedure can be found in (Suorineni, 1999a,b; Suorineni, 2001a). The genesis of most orebodies associates them with discrete geological structures such as faults. Narrow vein orebodies are more prone to this association, and the work of Dominy and co-workers (Dominy et al., 1996, 1999) provide overwhelming evidence for this assertion.
Stewart et al. (2011) states fault zones are considered as a separate domain, but as pointed out earlier application of the Q system to weak rocks is a recognised challenge. Second, not all faults can be considered as materials. More importantly, it is not just material in the fault zone that affects stope surface stability but the influence of the fault on the stresses and the effect on the stope surface. The effects of the former on stability depends on several factors, and is rather complex. Unfortunately, the Australian extended stability graph database is not made public, as others have done, for other researchers and practitioners in the field to use. Further insight by the authors will be useful.